There are two exchange-traded funds that passive investors are considering for their long term wealth accumulation.
- The iShares Core MSCI World UCITS ETF – Ticker IWDA – Listed on the London Stock Exchange
- Benchmark Index: MSCI World Index (1,613 equity holdings)
- Accumulating
- USD
- Total Expense Ratio: 0.20%
- The Vanguard FTSE All-World UCITS ETF – Ticker VWRA – Listed on the London Stock Exchange
- Benchmark Index: FTSE All-World Index (3,416 equity holdings)
- Accumulating
- USD
- Total Expense Ratio: 0.22%
Both are UCITS funds, domiciled in Ireland so they are more tax-efficient in terms of dividend withholding taxes and for retail investors, you have less estate duty/inheritance tax issues.
VWRA is the new kid on the block. It debuted last year (I wrote about the two ETF here). As VWRA is newer, the bid to offer spread is not as tight as IWDA, which is a well traded and rather liquid ETF.
Nevertheless, the bid-offer spread for VWRA can be within 20 basis points (0.20%) but sometimes I do see that it can widen. Sometimes it can be at 7.5 basis points.
The biggest difference is the benchmark indices that both ETF tries to replicate. You may be deciding which ETF to invest in based on your philosophy towards MSCI World and FTSE All-World Index.
I do question whether we are fussing over something that makes significant impact or whether the significance is pretty low.
Which is what this article sought to explore.
FTSE All World vs MSCI World
Each index have their own methodology. Each index provider (FTSE, MSCI) have their own methodology as well.
MSCI World Index captures the large and mid cap representation across 23 Developed Markets (DM) countries. DM countries include Australia, Austria, Belgium, Canada, Denmark, Finland, France, Germany, Hong Kong, Ireland, Isreal, Italy, Japan, Netherlands, New Zealand, Norway, Portugal, Singapore, Spain, Sweden, Switzerland, the UK and the US.
FTSE All-World Index is a market-capitalisation weighted index trying to capture the performance of large and mid-cap stocks from the FTSE Global Equity Index series. The index covers developed and emerging markets.
Countries include Australia, Austria, Belgium, Brazil, Canada, Chile, China, Columbia, Czech Rep, Denmark, Egypt, Finland, France, Germany, Greece, Hong Kong, Hungary, India, Indonesia, Ireland, Isreal, Italy, Japan, Korea, Kuwait, Malaysia, Mexico, Netherlands, New Zealand, Norway, Pakistan, Peru, Philippines, Poland, Portugal, Qatar, Russia, Saudi Arabia, Singapore, South Africa, Spain, Sweden, Switzerland, Taiwan, Thailand, Turkey, UAE, UK, USA.
The difference is mainly whether you wish a single fund to give you exposure to both developed and emerging markets.
If so, the choice is VWRA. If not it is IWDA.
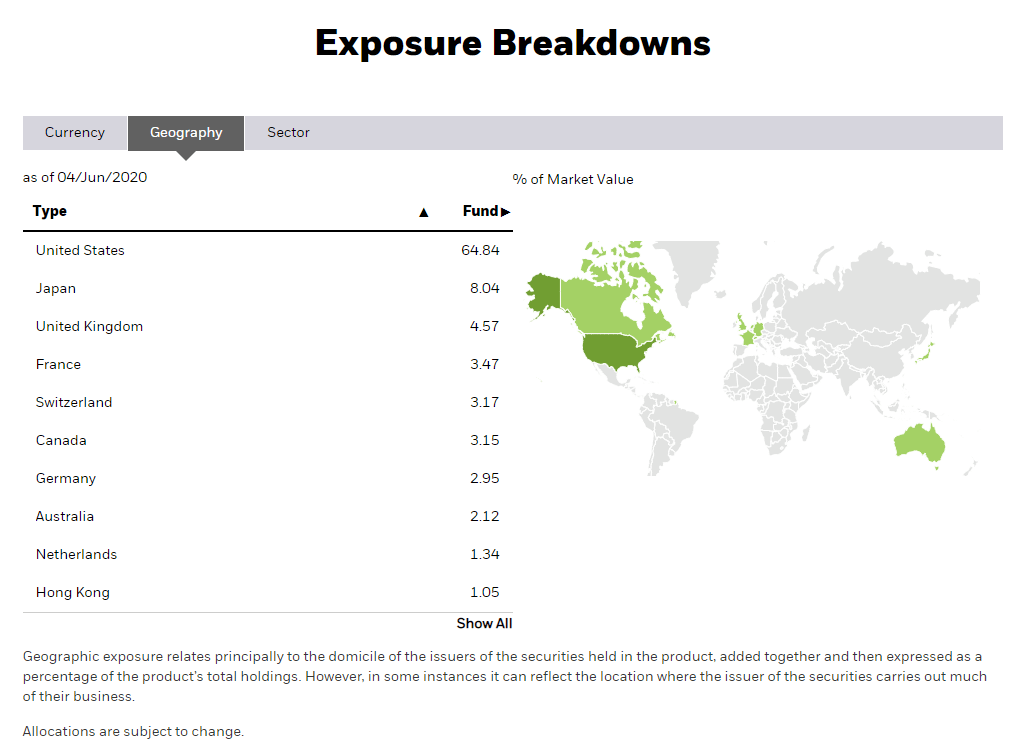
Here is the geographical composition of IWDA:
Here is the geographical composition of VWRA:
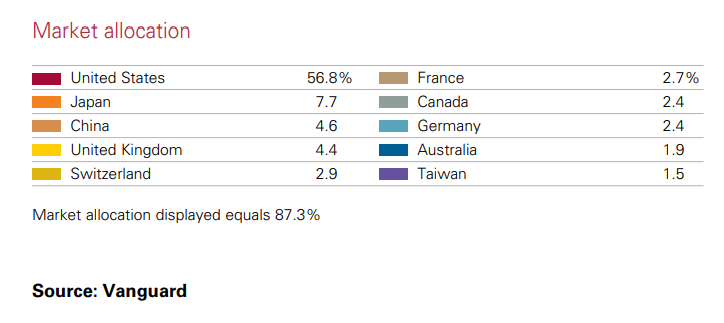
The main difference is the composition of the United States and China. IWDA do not have China exposure while VWRA currently has higher China exposure (as well as emerging markets countries) and lower United States.
Does Emerging Market Exposure Give Outperformance?
We compare performance next.
The good thing about ETFs is that we can review the history of returns of the benchmark index the ETF is trying to replicate to find out how they do.
I have access to MSCI World index data but not FTSE All-World Index.
However, I think the MSCI All Country World Index (ACWI) should match up very well to the FTSE All-World Index. The MSCI All Country World Index seeks to capture the representation of 23 developed markets and 26 emerging markets.
I wanted to use the MSCI World and MSCI ACWI net of dividends. MSCI provides both index where withholding taxes are deducted from the dividends re-invested (net) and withholding taxes not deducted (gross).
The net index would probably be more conservative. Lower return as well.
However, the earliest data that I have for the net index is in 1999 but for the gross index, I will have the data from 1988 onwards.
This means I have 22.5 years worth of returns data from Jan 1988 to May 2020.
My first thought is that in some years MSCI World will do better and in some years MSCI ACWI will do better.
Here is the month-by-month returns of MSCI ACWI minus MSCI World:
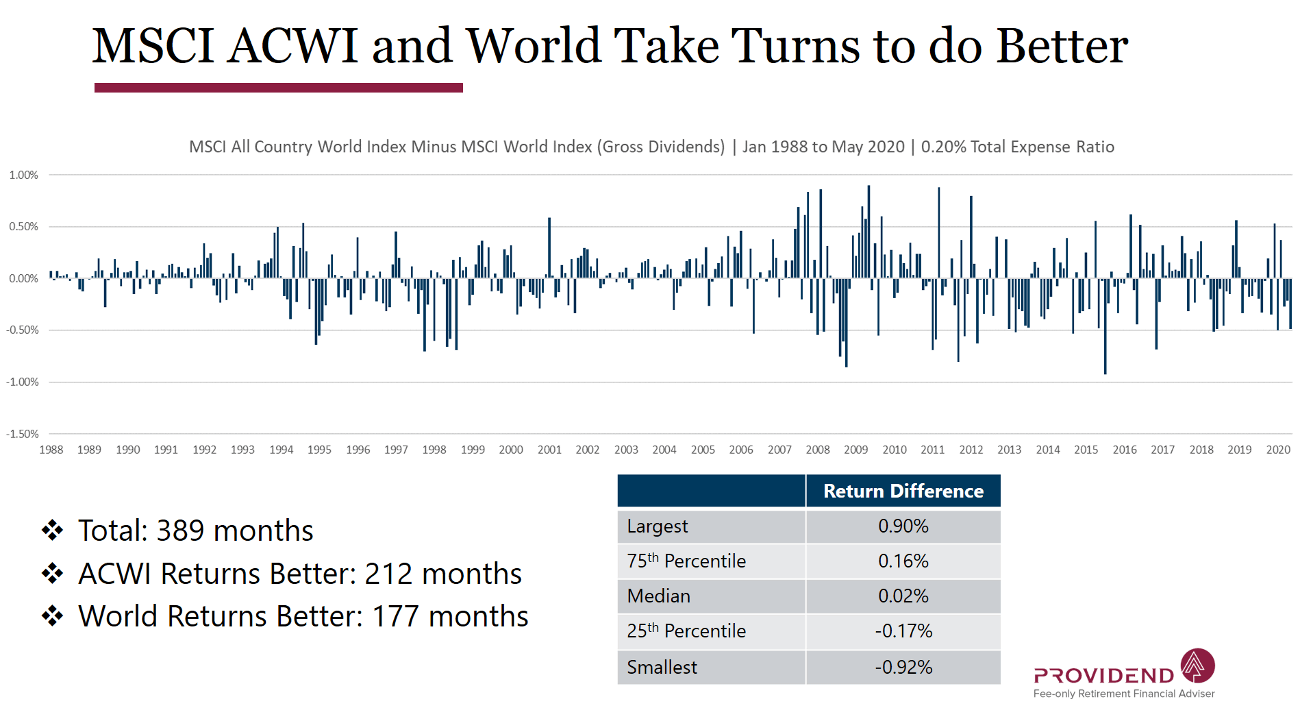
There are a lot of small bars. If the bars are above zero, ACWI has higher return for that month. If lower, than MSCI World did better. There are more months where MSCI ACWI have higher returns.
However, the largest difference is less than 1% for a month. On average, the difference is very small (but they do compound over time.)
You will also notice that there isn’t a prolong period where ACWI did better than World.
Reviewing the Long Term Returns of MSCI World and MSCI All Country World.
You are probably less interested in the month by month returns if you are investing for the long term.
So it is only natural we pit the long term returns of the MSCI World vs the MSCI All Country World.
Your experience will differ depend on which period you invest in. You could have started investing in a period where the returns are very good or you could have started investing in a period where returns are a bit gone case.
So let us look at the 5-year rolling returns and 10-year rolling returns of these 2 indexes. For those who are new to rolling returns, you can read this article I wrote at Providend on what are rolling returns, and how reviewing rolling returns of a portfolio may give you greater conviction to invest.
We have 389 months between 1988 to May 2020.
5-Year Rolling Returns
There were 330 5-year periods between 1988 to May 2020 if you roll month-by-month.
1 rolling period will be from 1 Jan 1988 to 31 Dec 1992. The next rolling period will be from 1 Feb 1988 to 31 Jan 1993 and so on and so forth.
If I were to plot out the rolling returns of MSCI World and ACWI in two lines, we get something like this:
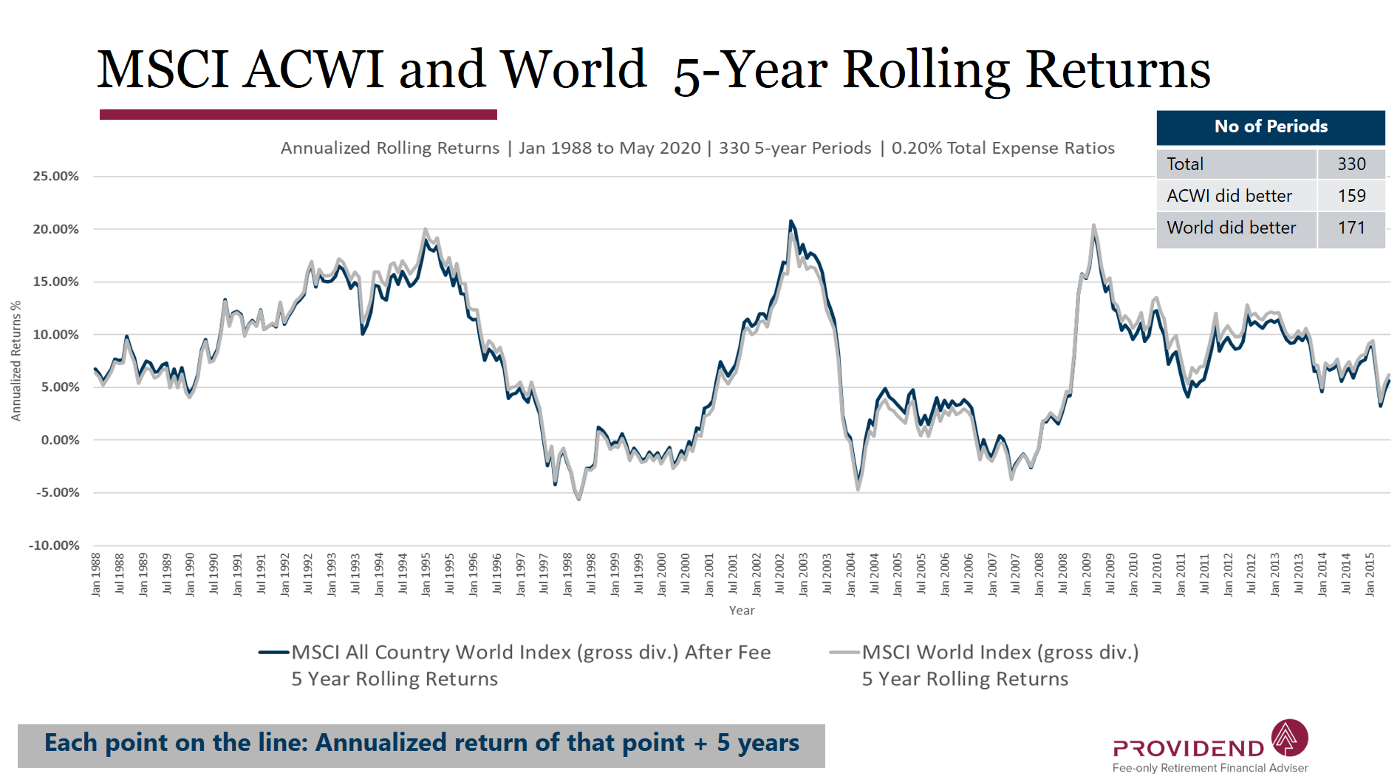
On a 5 year basis, there are some periods where you annualized returns is 7.81%. There are also periods where the 5-year returns are -4.24%.
You can observe how the grey line (MSCI World) hugs close to the blue line (MSCI ACWI). At some part, the difference is greater.
There are 330 5-year period. Of these:
- 159 5-year periods MSCI ACWI did better
- 171 5-year periods MSCI World did better
Magnitude of difference:
| MSCI ACWI vs MSCI World | Annualized Return Difference | Cumulative Return Difference |
| Largest | 1.36% | 6.98% |
| 75th Percentile | 0.51% | 2.58% |
| Median | -0.05% | 0.25% |
| 25th Percentile | -0.71% | -3.50% |
| Lowest | -1.56% | -7.56% |
The difference feels small. Even in the most extreme, the 5-year difference is about 7%.
To give you context, if you earn an annualized return of 6% a year for 5 years, the cumulative return is 33.8. A 7% difference is about 21% performance difference. This is the extreme case.
On an average, the difference is small.
10-Year Rolling Returns
There were 270 10-year periods between 1988 to May 2020 if you roll month-by-month.
1 rolling period will be from 1 Jan 1988 to 31 Dec 1997. The next rolling period will be from 1 Feb 1988 to 31 Jan 1998 and so on and so forth.
If I were to plot out the rolling returns of MSCI World and ACWI in two lines, we get something like this:

On a 10 year basis, there are some periods where you annualized returns is 13.46%. There are also periods where the 10-year returns are -1.30%.
You can observe how the grey line (MSCI World) hugs close to the blue line (MSCI ACWI). At some part, the difference is greater.
There are 270 10-year period. Of these:
- 106 10-year periods MSCI ACWI did better
- 164 10-year periods MSCI World did better
Magnitude of difference:
| MSCI ACWI vs MSCI World | Annualized Return Difference | Cumulative Return Difference |
| Largest | 0.88% | 9.16% |
| 75th Percentile | 0.37% | 3.76% |
| Median | -0.20% | -1.98% |
| 25th Percentile | -0.35% | -3.44% |
| Lowest | -0.84% | -8.09% |
On average, the MSCI World did better than the MSCI ACWI over different rolling returns.
To give you context, suppose you earn an annualized return of 6% a year over 10 years, the cumulative return is 79%. While an 8-9% return difference is about 10% of the difference, I do not think it is a particular deal-breaker.
Conclusion
Which should you choose?
Based on my data
- There are 5-year, 10-year periods the VWRA may do better and there are periods where IWDA will do better
- Difference can vary but I felt it is livable and not such a big difference
Given this, if you are holding IWDA and wanted to get exposure to the emerging markets, your mileage may depend on how much exposure you add. If you choose to switch over to VWRA, there is no guarantee you will notice differences.
If you are holding VWRA, you are more diversified.
The purpose of diversification is not only to diversify away from the risk. It is to capture the returns.
To give an example, suppose the top 25 firms in China, and top firm in South Africa in the next 20 years became a titan, if you invest in IWDA, you would not be able to capture the return.
If you invest in VWRA, you will be exposed to capture it.
That said, emerging markets do come with greater risks and volatility as well.
As a side note, for the past 22.5 years, the standard deviation of MSCI ACWI versus World is 15.03% versus 14.83%.
From the past 22.5 years, emerging markets such as China have grown massively, so VWRA should do well, yet the dent on performance is still not very clear.
This may be because the firms in developed markets have done relatively well as well.
What is more important is to :
- Get started
- Create an allocation
- Start funding and do regular contribution
- Capture the returns
How can You Invest in IWDA or VWRA (or any other Tax-efficient UCITS ETFs on London Stock Exchange)?
VWRA or IWDA can be purchase through a brokerage that allows you to trade shares on the London Stock Exchange (LSE).
Some brokers allows you to trade on the LSE are
- Interactive Brokers.
- Standard Chartered Online Trading
- DBS Vickers
- Saxo
- POEMS
Personally, I use Interactive Brokers to buy and hold VWRA.
Interactive Brokers is one of the most cost-effective platforms to invest in these UCITS ETF that are better tax optimized. Your trading cost would be 0.05% or less.
However, it is more optimized for those who centralized at least U$100,000 of their investments in it. For those with less capital, Standard Chartered Trading and Saxo would be more suitable.
To help you get started with Interactive Brokers, I have written a set of articles explaining the virtues and weaknesses of the broker platform, how you can get started so that it will be a smoother ride for you.
My Comprehensive Interactive Brokers How-to Guides
Interactive Brokers is a great low-cost, financially strong brokerage platform that can be the standard broker for holding your long-term investments. You can access 150 global exchanges, including exchanges such as Singapore, the US, Hong Kong, London, European and Canada.
You will enjoy cheap commissions and zero minimum recurring platform fees or maintenance fees. Convert your funds to different currencies at near-spot rates, paying a flat US$2 fee.
To get started or become familiar with Interactive Brokers, check out my past articles on how to invest with Interactive Brokers. I hope the guides make your life and investing experience easier and brighter.
An Easy Step-By-Step Guide to Setup Interactive Brokers (IBKR)
How to Fund & Withdraw Funds from Your Interactive Brokers Account
How to Convert Currencies in Interactive Brokers
How to Buy and Sell Stocks and Securities on Interactive Brokers
How Competitive are Interactive Brokers Commissions Pricing?
How Safe is it to Custodized Your Money at Interactive Brokers? The things they do better than other brokers.
How Safe is it to Custodized Your Money at Interactive Brokers (2)? Financial strength of IB during recent banking crisis and during Great Financial Crisis
Interactive Brokers have Eliminated the US$10 monthly inactivity fee. More details here.
How to Transfer your shares from Standard Chartered Online Trading to Interactive Brokers
How to trade after-hours and premarket
Create Customized Reports and automatically send them to your email
What is the PortfolioAnalyst Report and Automatically Send the PortfolioAnalyst Report to Your Email
Send Money from TransferWise to Interactive Brokers
Interactive Brokers’ Fluid Interest Income on Cash
Introducing IMPACT by Interactive Brokers
My Research on Other Tax-Efficient Index ETF Long-Term Rolling Returns Research
I do have a few other data-driven Index ETF articles. These are suitable if you are interested in constructing a low-cost, well-diversified, passive portfolio.
You can check them out here:
- IWDA vs VWRA – Are Significant Performance Differences Between the Two Low-Cost ETFs?
- The Beauty of High Yield Bond Funds – What the Data Tells Us
- Searching for Higher Yield in Emerging Market Bonds
- The performance of investing in stocks that can Grow their Dividends for 7/10 years
- Should We Add MSCI World Small-Cap ETF (WSML) to Our Passive Portfolio?
- Review of the LionGlobal Infinity Global – A MSCI World Unit Trust Available for CPF OA Investment
- 222 Years of 60/40 Portfolio Shows Us Balanced Portfolio Corrections are Pretty Mild
- Actively managed funds versus Passive Peers Over the Longer Run – Data
- International Stocks vs the USA before 2010 – Data
- S&P 500 Index vs MSCI World Index Performance Differences Over One and Ten Year Periods – Data
Here are some supplements to sharpen your edge on low-cost, passive ETF investing:
Those who wish to set up their portfolio to capture better returns believe that certain factors such as value, size, quality, momentum and low volatility would do well over time and are willing to harvest these factors through ETFs and funds over time, here are some articles to get you started on factor investing passively:
- Introduction to factor investing / Smart Beta investing.
- IFSW – The iShares MSCI World Multi-factor ETF
- IWMO – The iShares MSCI World Momentum ETF
- GGRA – The WisdomTree Global Quality Dividend Growth UCITS ETF
- Investing in companies with strong economic moats through MOAT and GOAT.
- Robeco’s research into 151 years of Low Volatility Factor – Market returns with lower volatility that did well in different market regimes
- JPGL vs IFSW vs Dimensional Global Core vs SWDA – 22 years of 5-year and 10-year Rolling Returns Performance Comparison
- 98 Years of Data Shows the US Small Cap Value Premium over S&P 500
- 42 Years of data shows that Europe Small Cap Value premium over MSCI Europe
I invested in a diversified portfolio of exchange-traded funds (ETF) and stocks listed in the US, Hong Kong and London.
My preferred broker to trade and custodize my investments is Interactive Brokers. Interactive Brokers allow you to trade in the US, UK, Europe, Singapore, Hong Kong and many other markets. Options as well. There are no minimum monthly charges, very low forex fees for currency exchange, very low commissions for various markets.
To find out more visit Interactive Brokers today.
Join the Investment Moats Telegram channel here. I will share the materials, research, investment data, deals that I come across that enable me to run Investment Moats.


Do Like Me on Facebook. I share some tidbits that are not on the blog post there often. You can also choose to subscribe to my content via the email below.
I break down my resources according to these topics:
- Building Your Wealth Foundation – If you know and apply these simple financial concepts, your long term wealth should be pretty well managed. Find out what they are
- Active Investing – For active stock investors. My deeper thoughts from my stock investing experience
- Learning about REITs – My Free “Course” on REIT Investing for Beginners and Seasoned Investors
- Dividend Stock Tracker – Track all the common 4-10% yielding dividend stocks in SG
- Free Stock Portfolio Tracking Google Sheets that many love
- Retirement Planning, Financial Independence and Spending down money – My deep dive into how much you need to achieve these, and the different ways you can be financially free
- Providend – Where I used to work doing research. Fee-Only Advisory. No Commissions. Financial Independence Advisers and Retirement Specialists. No charge for the first meeting to understand how it works
- Havend – Where I currently work. We wish to deliver commission-based insurance advice in a better way.
Kyith is the Owner and Sole Writer behind Investment Moats. Readers tune in to Investment Moats to learn and build stronger, firmer wealth foundations, how to have a Passive investment strategy, know more about investing in REITs and the nuts and bolts of Active Investing.
Readers also follow Kyith to learn how to plan well for Financial Security and Financial Independence.
Kyith worked as an IT operations engineer from 2004 to 2019. Currently, he works as a Senior Solutions Specialist in Insurance Start-up Havend. All opinions on Investment Moats are his own and does not represent the views of Providend.
You can view Kyith's current portfolio here, which uses his Free Google Stock Portfolio Tracker.
His investment broker of choice is Interactive Brokers, which allows him to invest in securities from different exchanges all over the world, at very low commission rates, without custodian fees, near spot currency rates.
You can read more about Kyith here.
- My Dividend Experience Investing in UCITS iShares iBond Maturing in 2028. - April 23, 2024
- We Invest into Popular Funds When They Are Popular, Exactly When They Started Turning to Shxt. - April 22, 2024
- Meal Prep 2.0 – Cooking Your “Go-to” Meal that You Look Forward to Eating Everyday. - April 21, 2024
Paul
Tuesday 26th of September 2023
IMID (SPDR MSCI ACWI IMI UCITS ETF) is also a good choice now, with 0.17% total expense ratio.
Kyith
Sunday 1st of October 2023
Hi Paul, thanks for the heads up!
ETFanon
Sunday 3rd of September 2023
I still prefer IWDA over VWRA due to higher risk with developing countries (just look at China tech). Large MNCs like APPL or NVDA already have high exposure to developing countries so they do capture their growth. If you compare the performance of the 2 ETFs over past couple of years, IWDA probably outperform VWRA. The lower cost helps too.
Kyith
Saturday 16th of September 2023
I am ok with that perspective. But i will say that you are using qualitative factors to judge things. The reason why returns OVER THE LONG RUN is higherfor emerging markets is due to the risk. If there is no risk, in any form, then the AAPL and NVDA should not command that high of return. Couple of years is a very short period! Perhaps the question to you is... if you live through 1999 to 2009... would you form the same opinion? it allows you to see whether there are recency bias in that judgement call.
Raul
Sunday 26th of February 2023
Hi Kyith, what are the IBKR commission charges for buying an ETF at the London exchange compared to the US exchange? For example - If someone DCA 1k usd/mth for an all world ETF in US market OR they buy 1k USD equivalent amount in London exchange for similar ETF - how will the yearly commission differ. Seems at fixed rate UK will be more costly?
Kyith
Monday 27th of February 2023
It is more costly, but it is still a low figure. The commission rate is around 5.5 basis points or 0.00055%.
Ioan
Wednesday 30th of March 2022
Hello Please give me an advice about choosing one of this 3 ETFs : 1) CSPX (pros : higher returns , USA is the best economy probably will be also in the future , cons : higher price per unit 420 euro , so if I would invest once in a year I will miss some accumulating dividends ) 2) VWRA (pros : many companies , big diversification , smaller price per unit - 102 euro so i can invest at smaller intervals and so I will have a bigger period of accumulating dividends than CSPX , but don't know if he will surpass ; cons : smaller returns , year 2019 , expens ratio : 0.22 % , small fund 4000 mil euros) 3) IWDA (pros : higher fund than VWRA , price per unit : 77 euro - more accumulating dividends , cons : not so much diversification as VWRA) Also SUAS ( Ishares MSCI USA SRI UCITS) can be cheaper choice to CSPX ( higher returns and smaller price per unit – 12 euro . Please an advice . I will appreciate any answer. Thank you Best regards Ioan
Kyith
Sunday 10th of April 2022
Hi loan, i think you need to decide what kind of portfolio allocation you prefer. Almost all are pretty low cost and deciding between the cost does not move the needle so much. However, you need to be clear if you lean more to S&P 500 only, developed markets only, or developed plus emerging markets.
Ming
Friday 13th of August 2021
Do you need to pass CAR evaluation to purchase VWRA from Interactive Brokers?
Kyith
Friday 13th of August 2021
HI Ming, I do not have to. Were you prompted?