About 3 weeks ago, I did some number crunching on the longer term, historical returns of a diversified portfolio of high yield bonds.
This week, I decide to look at the emerging market bonds.
After looking at the data, I realize that the emerging market bonds are not too different from the high yield bonds.
They are more volatile but the difference is that… for some reason, as a basket, their lowest intermediate term returns tend to be positive, whearas on a 5-year basis, you have some 5-year period where high yield bonds will still be negative.
So let us get down to it.
Index to Look Into – JP Morgan EMBI Global Total Return Index
I was wondering which emerging market bond index to use so I thought what the heck, let me see what do some of the popular emerging market bond funds use:
- JP Morgan EMBI Global Diversified Index
- JP Morgan EMBI Global
- JP Morgan CEMBI Diversified Total Return
- JP Morgan EMBI Global Core
#1 tends to be the most popular. The iShares Emerging Market Bond ETF JPEA and EMB use #4.
I decided to go for the JP Morgan EMBI Global Total Return because I cannot be sure if the rest of the index I gotten factors in the interest coupon.

In any case, if you look at the difference between the JP Morgan Core, Diversified and the one I used since 1998, the difference is not too dissimilar.
If the iShares Emerging Market Bond ETF is benchmarked to the JP Morgan EMBI Core, then your performance might be better than what I am going to show you today.
What You are Investing In
Majority of the active funds invests in sovereign or government bonds issued by governments or government affiliated entities from the emerging markets.
The basket of bonds in the index are US dollar denominated but for active funds, some have ventured into non-US denominated bonds.
Thus, there is not much currency risk there. However, if the USD weakens or strengthen against your home currency (e.g. SGD), you might be hurt or benefit from it.
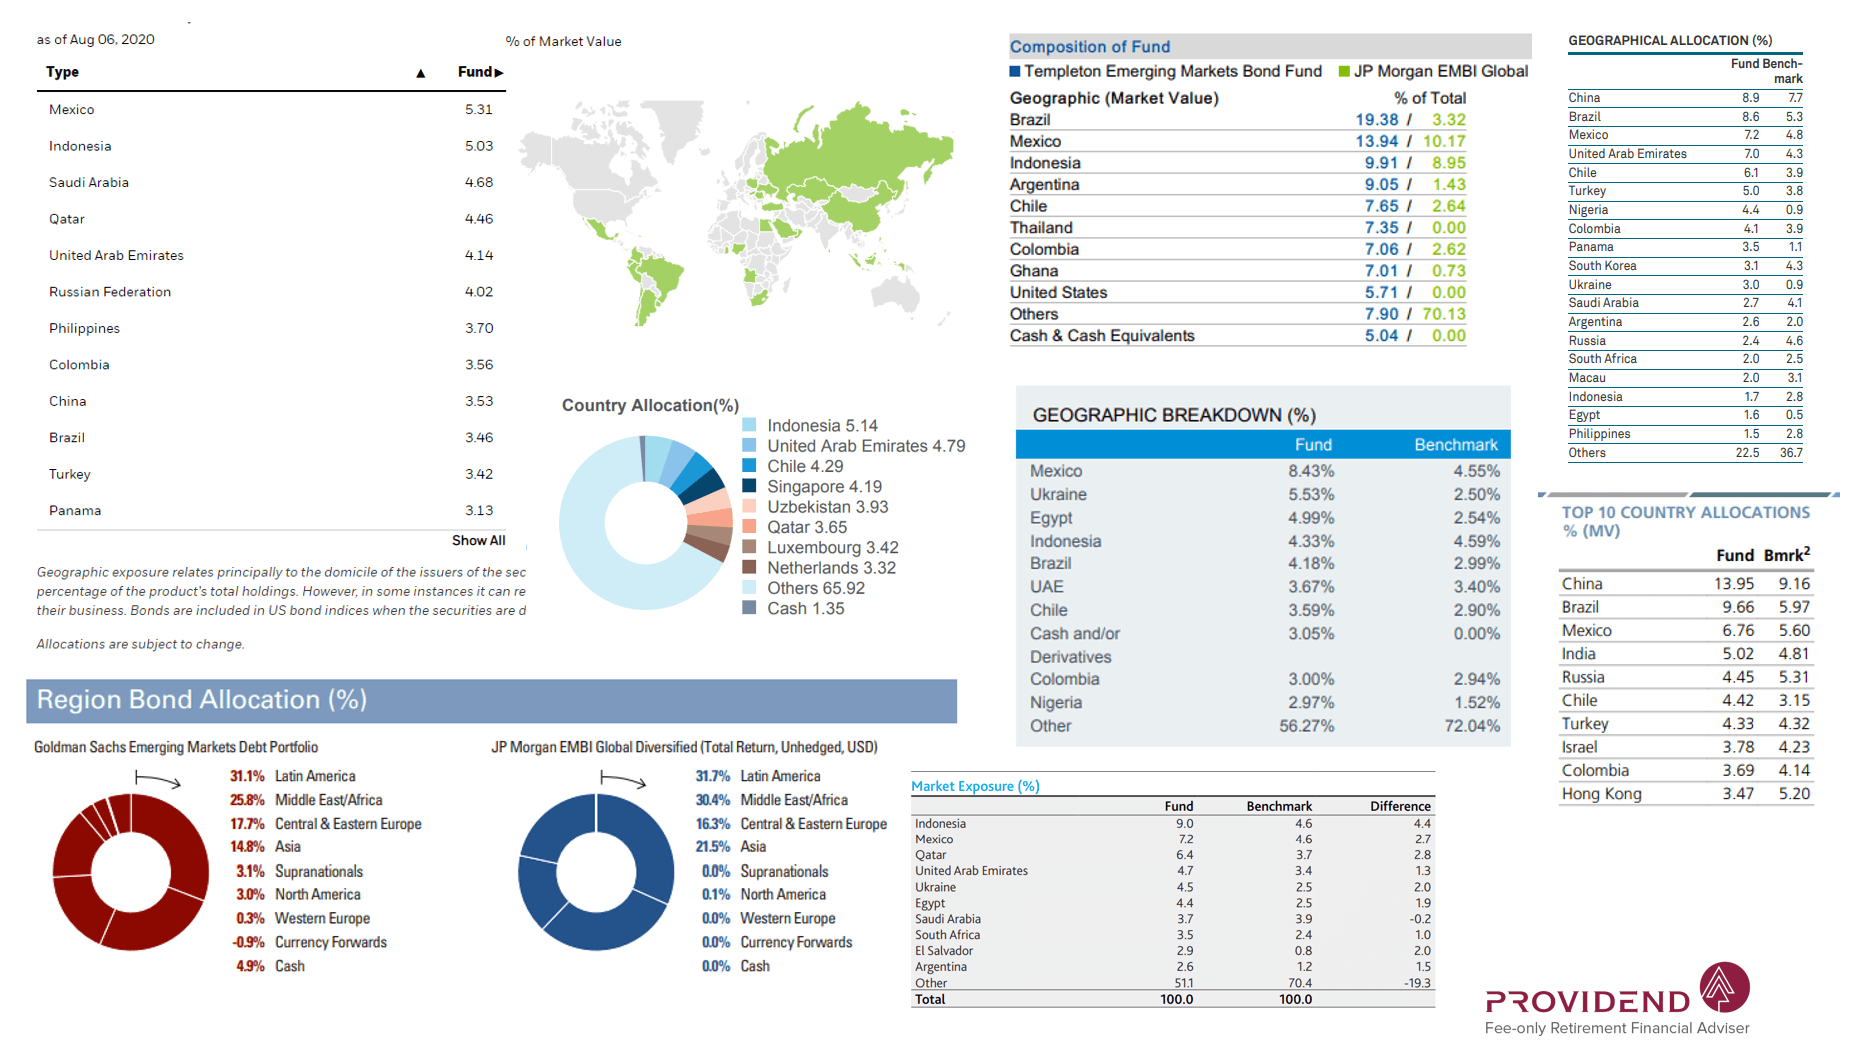
You can enlarge this illustration to get a better picture of the origination of the bonds. These are mainly emerging markets.
The top-left table comes from the emerging market bond ETF, which should be close to the market weight. The rest comes from various active funds.
If you ask me whether you should invest in a specific Argentina, I would wonder whether you are subjecting yourself to excessive default, inflation risk. You should do enough due diligence there.
As a collection of bonds, your risk might be diversified enough. Some governments will default, and the capital values will take a hit. But your capital should not be 100% impaired just because of that event.
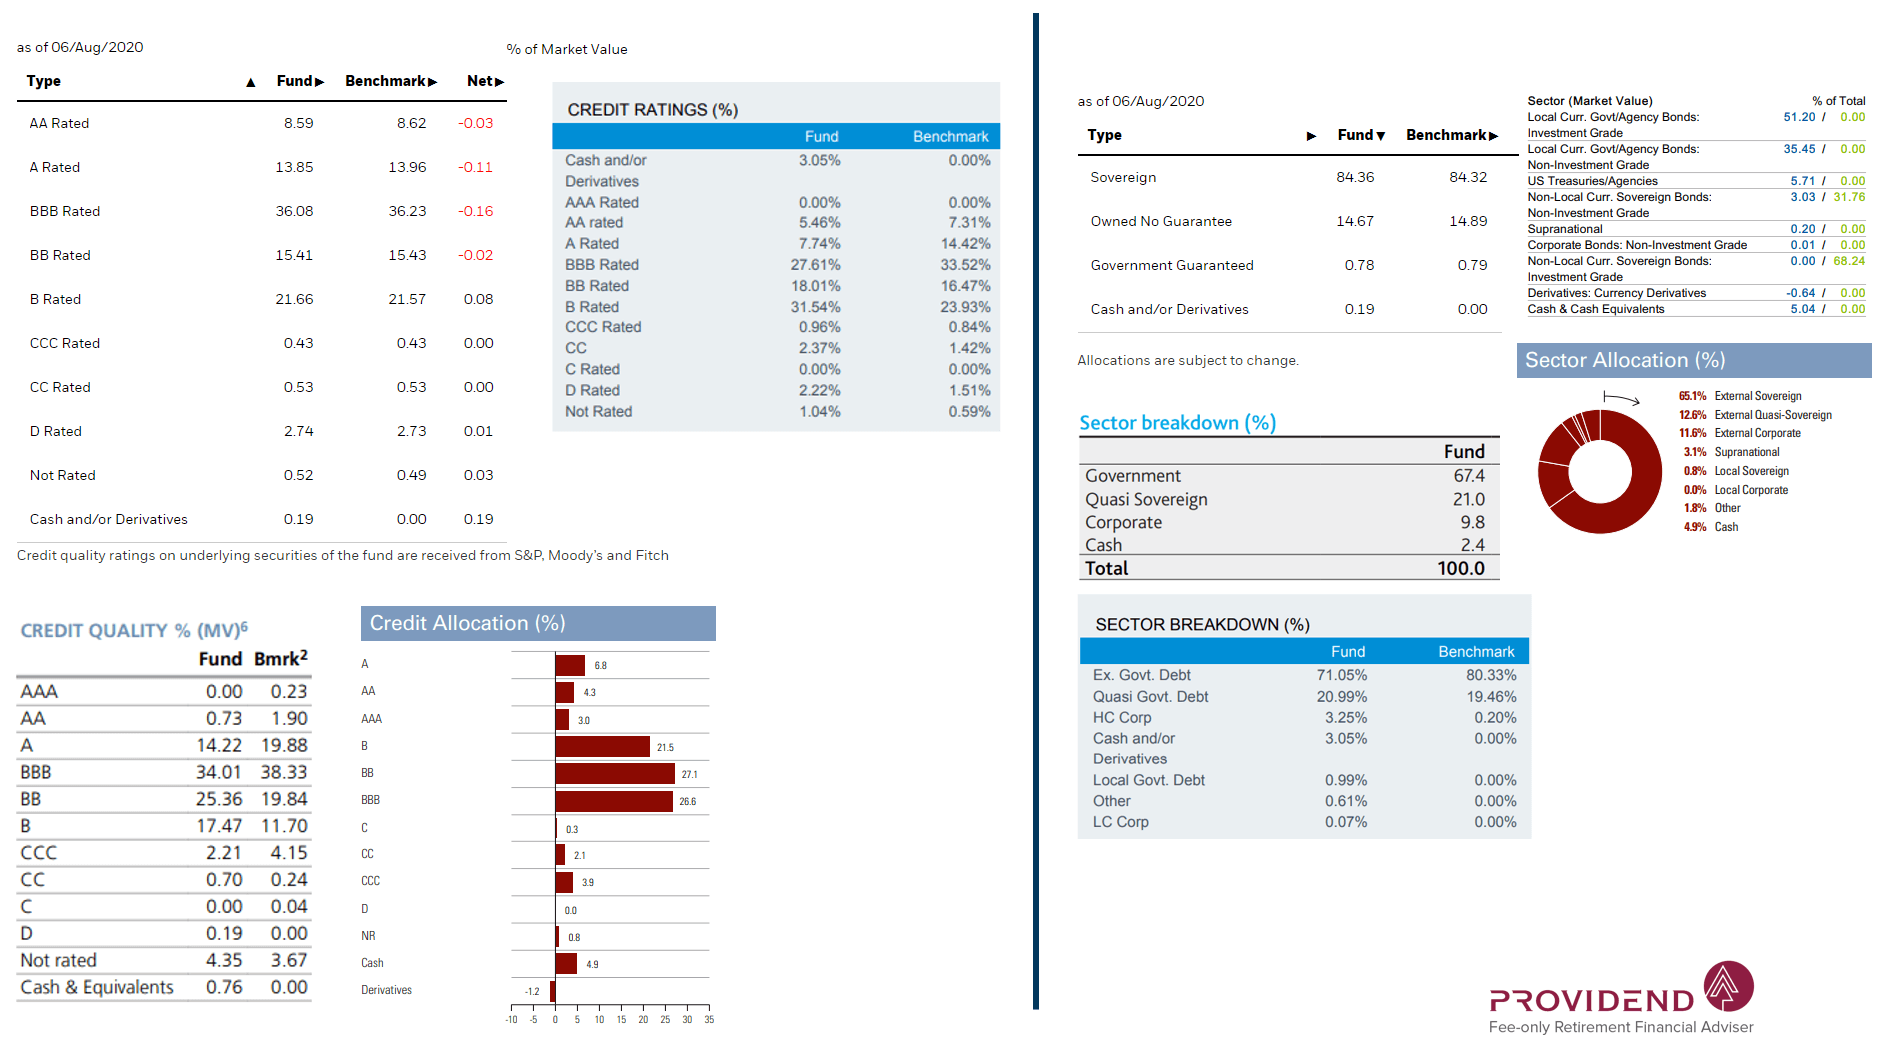
This slide shows the credit quality of the emerging market bonds and the origination of the bonds. Majority tends to be BBB to B rated bonds issued by emerging market governments and quasi-governments.
It is interesting that not a lot of managers invest a sizable portion of their portfolio in non-rated bonds, which tend to be a favorite for Singapore bond investors (that is a story for another day).
The yield to maturity for the funds ranges from 4.1% to 6.3%. The iShares ETF yields close to 4.1% and for the other funds, they probably go down the maturity, geographical risk, credit risk spectrum to gather greater yield.
The weighted average tenure for the portfolios range from 6 to 9 years.
If you would like to contrast this to the high yield bonds:
- Yield to Worst: 6.51%
- Time to Maturity: 6.85 years
So the high yield bonds have a higher yield and roughly shorter duration than emerging market bonds.
5-Year Rolling Returns of the JP Morgan EMBI Global Total Return Index
In the short term, whether bonds, equities, the market is a voting machine.
In the long term, the market is a weighing machine.
If we examine the 5-year rolling returns, we would be able to see the possible returns on an intermediate term basis.
We have data from 1994 to 2020. That is about 26.5 calendar years.
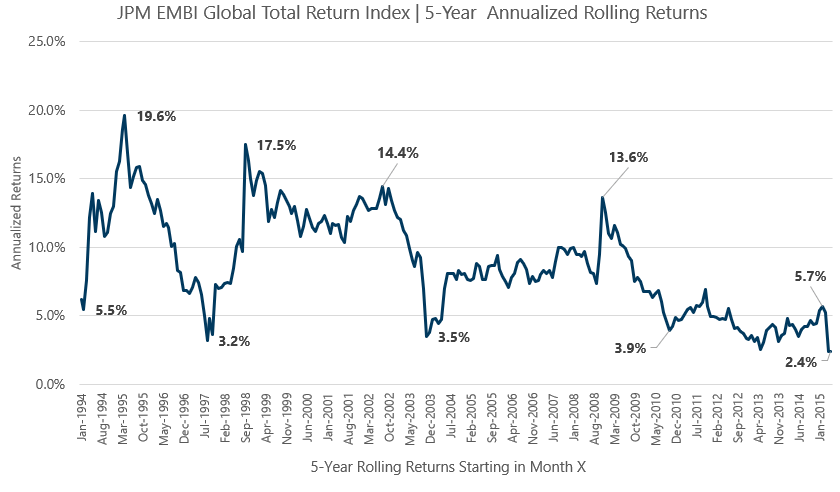
One thing I find quite encouraging is that on an intermediate-term basis, the basket of emerging market bonds is positive over the 257 5-year periods.
In some of the 5-year periods such as the 5-year period starting in Sep 1998, the annualized return is 17.5% a year. That means over the 5-year period, the cumulative return is 124%.
But there are also periods such as the 5-year period starting in Nov 2003, where the annualized return is 3.5% a year and the cumulative return is 18.7%.
Your returns will depend on the market conditions.
What this tells us is that your returns matters more if you have $5 million. This $5 million is the majority of your net wealth. And you are thinking whether this is a good time to invest.
The opportunity cost of you putting in $5 million and this end up to be at the peak is much higher than if you are an accumulator.
If you are an accumulator who has a 15-25 year horizon, some of your money will earn 19% a year over the 5 years and some of your money will earn 3.5% a year over 5 years.
Your returns are smoothed out.
The sequence of returns do matter but that is a story for another day.
10-Year Rolling Returns of the JP Morgan EMBI Global Total Return Index
We do not have a lot of 10-year periods. There is only 197 of them as we rolling month-by-month.
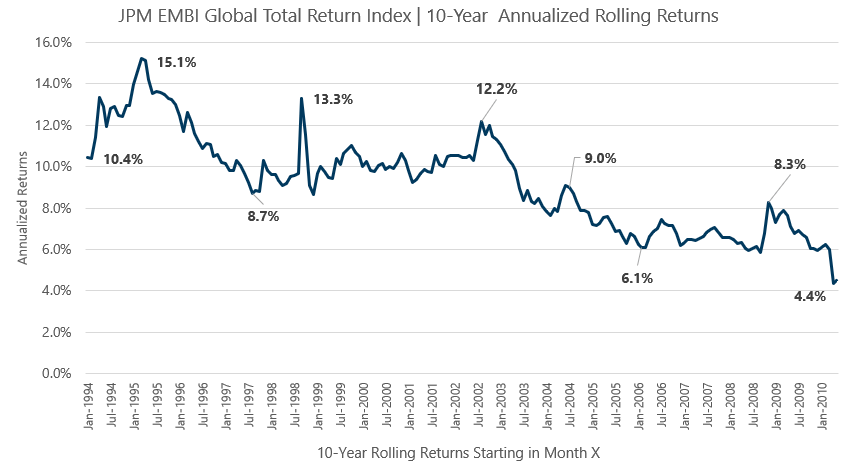
Over a 10-year period, the annualized returns is more smoothed out. Instead of the lowest 5-year return being 2.4% a year, the lowest 10-year return is 4.4% a year.
Unfortunately, we also see that the 10-year return starts drifting downwards. The returns used to be very high at 10% a year but it gradually proceed downwards such that its closer to 5% a year.
Comparison against Equities, Aggregate Bond and High Yield
In my last article, I compared the High yield bond index against the MSCI World and a balanced portfolio.
This time I will compare the 5-year annualized rolling returns against the MSCI World, Bloomberg Barclays Aggregate Bond Fund, Bloomberg Barclays High Yield Fund and a 60% MSCI World/40% Aggregate Bond fund.
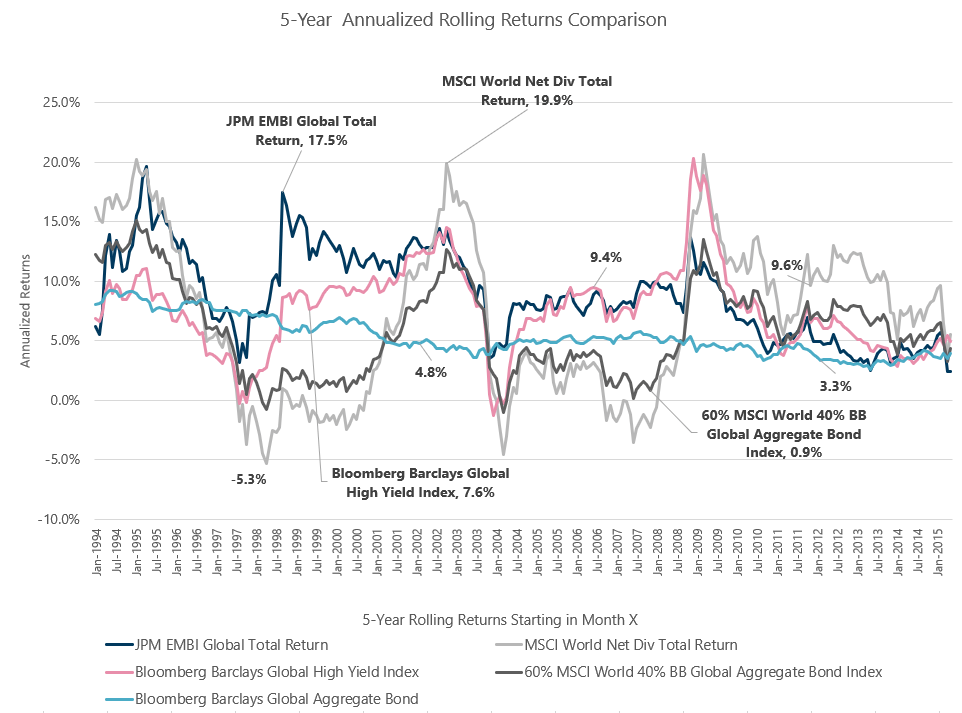
When we overlay so many lines, it looks like a real mess.
The blue line, representing the BB Global Aggregate Bond fund is so consistent, and it slowly weaken from 8.5% a year to 3.3% a year.
At equity market peaks and thoroughs, the rest of the 4 are pretty closely correlated. All crash in 1997-1998, 2008 and did well in 1994, 2003, 2009.
We might wonder whether diversification helps.
I think diversification has its use
- The magnitude of the drawdowns are different. A mixture of these asset classes may make your whole experience much more livable.
- In normal times, we can see that high yield and emerging market bonds are less correlated to the BBGA, MSCI World and a balanced fund. Diversification may result in a very different return profile
Comparing the High Yield, Emerging Market and Aggregate Bonds
Let us get away from that mess and look at just the bonds.
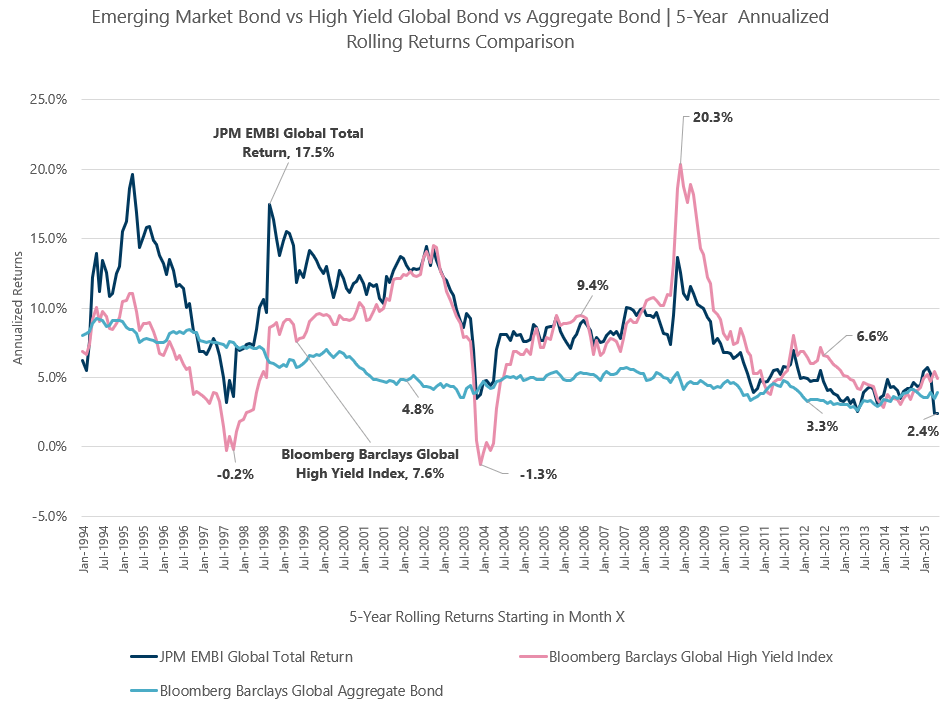
One thing I noticed is that in recent times, whether its high yield, emerging markets or aggregate bonds, they all approach very similar returns profile.
I wonder if that is the new normal.
There don’t seem to be a risk component to returns anymore.
I always had the impression that the high yield and emerging market bonds have very similar profile and in a way you can see that they generally move quite closely in lock-step.
However, high yield bonds do looked riskier than emerging market. The 5-year rolling returns tend to be higher and lower than emerging market bonds. Emerging market bonds did outperform the high yield in the 1994 to 2003 period.
The actual timeline is between 1999 to 2008, which is a period where emerging markets did very well.
If emerging market does return again, we might see this outperformance again.
Creating a Portfolio of Equities, Aggregate Bond, Emerging Market, and High Yield Bonds
I was thinking of an interesting thought experiment of creating a portfolio that is equal weighted between equities, bonds, emerging market bonds and high yield bond.
So I decide to combine the returns and see how the performance like. Now, this is the worst possible way to compute returns. Essentially, it is like I have 4 different funds that I have never rebalanced for 5 years and then I compare the returns.
In any case, I am in a pretty lazy mood so this is the best I came up with.
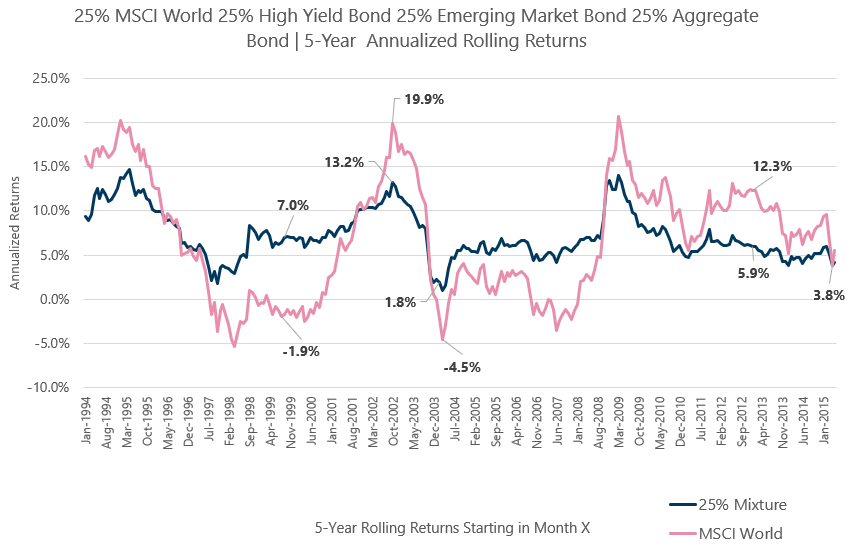
You would observe that the combined portfolio, represented as “25% Mixture” is engulfed within the MSCI World rolling returns.
Since both the high yield and emerging market bonds have a volatility profile similar to a balanced portfolio and the aggregate bond has lower volatility, the resultant portfolio has a volatility.
But lower volatility also means at times, the MSCI World have greater returns. The equity markets have greater returns in recent years (observe the 12.3% a year return vs 5.9% a year return for the period starting in 2012).
But if your heart cannot take it, a combination of the 4 might be more livable. Just be sure that you do not need a high return to reach your goal. If you need to, then you might need a higher equity allocation.
Volatility
Let us compare the emerging market bond index’s performance volatility versus the equity and high yield bonds:
| Standard Deviation of | BB High Yield Index | Emerging Market Bonds | MSCI World |
| 1990 to 2020 (1994 for EM bond) | 9.86% | 12.15% | 14.95% |
| 1990 to 1999 | 9.62% | 19.44% | 13.93% |
| 2000 to 2009 | 11.50% | 10.10% | 16.50% |
| 2009 to 2020 | 8.19% | 7.72% | 14.20% |
From the looks of things, emerging market bonds tend to be between high yield bonds and equities.
However if we examine closely, this data might be tainted by the period where emerging market was exceptionally volatile. If we take out that period, emerging market bonds tend to be less volatile then high yield bonds.
That seem to coincide with the Asian financial crisis, Long term capital management debacle and Dot Com bubble.
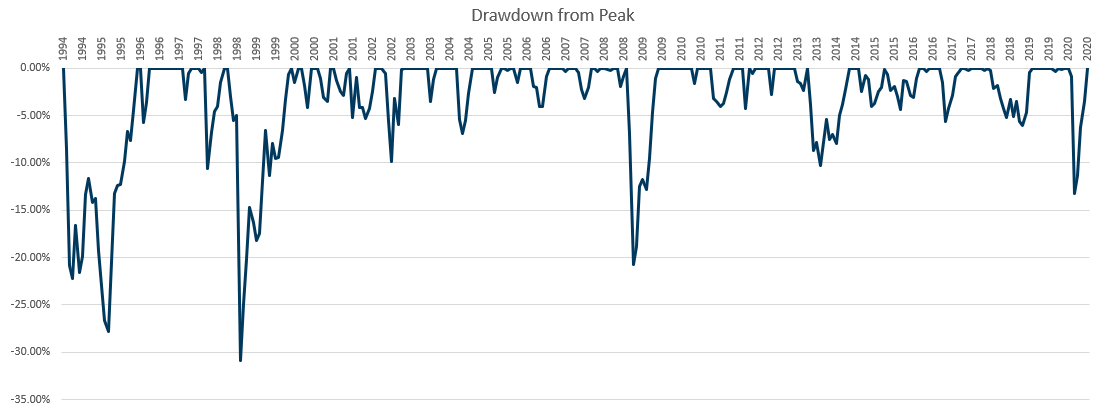
The chart above shows the magnitude of price fall possible for the index. This might explain partially the higher volatility in the 1990s.
Emerging market bonds have a milder drawdown compared to high yield bonds most of the time. However, this does not mean you are able to avoid periods where the drawdown can get pretty wild.
The greatest draw down is -30%.
Compared to equities, this may be much more mangaeble psychologically (I think).
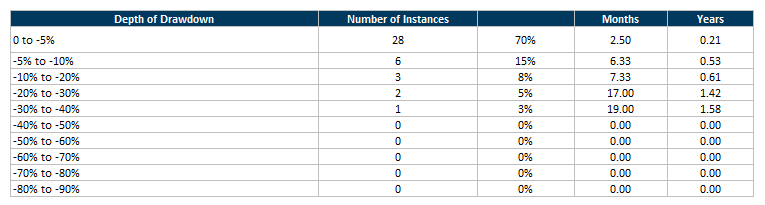

If we tabulate these drawdowns, you can recover from most within 1.6 years.
This is a pretty fast recovery.
The iShares J.P. Morgan $ EM Bond UCITS ETF – JPEA (USD Accumulating) or IEMB (USD Distributing)
There are a few active unit trusts that allows you to have exposure to emerging market bonds.
But there is also an iShares UCITS ETF that allows you to have exposure to emerging market bonds. There are a few share classes
- USD Accumulating (reinvest dividend)
- USD Distributing (pays you dividend)
- CHF, EUR, MX Hedged Accumulating
- GBP Hedge Distributing
The Fund seeks to track the performance of an index composed of US Dollar-denominated bonds from Emerging Market countries. The fund seeks to mirror the JP Morgan EMBI Global Core Index.
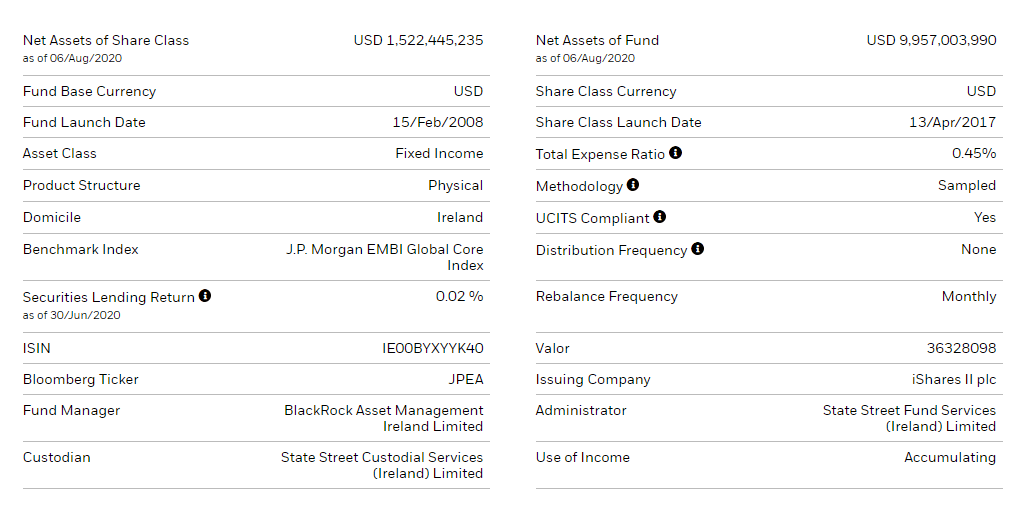

Like most funds, the accumulating share class tends to be newer but you can reference the performance of the distributing share class which has been around since 2008.
I have this suspicion that there are no withholding taxes on the dividend payments.
Summary
In a world where it is getting tougher to find good yielding bonds, we may be forced to go up the risk spectrum to search for yield.
There is no magic pill to this problem. We have to take on more volatility to get higher yield. The problem with taking on more volatility is that it may expose us to more investing mistakes because living with volatility is uncomfortable.
The magic pill here may be to purchase higher risk bonds as a basket. This reduces the risk when a group of bond default, it does not totally impair your capital.
That diversification may eliminate credit risks, default risks but it does not eliminate other risks such as falling interest rates and volatility.
Notice again that we assess the portfolio based on total return instead of just looking at the prevailing yield. Rid the Habit of only focus on yield but focus on total return.
If you take a more passive approach to invest and think some of these more data-driven articles would benefit your wealth-building, you can check out this VWRA vs IWDA article, the beauty of high yield bonds, and this DFA Global Core rolling returns article on Providend written by yours truly.
I invested in a diversified portfolio of exchange-traded funds (ETF) and stocks listed in the US, Hong Kong and London.
My preferred broker to trade and custodize my investments is Interactive Brokers. Interactive Brokers allow you to trade in the US, UK, Europe, Singapore, Hong Kong and many other markets. Options as well. There are no minimum monthly charges, very low forex fees for currency exchange, very low commissions for various markets.
To find out more visit Interactive Brokers today.
Join the Investment Moats Telegram channel here. I will share the materials, research, investment data, deals that I come across that enable me to run Investment Moats.


Do Like Me on Facebook. I share some tidbits that are not on the blog post there often. You can also choose to subscribe to my content via the email below.
I break down my resources according to these topics:
- Building Your Wealth Foundation – If you know and apply these simple financial concepts, your long term wealth should be pretty well managed. Find out what they are
- Active Investing – For active stock investors. My deeper thoughts from my stock investing experience
- Learning about REITs – My Free “Course” on REIT Investing for Beginners and Seasoned Investors
- Dividend Stock Tracker – Track all the common 4-10% yielding dividend stocks in SG
- Free Stock Portfolio Tracking Google Sheets that many love
- Retirement Planning, Financial Independence and Spending down money – My deep dive into how much you need to achieve these, and the different ways you can be financially free
- Providend – Where I used to work doing research. Fee-Only Advisory. No Commissions. Financial Independence Advisers and Retirement Specialists. No charge for the first meeting to understand how it works
- Havend – Where I currently work. We wish to deliver commission-based insurance advice in a better way.
Kyith is the Owner and Sole Writer behind Investment Moats. Readers tune in to Investment Moats to learn and build stronger, firmer wealth foundations, how to have a Passive investment strategy, know more about investing in REITs and the nuts and bolts of Active Investing.
Readers also follow Kyith to learn how to plan well for Financial Security and Financial Independence.
Kyith worked as an IT operations engineer from 2004 to 2019. Currently, he works as a Senior Solutions Specialist in Insurance Start-up Havend. All opinions on Investment Moats are his own and does not represent the views of Providend.
You can view Kyith's current portfolio here, which uses his Free Google Stock Portfolio Tracker.
His investment broker of choice is Interactive Brokers, which allows him to invest in securities from different exchanges all over the world, at very low commission rates, without custodian fees, near spot currency rates.
You can read more about Kyith here.
- My Dividend Experience Investing in UCITS iShares iBond Maturing in 2028. - April 23, 2024
- We Invest into Popular Funds When They Are Popular, Exactly When They Started Turning to Shxt. - April 22, 2024
- Meal Prep 2.0 – Cooking Your “Go-to” Meal that You Look Forward to Eating Everyday. - April 21, 2024