If there is one constant that I have noticed throughout the time that I have been investing, it is the popularity of investing in companies that pay higher dividends.
What captivates many is the feeling of receiving dividends. Unlike buying a stock for capital appreciation, dividends are tangible returns that accumulate over time. In other methods, you must sell your stock at a certain point to realize the profits.
Many learn that getting the selling and buying timing right is more complicated.
An online acquaintance who has always been a dividend investor asked whether there is a way to research and show the performance of dividend investing versus buying and holding stocks traditionally.
I think it is a bit difficult, and frankly, there is a lack of motivation to do deeper research.
Yet sometimes, I feel it is also not right to make comments that dividend investing is the best thing since sliced bread without being quantitative about it.
I put in some effort to see if I could gather some data that could give us greater insight into the performance of dividend investing and came across a set of style factor indexes created by MSCI that might answer some of our questions.
What if we focus on dividend growth instead of absolute dividends?
MSCI crafted the MSCI World Dividend Masters Index to represent the performance of companies that have increased dividends for a specific number of consecutive years.
MSCI categorises the Dividend Masters as part of the family of MSCI Factor Indexes, representing elements of particular investment styles or strategies.
Many dividend investors invest in a hodge-podge manner. They are less systematic about it, so it is challenging to answer whether dividend investing will work for them.
How do you curate the dividend stocks you buy? When will you sell your dividend stocks? Eventually, I realized that answering the questions, “what do you think about dividend investing?” or “does dividend investing work?” are so energy-sapping that I would just avoid them as much as possible.
In general, there are two styles:
- Investing in companies that have high dividends relative to their peers or in a geographical location (e.g. Singapore)
- Invest in companies that manage to grow their dividend per share over time for a relatively long time.
Most investors will try their best to mesh these styles together if they do it alone.
The best way to use dividends is to use them as a style factor metric to rank the stocks and invest in a basket of stocks that rank the highest. Then periodically re-rank the basket of stocks in the universe and rebalance your portfolio by selling those that fall out of the ranking and buying those that show up.
But to do that, you need to know whether high-dividend stocks or stocks that increase their dividends do well than a general basket of stocks over time.
MSCI did the work; in later sections, we will look at the past results.
#1 uses dividends as a valuation metric to get cheap companies, but some companies can be shitty companies that have matured or will die soon.
#2 will give you companies that have higher quality but tend to be more expensive because they are more quality.
Dividend Masters leans closer to #2:
- Rank and invest in companies that have consistently increased dividends yearly for at least ten years.
- Invest in at least 25 companies.
- The companies invested are equal-weighted.
- The sector weights are capped at 30%, and country weights are capped at 50% to mitigate potential concentration risks.
MSCI has created Dividend Masters Indexes that cover:
- Developed + Emerging Market World
- Developed World
- World ex USA
- EAFE
- Emerging market
- Europe
- Japan
- All Country Asia ex Japan
MSCI is able to backtest the Dividend Masters performance as far back as November 2002, which means we are able to see if we focus on companies that manage to grow their dividends over time did well in the past twenty years.
I don’t want to kill myself, so we will only review MSCI World, Emerging Market, Europe, and Japan.
Historical Performance of the Dividend Masters
The table below shows the performance of the MSCI World Dividend Masters against the MSCI World, as well as some fundamental characteristics of the portfolio (as of the end of September):
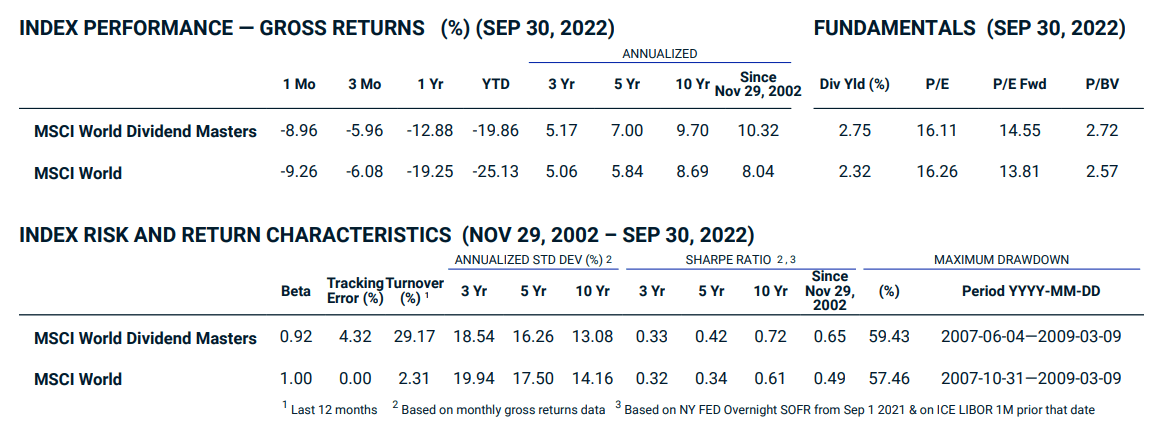
The MSCI World Dividend Masters did better than the MSCI World over all different timeframes. The portfolio turnover is higher (29.17%) compared to the MSCI World. By curating dividend growers, the portfolio tends to be slightly more expensive than the basket of companies in the MSCI World.
The dividend yield is not much higher than the dividend yield of the MSCI World.
MSCI USA Dividend Masters

If we go back to 2002, investing in dividend growers improved performance (10.4% vs 9.2%), but the difference was minimal in recent years.
Across most timeframes, we can see that by curating dividend growers, the results are better in the USA.
The companies have higher dividend yields (2.6% vs 1.8%), and they are cheaper (PE of 15 times versus 18 times).
MSCI Europe Dividend Masters
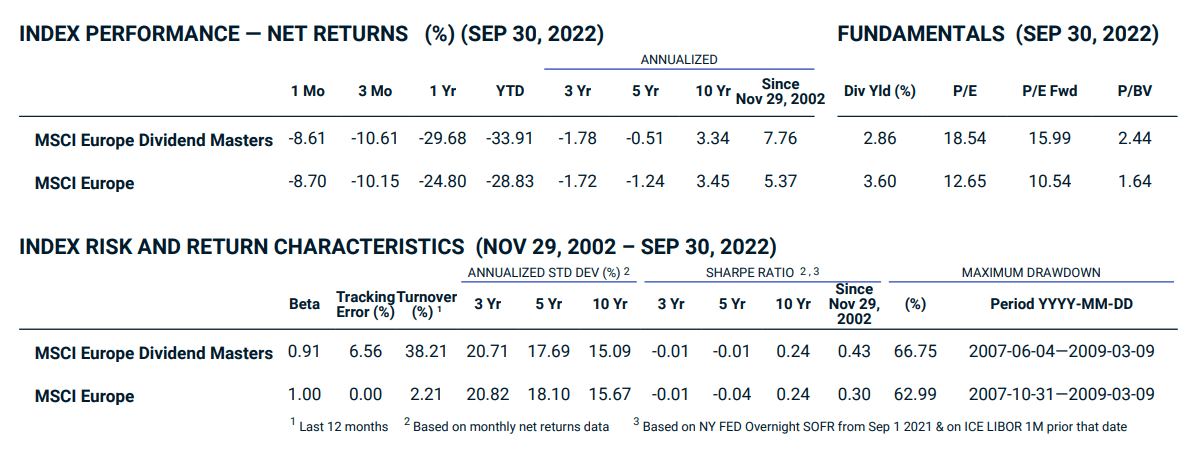
If we go back to 2002, investing in dividend growers improved performance (7.76% vs 5.37%), but the difference was minimal in recent years.
You also get companies that are relatively much more pricey than the basket of companies in MSCI Europe.
MSCI Emerging Market Dividend Masters
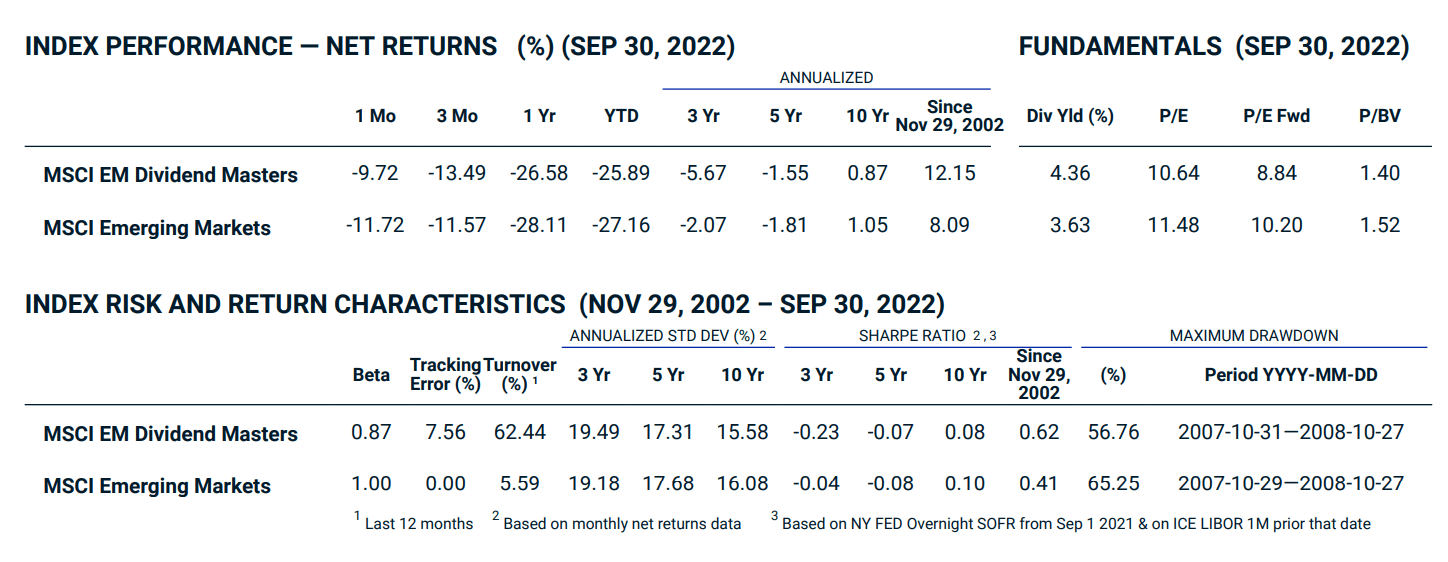
The emerging market went through the last ten years as a lost decade with low returns, and focusing on dividend growers did not save an emerging market investor from the same fate.
But if we factor in the first ten years, a focus on dividend growers gave you really good returns than if you didn’t (12.15% yearly returns versus 8.09% yearly returns).
You will get companies that are cheaper than the standard emerging market stocks.
MSCI Japan Dividend Masters
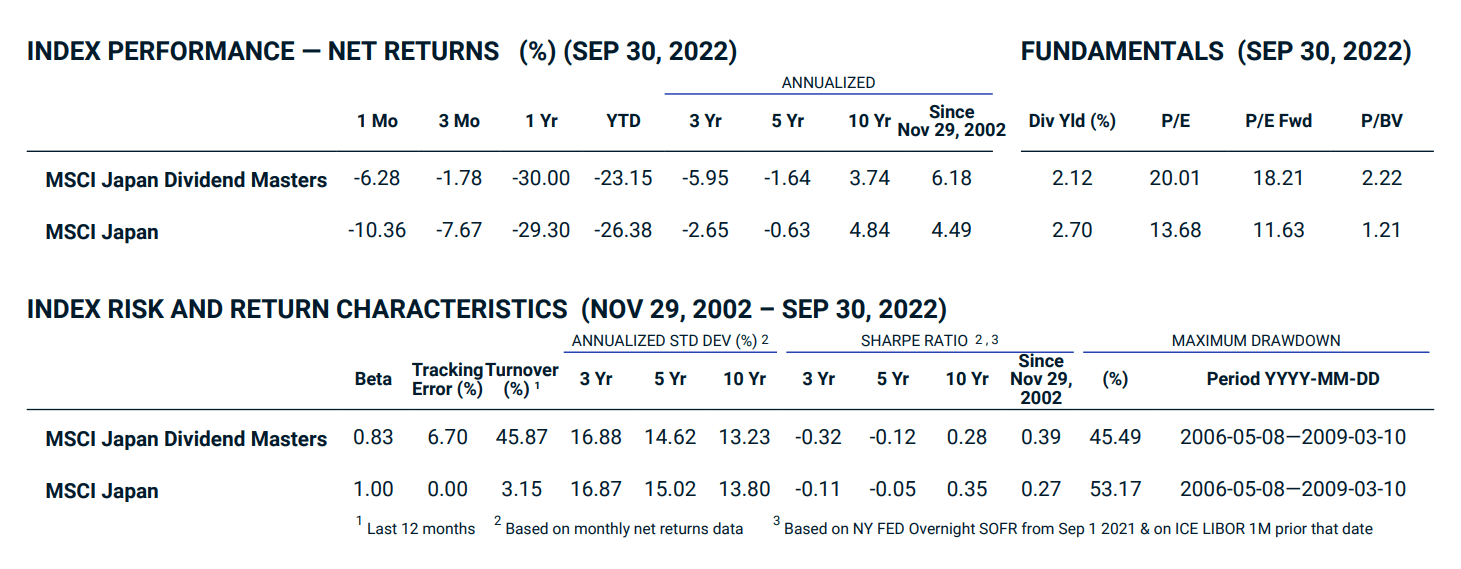
Compared to the emerging markets, Japan did not experience a lost decade. However, dividend growers perform worse than the market-cap-weighted Japan index. Over 20 years, dividend growers did better (6.18% yearly versus 4.49% yearly).
Focusing on Japanese dividend growers would give you more expensive companies.
The Nature of Dividend Growers in Different Regions
The performance data show us that there are limits to focusing on companies that can increase dividends over time. Like many other style factors, they have not done well in the past ten years.
Would the next ten years be different, or a return to the old days? We will see.
MSCI’s factsheet is able to show us the nature of the companies if you focus on companies that can consistently grow their dividends over time.
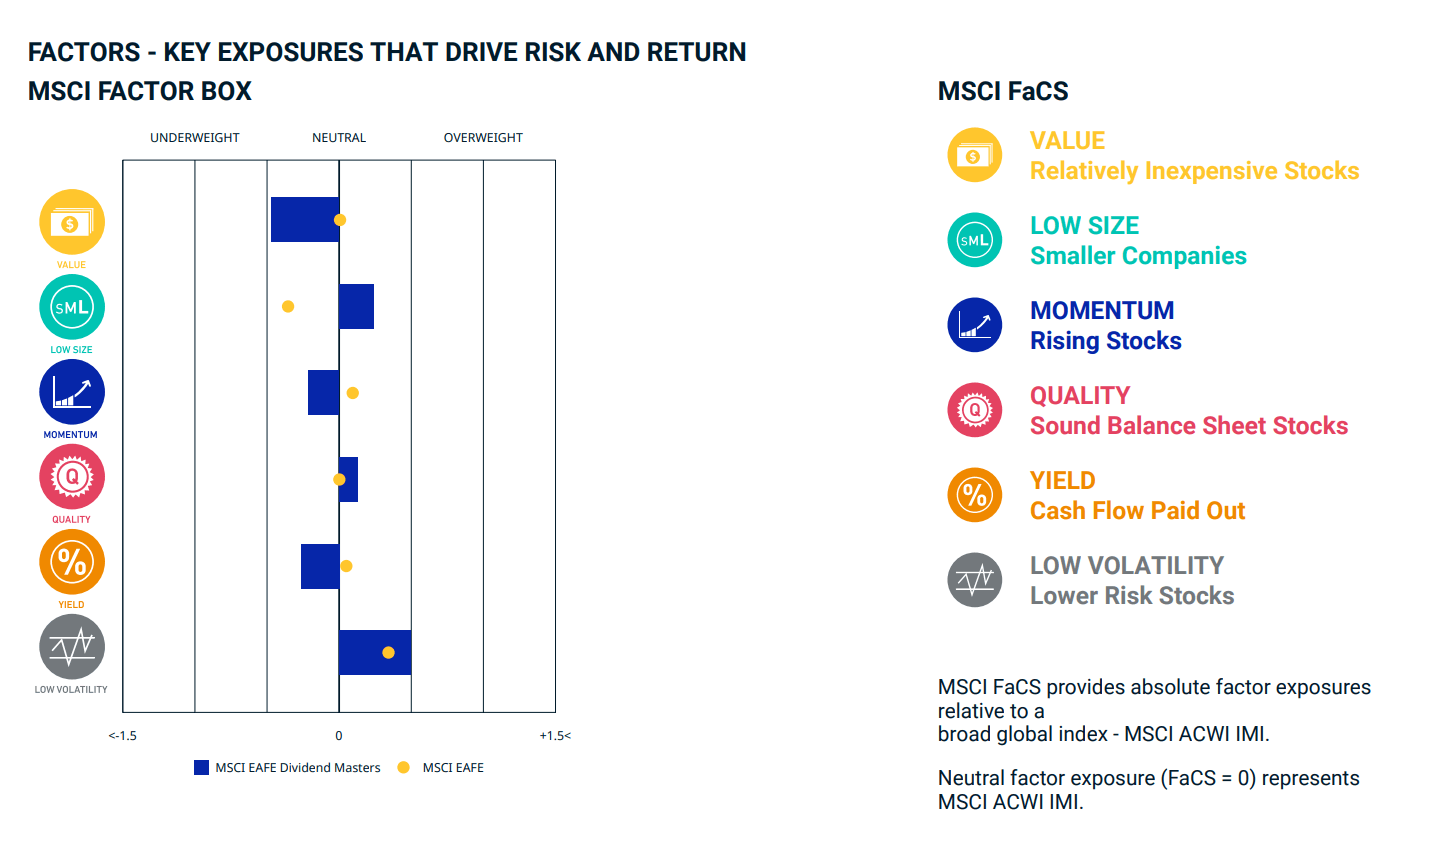
Most likely, you will underweight cheaper companies. By choosing equal weight, you will select smaller companies. The companies also tend to have lower volatility and slightly higher quality.
The surprising thing is that you will underweight companies with higher yield.
Of course, if you review the factsheets of the Dividend Masters in different regions, you will realize that the factor exposures are different.
Some commonality is that the companies tend to be slightly higher quality and lower in volatility.
The Cheat Code
Not many companies can consistently grow their dividends over time, and so if we are screening for dividend growers, we don’t expect the list to change a lot.
We also do not have the means to invest in an exchange-traded fund (ETF) that tracks any of the MSCI Dividend Masters Indexes.
However, these indexes are rebalanced every quarterly and semi-annually, and the factsheets are published publically. All you have to do is Google “MSCI Dividend Masters {region}” and you should be able to find the factsheets.
So what does this mean?
If you are a dividend investor who likes companies that can grow their dividends over time, the factsheets may give you ideas on future dividend investment ideas.
I do have a few other data-driven Index ETF articles. These are suitable if you are interested in constructing a low-cost, well-diversified, passive portfolio.
You can check them out here:
- IWDA vs VWRA – Are Significant Performance Differences Between the Two Low-Cost ETFs?
- The Beauty of High Yield Bond Funds – What the Data Tells Us
- Searching for Higher Yield in Emerging Market Bonds
- The performance of investing in stocks that can Grow their Dividends for 7/10 years
- Should We Add MSCI World Small-Cap ETF (WSML) to Our Passive Portfolio?
- Review of the LionGlobal Infinity Global – A MSCI World Unit Trust Available for CPF OA Investment
- 222 Years of 60/40 Portfolio Shows Us Balanced Portfolio Corrections are Pretty Mild
- Actively managed funds versus Passive Peers Over the Longer Run – Data
- International Stocks vs the USA before 2010 – Data
- S&P 500 Index vs MSCI World Index Performance Differences Over One and Ten Year Periods – Data
Here are some supplements to sharpen your edge on low-cost, passive ETF investing:
Those who wish to set up their portfolio to capture better returns believe that certain factors such as value, size, quality, momentum and low volatility would do well over time and are willing to harvest these factors through ETFs and funds over time, here are some articles to get you started on factor investing passively:
- Introduction to factor investing / Smart Beta investing.
- IFSW – The iShares MSCI World Multi-factor ETF
- IWMO – The iShares MSCI World Momentum ETF
- GGRA – The WisdomTree Global Quality Dividend Growth UCITS ETF
- Investing in companies with strong economic moats through MOAT and GOAT.
- Robeco’s research into 151 years of Low Volatility Factor – Market returns with lower volatility that did well in different market regimes
- JPGL vs IFSW vs Dimensional Global Core vs SWDA – 22 years of 5-year and 10-year Rolling Returns Performance Comparison
- 98 Years of Data Shows the US Small Cap Value Premium over S&P 500
- 42 Years of data shows that Europe Small Cap Value premium over MSCI Europe
If you want to trade these stocks I mentioned, you can open an account with Interactive Brokers. Interactive Brokers is the leading low-cost and efficient broker I use and trust to invest & trade my holdings in Singapore, the United States, London Stock Exchange and Hong Kong Stock Exchange. They allow you to trade stocks, ETFs, options, futures, forex, bonds and funds worldwide from a single integrated account.
You can read more about my thoughts about Interactive Brokers in this Interactive Brokers Deep Dive Series, starting with how to create & fund your Interactive Brokers account easily.
Kyith is the Owner and Sole Writer behind Investment Moats. Readers tune in to Investment Moats to learn and build stronger, firmer wealth foundations, how to have a Passive investment strategy, know more about investing in REITs and the nuts and bolts of Active Investing.
Readers also follow Kyith to learn how to plan well for Financial Security and Financial Independence.
Kyith worked as an IT operations engineer from 2004 to 2019. Currently, he works as a Senior Solutions Specialist in Insurance Start-up Havend. All opinions on Investment Moats are his own and does not represent the views of Providend.
You can view Kyith's current portfolio here, which uses his Free Google Stock Portfolio Tracker.
His investment broker of choice is Interactive Brokers, which allows him to invest in securities from different exchanges all over the world, at very low commission rates, without custodian fees, near spot currency rates.
You can read more about Kyith here.
- Golden Nuggets from JPMorgan Guide to Retirement 2024. - April 16, 2024
- Be Less Reliant on Banks and Build Stronger Capital Markets by Pushing for Better Shareholder Dividend and Buyback Yield - April 14, 2024
- The LionGlobal APAC Financials Dividend Plus ETF Won’t Give Singapore Investors 5% Dividend Yield Always. Further personal thoughts (with some data). - April 13, 2024