At our annual Christmas event, our head of advisory Vincent brings to our attention that there was one year where the Russell 2000 index outperformed the S&P 500 by 50%.
That was when the S&P 500 was down 10% but the Russell 2000 was up 40%. The Russell 2000 index represents the 2000 smallest-cap American companies.
This is a good comparison of the large American companies with smaller American Companies.
The datapoint provides evidence that in some years certain groups of stocks would do extremely better than another group of stocks, despite all the stocks being in the same geographical location.
This outperformance should not be a surprise because this year, certain sectors in the same geographical location did better than other sectors.
Investing in smaller companies, as opposed to larger companies was one of the factors identified by researchers that will give you long term outperformance. (One of the implementers of this factor was Dimensional Fund Advisers with their funds tilted towards smaller, value and profitable companies)
A lot of the research was done by looking at smaller value companies versus larger companies. However, I thought it would be interesting by looking at the smaller companies versus the larger companies, regardless of the valuation.
Comparing the MSCI World (IWDA) Versus the MSCI World Small Cap (WSML) Index
The MSCI World index captures the largest companies in the developed world. The MSCI World Small Cap index captures the smaller companies in the developed world.
To enter the small cap index, companies need to be between US$200 million to US$1.5 billion in market cap and have a certain level of free float.
These companies are small but not tiny.
The index is market capitalization weighted instead of equal-weighted. Unlike the MSCI World, each stock component in the MSCI World Small Cap Index is very small. The top 10 stocks in the MSCI World Small Cap make up just 2.2% of the index.
Here are the current top 10 (Nov 2020), which should change pretty often:
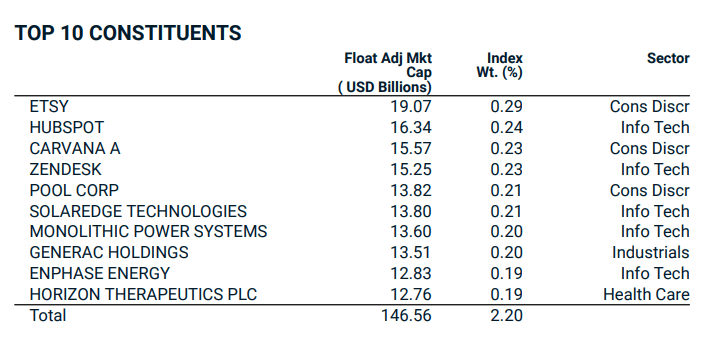
These are not household names but some of you who are in various industries might have heard of ETSY, Carvana, Zendesk and Hubspot. The market cap of each of these companies are between 12 billion to 19 billion.
They are probably larger than many Singapore companies.
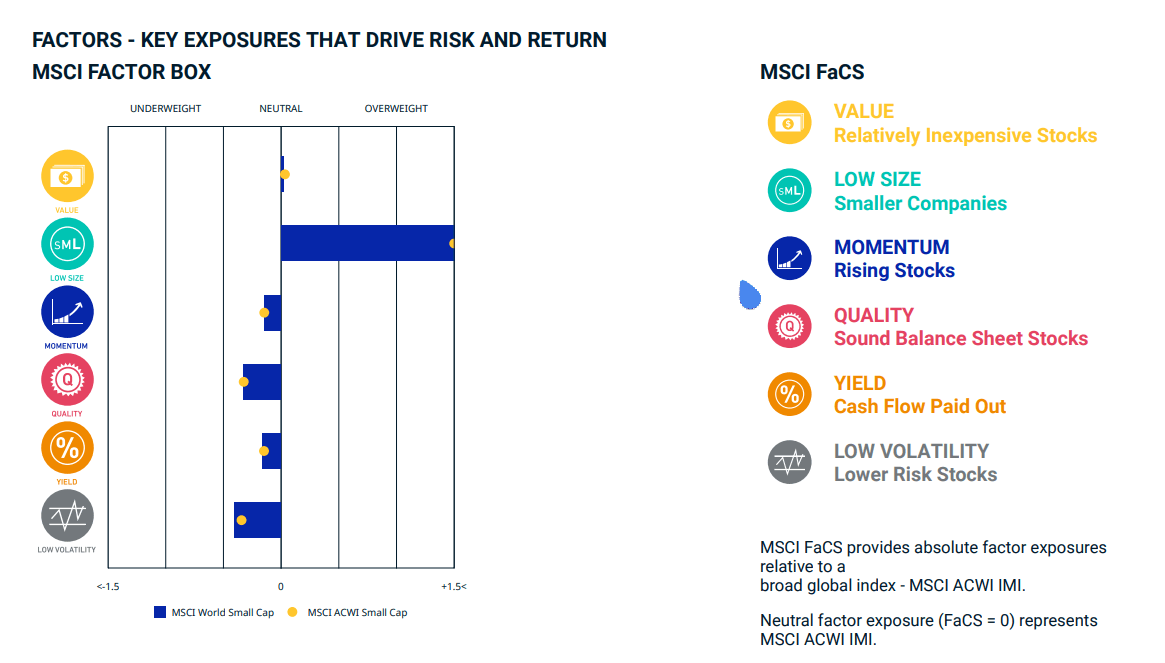
MSCI also provided us with how much other factor exposure the index have to the factors other than small. As you can see, they are slightly underweight to the other factors such as value, quality, momentum and low volatility.
If you are looking for exposure to MSCI World Small Cap, BlackRock has the iShares MSCI World Small Cap UCITS ETF. The ticker symbol is WSML. This fund was incepted not too long ago in Mar 2018.
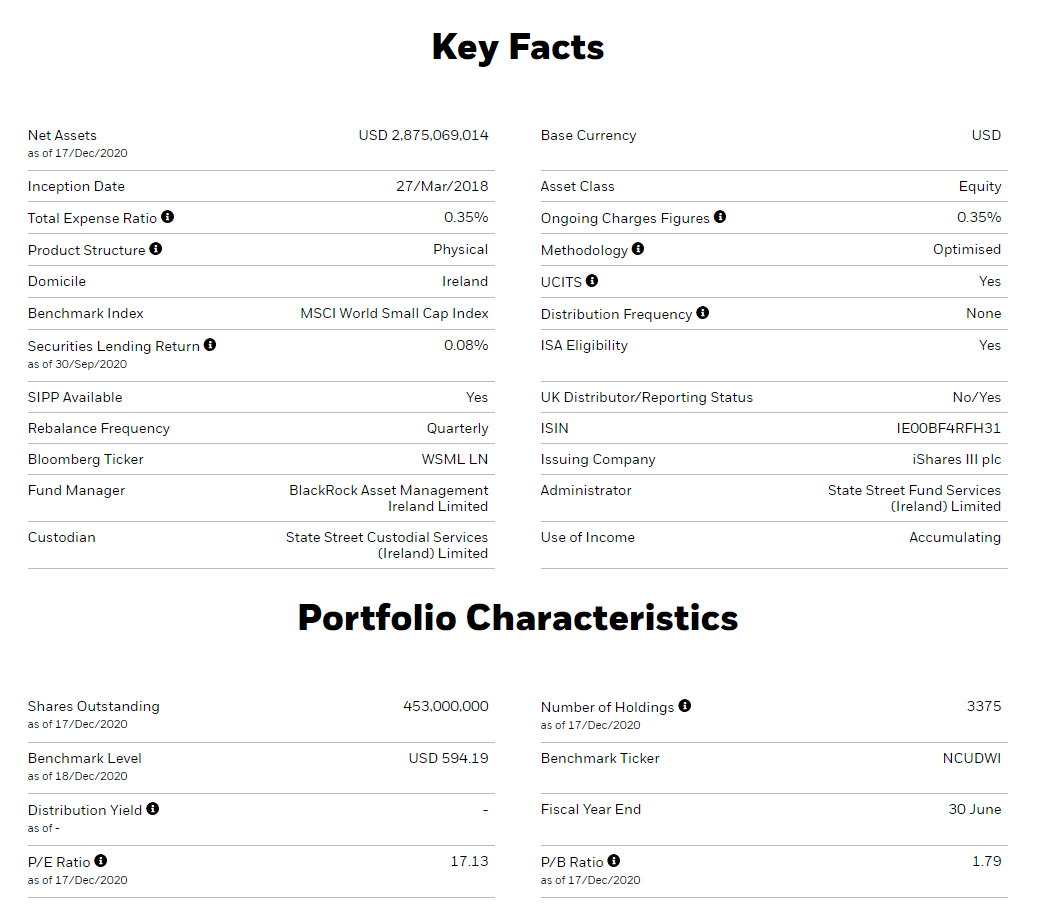
The AUM is US$2.8 billion and total expense ratio is 0.35%.
This ETF is listed on the London Stock Exchange (LSE) but domiciled in Ireland. It is an accumulating fund, which means it does not pay out a dividend.
Thus, this ETF is more tax-efficient, having less of the dividend withholding tax and estate tax issues I have written about in the past.
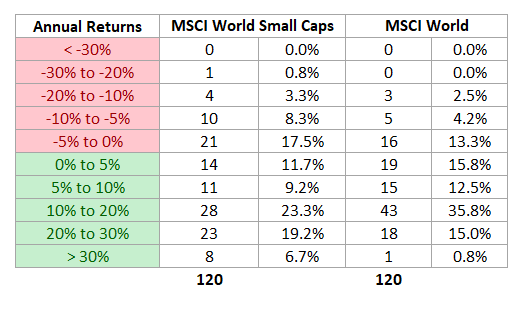
Distribution of Annual MSCI World Small Cap (WSML) Returns
I have the data of the MSCI World Small Cap Index from 1999 to 2020. We area is able to roll these data month by month.
When we roll the data month-by-month, we have 252 unique years within this 21.5 calendar years.
Let us take a look at these 252 unique years:

Based on history, 69% of the time, investing in the Small Cap will net you positive result. This is not too different from the MSCI World (69%).
The biggest difference is:
- Small Caps have more returns between -5% to -10% while the larger cap have more that are -10% to -20%. This actually means your psychological experience with small caps is better!
- Small caps have more returns greater than 20% than larger caps
54% of the time, the small cap returns are going to be greater than 10%. That is like 1 in 2 times! But this is not too different then large cap (52%)
I think there will be people interested in whether the distribution will be any different for the past 10 years.
The past 10 years seems to be tough for anything other than market-cap weighted. So here it is from Jan 2010 to Nov 2020:

There were 120 unique years in the past 10.9 calendar years.
- 70% of the time, small caps have positive annual returns. large cap were positive 80% of the time
- Small caps have more unqiue years where the returns were between -5% to -10% compared to large cap
- Just like between 1999 to 2020, larger cap have more unique years where the return are between 10% to 20% compared to the small caps but…
- Small caps have more instances where the returns are greater than 20% (31 versus 19 unique years)
MSCI World Small Cap (WSML) Annual Returns and Standard Deviations vs MSCI World (IWDA)
I learned that reading CAGR and standard deviation is a bit meaningless. This is because given a long enough period, the compounded returns and standard deviation should converge to a theoractical return and standard deviation.
Basically, if you have such a short history of 20 years as we have… these annual return and standard deviation data is a bit meaningless.
However, lets go through the paces:
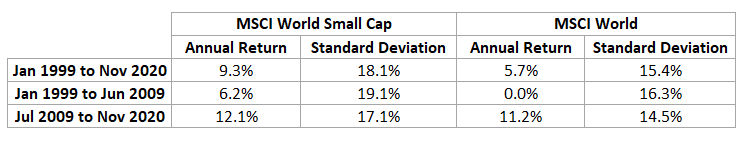

I have computed the return and standard deviation for the period of 1999 to 2020 as well as split the two period up in half. This is to satisfy those who would say the small factor is not so visible anymore.
The first thing you would notice is that for the 21.9 years, MSCI World Small Cap compound much better than MSCI World (9.3% vs 5.7% a year)
The volatility for small cap is higher than the large cap. This is not surprising.
From 1999 to 2009 is probably the most shitty period for an index so dominant with United States companies. MSCI World did 0% a year for the 10 years during this period.
It is pretty interesting that MSCI World Small Cap did 6.2% a year during the same period.
What about the second 10.5 year period?
The return gap narrowed.
MSCI World Small Cap did 12.1% a year versus 11.2% a year. The small-cap premium might have severely narrowed but it does not mean it gives a shitty performance.
I am sure you would be pretty happy with 12.1% a year.
The biggest take-away here for me was the much better performance of the small-cap compared to the large-cap.
Of course the small-cap was more volatile based on the higher standard deviation (A 18.1% standard deviation mean that there is a 68% probability that the return will lie between 9.3% +18.1% or 9.3% – 18.1%)
We will go into the volatility later.
Annualized Rolling Returns of MSCI World Small Cap (WSML) Versus MSCI World (IWDA)
Let us take a look at the annualize returns for unique 3-year, 5-year and 10-year period in this 21.9 calendar years.
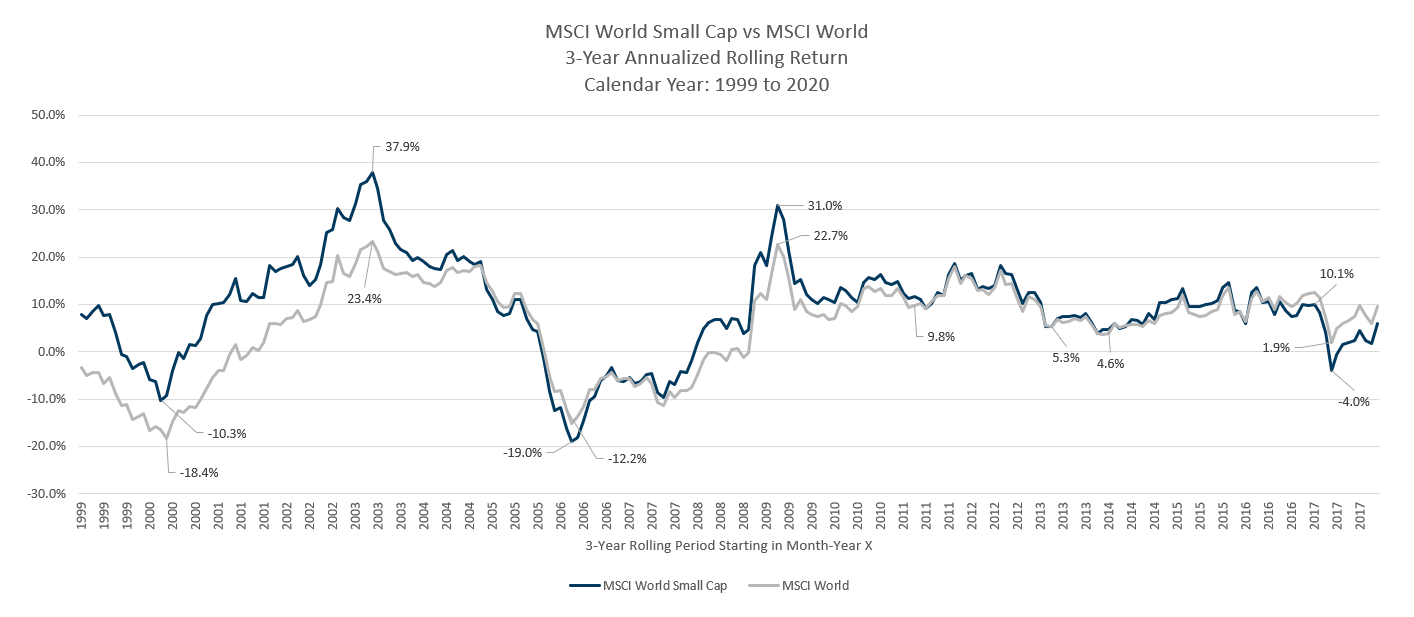
Each point on this chart shows the annualized return of a three year period starting at that month-year.
The period starting in Apr 2000 and Mar 2006 were the three-year period where returns really suffered. Strangely, in Apr 2000 to Mar 2003, the small cap did better than the large cap despite being more volatile.
In the GFC, the small cap did worse (almost -60%).
We can also see the worst period that includes the recent Covid-19. For the three year period MSCI World did 1.9% a year while the MSCI World Small Cap did -4%.
That is a 20% difference.
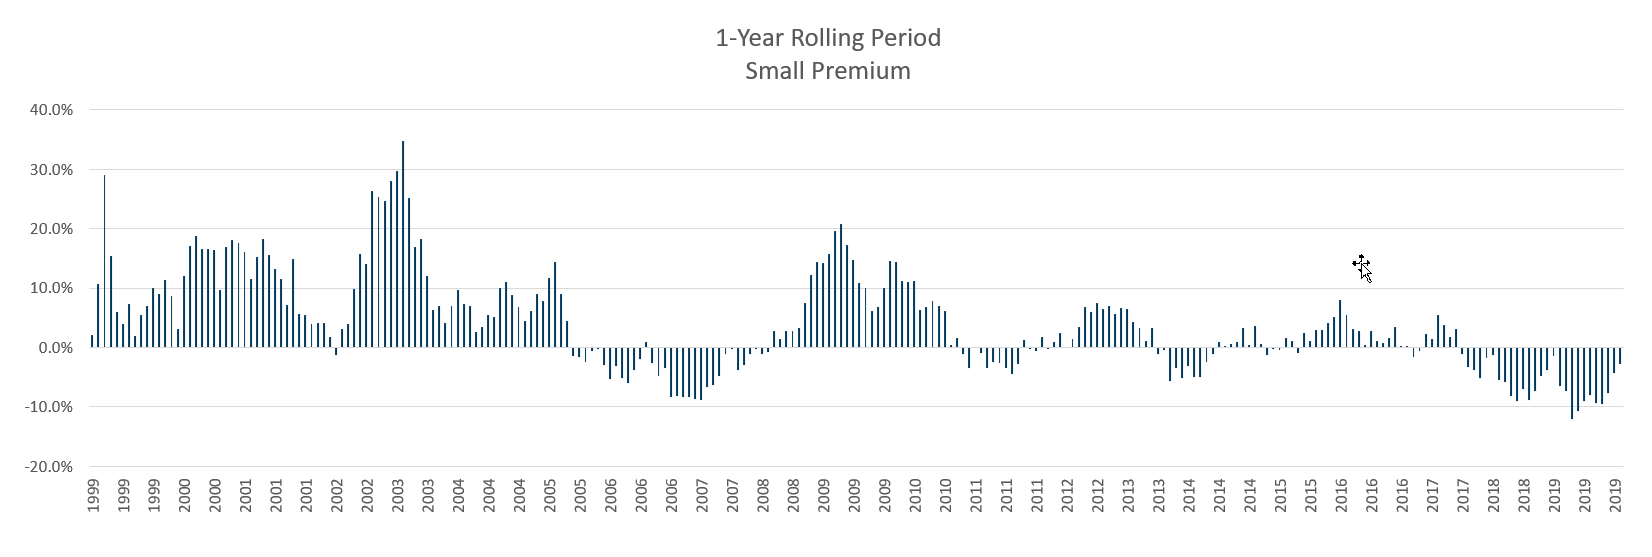
I did up a chart showing MSCI Small Cap – MSCI World.
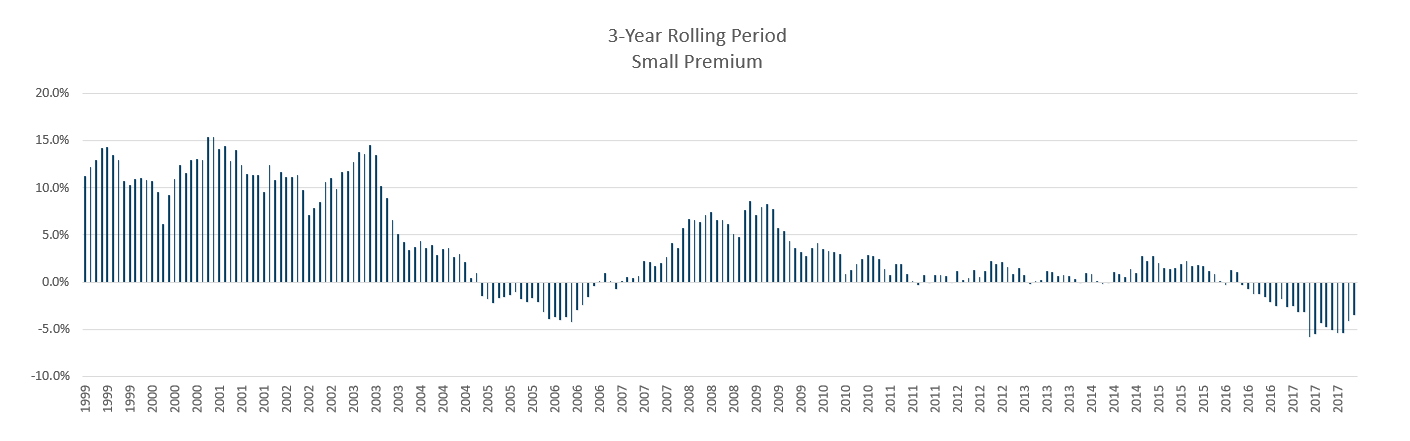
The size premium was more evident in the past. It was evident as late as 2013.
You can also observe that during the period of 2005 to 2008, the size premium did not exist as well.
The appearance of this permium, as with a lot of other premium comes and go. As an aggregate over time, the size premium gives the MSCI World Small Cap the outperformance overy MSCI World.
Here is the 5-Year Rolling Return comparison:
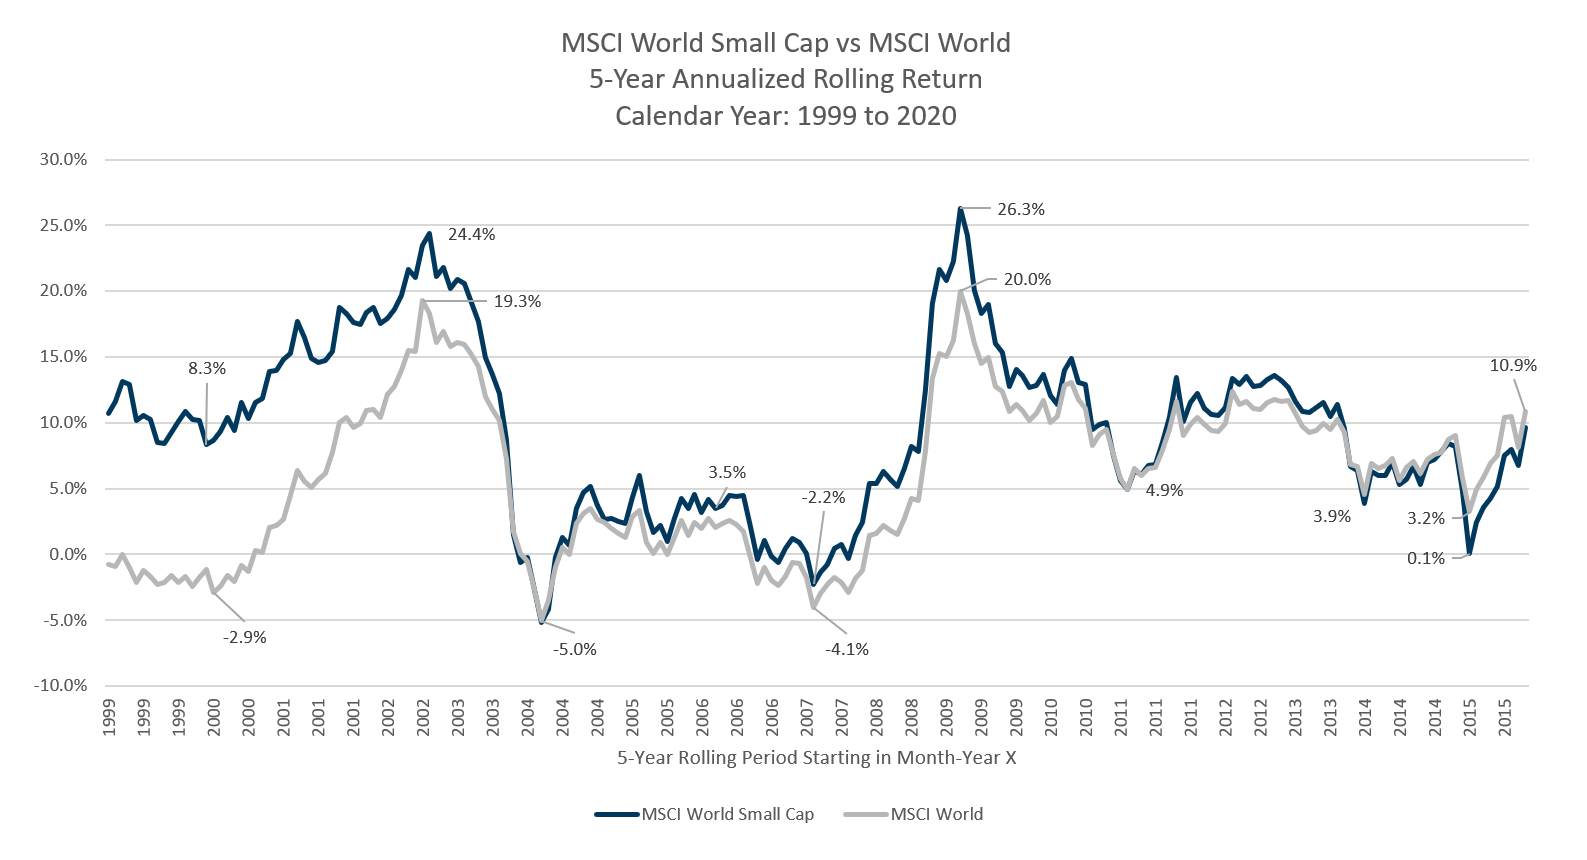
Take a look at the few 5-year periods in the early 1999 to 2000.
The disparity between MSCI World Small Cap and MSCI World was drastic. It seems that every time the market started running in excess, the small cap gives very wild returns.
The interesting thing is that in the worst 5-year period, which ends in the deepest part of the GFC (2004 to 2009), the performance of the small cap is not too different from the large cap.
I suppose the small cap recovered pretty well as well.
The rolling return gives us a glimpse of how the small-cap was able to do better than the large-cap in the first decade. The 6% a year was pulled up by the great outperformance in the 1999 to 2000.
If we exclude that, the small-cap did not do too differently compared to the large-cap (the 5-year periods in 2004 to 2008)
And here is the 10-Year Rolling Return comparison:
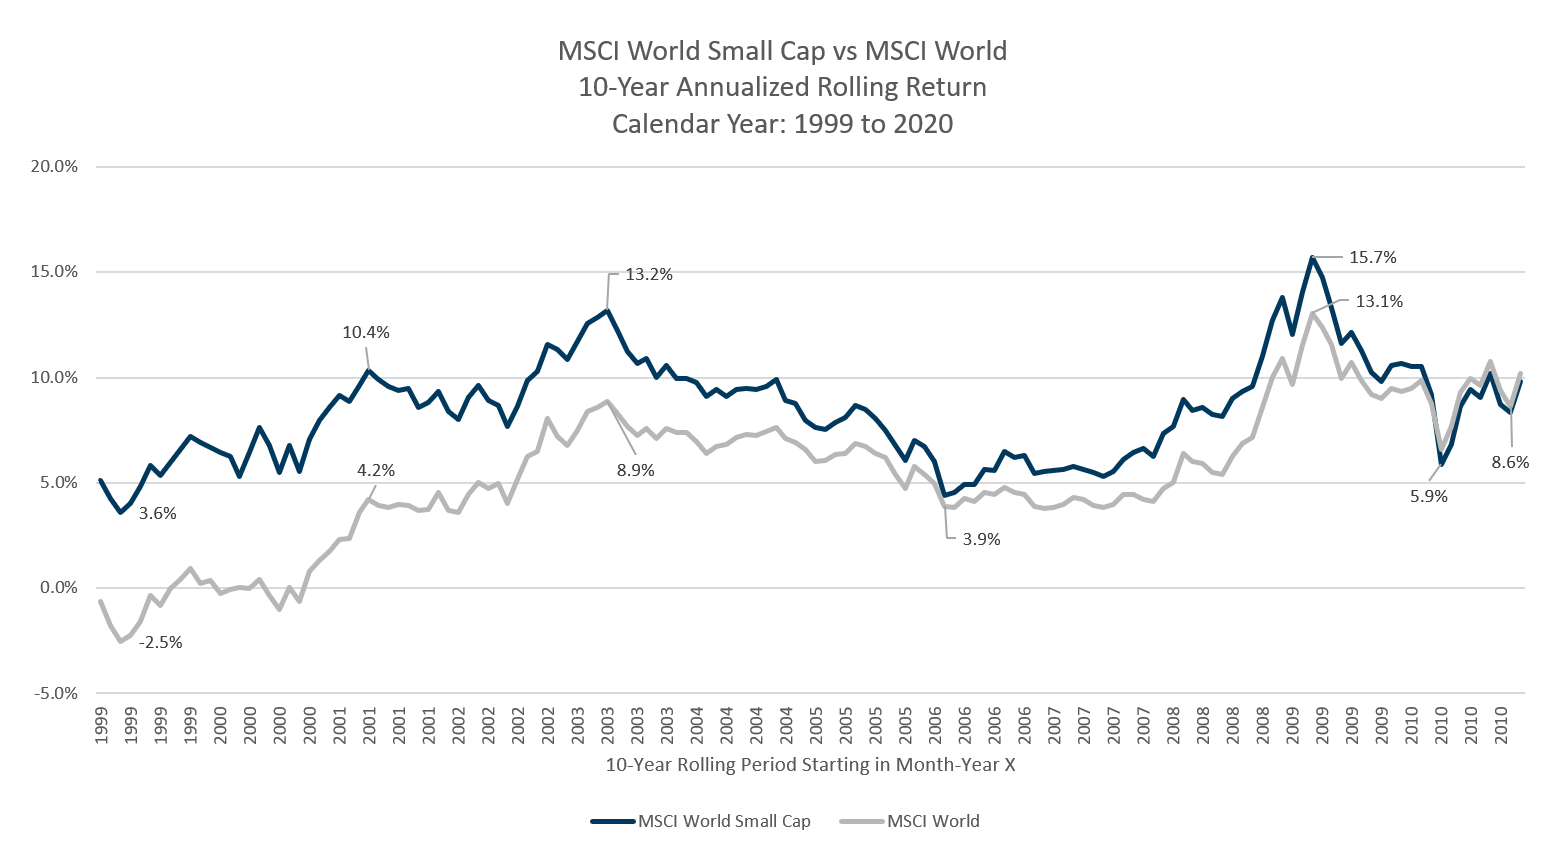
The lowest unqiue 10-year annualized return for the World Small Cap was 3.6% a year. This compare to to -2.5% a year for the MSCI World.
For a large part, the world small cap was able to deliver at least 5% a year.
Summary
The ironic thing is that while this is named a small cap index, the market cap of the companies are probably larger than majority of the companies in Singapore.
While the size premium seemed to disappear in the last 7 years, it is not as if it will not come back. We have seen the premium from time to time.
The above chart shows the size premium. Anything above zero means the performance of small-cap is greater than MSCI World.
Even in the last 10 years, there are enough periods of outperformance. The last three year’s underperformance seemed similar to the 2005 to 2006 period.
The WSML ETF provides us with a good instrument if you wish to take on more volatility, in the hopes to boost your portfolio and get a higher return, while still be rather diversified (3000+ companies).
You could replace some of your global large-cap equity allocations with an ETF such as this.
If you wish to get exposure to more factors, instead of using the WSML, you may see whether there is a good ETF listed on the LSE that gives you exposure to the size, value, profitability, momentum and low volatility premium.
At Providend, we subscribed to the research that there are some premiums such as the size premium in markets on stocks, bonds, alternative assets that we can help our clients capture through implementable funds.
Our implementation tends to be a multi-factor approach of not just size but also value and profitability. The struggle has always been to make sure the factors are pervasive, persistent and the implementation out there are decent.
I do have a few other data-driven Index ETF articles. These are suitable if you are interested in constructing a low-cost, well-diversified, passive portfolio.
You can check them out here:
- IWDA vs VWRA – Are Significant Performance Differences Between the Two Low-Cost ETFs?
- The Beauty of High Yield Bond Funds – What the Data Tells Us
- Searching for Higher Yield in Emerging Market Bonds
- The performance of investing in stocks that can Grow their Dividends for 7/10 years
- Should We Add MSCI World Small-Cap ETF (WSML) to Our Passive Portfolio?
- Review of the LionGlobal Infinity Global – A MSCI World Unit Trust Available for CPF OA Investment
- 222 Years of 60/40 Portfolio Shows Us Balanced Portfolio Corrections are Pretty Mild
- Actively managed funds versus Passive Peers Over the Longer Run – Data
- International Stocks vs the USA before 2010 – Data
- S&P 500 Index vs MSCI World Index Performance Differences Over One and Ten Year Periods – Data
Here are some supplements to sharpen your edge on low-cost, passive ETF investing:
Those who wish to set up their portfolio to capture better returns believe that certain factors such as value, size, quality, momentum and low volatility would do well over time and are willing to harvest these factors through ETFs and funds over time, here are some articles to get you started on factor investing passively:
- Introduction to factor investing / Smart Beta investing.
- IFSW – The iShares MSCI World Multi-factor ETF
- IWMO – The iShares MSCI World Momentum ETF
- GGRA – The WisdomTree Global Quality Dividend Growth UCITS ETF
- Investing in companies with strong economic moats through MOAT and GOAT.
- Robeco’s research into 151 years of Low Volatility Factor – Market returns with lower volatility that did well in different market regimes
- JPGL vs IFSW vs Dimensional Global Core vs SWDA – 22 years of 5-year and 10-year Rolling Returns Performance Comparison
- 98 Years of Data Shows the US Small Cap Value Premium over S&P 500
- 42 Years of data shows that Europe Small Cap Value premium over MSCI Europe
I invested in a diversified portfolio of exchange-traded funds (ETF) and stocks listed in the US, Hong Kong and London.
My preferred broker to trade and custodize my investments is Interactive Brokers. Interactive Brokers allow you to trade in the US, UK, Europe, Singapore, Hong Kong and many other markets. Options as well. There are no minimum monthly charges, very low forex fees for currency exchange, very low commissions for various markets.
To find out more visit Interactive Brokers today.
Join the Investment Moats Telegram channel here. I will share the materials, research, investment data, deals that I come across that enable me to run Investment Moats.


Do Like Me on Facebook. I share some tidbits that are not on the blog post there often. You can also choose to subscribe to my content via the email below.
I break down my resources according to these topics:
- Building Your Wealth Foundation – If you know and apply these simple financial concepts, your long term wealth should be pretty well managed. Find out what they are
- Active Investing – For active stock investors. My deeper thoughts from my stock investing experience
- Learning about REITs – My Free “Course” on REIT Investing for Beginners and Seasoned Investors
- Dividend Stock Tracker – Track all the common 4-10% yielding dividend stocks in SG
- Free Stock Portfolio Tracking Google Sheets that many love
- Retirement Planning, Financial Independence and Spending down money – My deep dive into how much you need to achieve these, and the different ways you can be financially free
- Providend – Where I used to work doing research. Fee-Only Advisory. No Commissions. Financial Independence Advisers and Retirement Specialists. No charge for the first meeting to understand how it works
- Havend – Where I currently work. We wish to deliver commission-based insurance advice in a better way.
Kyith is the Owner and Sole Writer behind Investment Moats. Readers tune in to Investment Moats to learn and build stronger, firmer wealth foundations, how to have a Passive investment strategy, know more about investing in REITs and the nuts and bolts of Active Investing.
Readers also follow Kyith to learn how to plan well for Financial Security and Financial Independence.
Kyith worked as an IT operations engineer from 2004 to 2019. Currently, he works as a Senior Solutions Specialist in Insurance Start-up Havend. All opinions on Investment Moats are his own and does not represent the views of Providend.
You can view Kyith's current portfolio here, which uses his Free Google Stock Portfolio Tracker.
His investment broker of choice is Interactive Brokers, which allows him to invest in securities from different exchanges all over the world, at very low commission rates, without custodian fees, near spot currency rates.
You can read more about Kyith here.
- My Dividend Experience Investing in UCITS iShares iBond Maturing in 2028. - April 23, 2024
- We Invest into Popular Funds When They Are Popular, Exactly When They Started Turning to Shxt. - April 22, 2024
- Meal Prep 2.0 – Cooking Your “Go-to” Meal that You Look Forward to Eating Everyday. - April 21, 2024
FF
Thursday 4th of February 2021
Thanks for the article. Would you know how WLDS and WSML differ? Is it merely a difference in GBP vs USD, and hence it's basically a choice between which currency you would be more bullish on?
Kyith
Friday 5th of February 2021
Hi FF,this is the first time I have observed that. I think it is only the currency difference.
Amit
Monday 28th of December 2020
Hi Kyth,
Thanks for the article. I've been thinking of getting this WSML ETF. How much % allocation would you recommend to add to a portfolio with either VWRA OR IWDA+EIMI? Many thanks.
Kyith
Monday 28th of December 2020
Hi Amit, it is difficult to say. Suppose if you believe enough of the size premium or can take the volatility, it can be 20% of a portfolio. if not the idea is maybe 5-10% of your portfolio
moneysavegeek.com
Sunday 20th of December 2020
I actually wish there was a VT like ETF for non US investors, then you would cover large, medium and small caps (globally) under one fund.
Seems like small cap does have its place. More volatility but more upside (especially in the long run). But this does mean adding another ETF to your portfolio, which may not work if you want to KISS.
Would be interesting for your take on value ETFs as well.
moneysavegeek.com
Monday 28th of December 2020
@Bobby W, thanks for that, yep there is VWRD but it doesn't include small caps. VT includes small caps.
Bobby W
Sunday 20th of December 2020
@moneysavegeek.com,
How about vwrd by Vanguard? It's on the LSE and domiciled in Ireland.
Kyith
Sunday 20th of December 2020
even if it is 5 ETF it is still quite simple
Kokwai
Sunday 20th of December 2020
Hi,
Newbie question: since you've mentioned WSML "is an accumulating fund, which means it does not pay out a dividend", do we still need to be concerned about dividend without tax?
Kyith
Sunday 20th of December 2020
HI Kokwai, thanks for the question. Indirectly, you will be paying withholding tax because you own the fund. say for example WSML owns only 1 small cap stocks and it pays a 2% dividend. so WSML receives 2% x (1-0.15) in dividends from this company. A distributing fund (as opposed to an accumulating fund) would pay out this dividend to you. but since this this an accumulating fund, the fund reinvest this dividend back into the small cap stock. We cannot run away from withholding taxes, but the UCITS fund domicile in Ireland can be more efficient by taxing only 15% instead of 30%. hope this helps.