Some of us who have been investing for some time may feel very strongly about our stock or financial securities selection criteria.
Some of us prefer stocks that are neglected, undervalued and low-volatile.
Some of us prefer companies with growing earnings over time. We tend to think that as long as the cash flow grows, the company will do well.
Some prefer to buy stocks with good quality but also show strong momentum.
Some of us may have the sophsitication to do this well. For others, they have this philosophy but they might found their execution lacking.
Some might not be able to have the time to screen for stocks based on a particular criteria, looked through the stocks to see if the stock really passed your metrics and then process to buy and then monitor it.
Even if you are able to do that, you may not have the sophistication in portfolio management.
Researchers and financial professionals have overtime managed to distill some of these investing philosophies we may feel good about into independent drivers of return.
They called these independent drivers of return factors or smart beta.
And with the improved sophistication in indexing, computers, reduced trading costs, decentralised financial research, retail investors like you and me may be able to replicate this kind of investment philosophies with less complexity.
Today’s article is a deep dive into how you can passively invest in a systematic rules-based manner.
These rules are based around independent drivers of return that were backed by historical evidence that is shown to work in various markets and across different time periods.

What we hope to achieve is to find a passive, systematic way to capture greater than market returns.
The chart above shows the growth of wealth of the MSCI World from 1999 to 2020. $1 mil have grown to $3.5 mil over the past 22 years.
What is interesting is that if we incorporate different drivers of returns over the same basket of developed market stocks in the MSCI World, we may be able to capture a greater return.
Ok, let us get started.
What is Smart Beta or Factor Investing?
Over the years, different people have sought to identify the drivers of returns in different asset classes.
If they are able to identify what drive the returns, then they may be able to allow investors to better capture the returns.
Smart Beta investing, to put it simply, is to centre your investment strategy around
- identifying these drivers of return
- identify securities that fit these drivers of return
- and own these assets over different time periods to capture the returns
What different researchers or investment professionals have identified is that drivers of return, tend to be different kinds of risk factors (hence the name factor investing).
Because there are risks, investors hope that by investing their money in these securities, they are adequately compensated for taking the risks.
These drivers of return that rose to the surface are risky but researchers or investment professionals find that investors will be adequately compensated for taking the risk. (this means that you can find a lot of characteristics that looked risky and you hope to be compensated with good returns, but most often the returns are not worth the risk)
The reason we bothered with factors is because research shows that
- You take a different kind of risk
- You are adequately compensated
- Explains a large part of the returns between different diversified portfolios
Modern tools of finance have made it easy for investors to build wealth when these drivers of return have been identified in a systematic and rules-based manner.
We do not have to go through the process of screening and identifying these basket of securities and then proceed to buy each of these securities or sell those securities in our portfolio that does not fit our criteria.
A Simplified Example of Smart Beta Investing
Suppose a lot of academic research has shown us that there is persistent and pervasive evidence that stocks that are the least volatile have done well over time. This evidence may be present across various time periods as well.
- With these criteria, a “smarter” index strategy can be constructed to filter stocks that are lower in volatility based on standard deviation.
- On a periodic basis, the creator of this index can re-filter the stocks to see which stocks fit and don’t fit this low standard deviation criteria. The stocks will then be added and delete from the index. This is call re-constitution.
- With such an index, a fund provider such as BlackRock, Vanguard, State Street can create a unit trust or exchange-traded fund (ETF) based around this low-volatile index strategy.
- As an investor, you can invest in such a unit trust or ETF.
By doing that, you are passively investing in a systematic strategy that adds and discard stocks based on a tried and tested formula.
Factor investing in recent years tend to be branded as Smart Beta, which to some of us may sound a little nicer.
Some Common Examples of Smart Beta Passive Investing
When you invest 100% of your portfolio in an iShares Core MSCI World UCITS ETF (IWDA), you are doing the most simple form of factor investing.
By doing that you are gaining exposure to the market risk premia, as you believe that stocks are more risky than risk-free treasury bills and you will be adequately compensated for it.
The historical evidence have show us that equities tend to provide higher returns over time, not just in one market but across many different markets, and across different time periods.
Another factor that bobbled up to the surface is the value factor. A lot of us believe we should not overpay for stocks and sell stocks that are overvalued.
Many of us have done the job of screening and identifying the stocks, the research and execution ourselves.
If we refined our selection criteria, we would have realize that our criteria may largely be similar to a value factor index.
If that is the case, all we have to do is to identify a good smart beta value unit trust or ETF, invest in it, and the fund will automatically do the screening, adding and deletion for us in a passive manner.
In the past, we have to identify a good value manager to help us screen, assess the companies and then execute by paying a high management fee. With these factor ETFs or unit trusts, it allows us to do it in a more passive manner.
Some value factor ETFs or unit trust can be:
- BlackRock’s iShares Edge MSCI World Value Factor UCITS ETF (IWVL) which is Irish domiciled
- Avantis International Small Capp Value ETF (AVDV) is the U.S domiciled.
I put these two funds here just for illustration (does not mean their performance is better in any way)
I will give more investable Factor ETF examples at the end of this article.
The History of Factors in Investing
I can try and explain the history of research behind factor investing but I do not think I can do it in such a way better than a series of Ben Felix videos.
Ben Felix is a portfolio manager at PWL Capital, a Canadian passive wealth advisers firm that recommends Dimensional Funds to their clients.
I find his videos to be clear and he is a better communicator than myself.
Watch from 0:30 to 8:30 of this video titled Small Cap and Value Stocks:
This video summarizes and explains the following:
- The Market Risk Factor from the CAPM Model identified in the 1960s – Differences in market risk exposure of your portfolios explain 2/3 of the difference in returns between two diversified portfolios
- The other 1/3 difference can be explained by other risk factors or drivers of return. These factors are slowly identified by researchers over time
- In the past, this 1/3 is attributed to a manager’s skill in securities selection
- Rolf Banz research in 1981 identified small stocks giving consistently higher average returns that could not be identified by their market beta
- Barr Rosenberg, Kenneth Reid and Ronald Lanstein identified in 1985 that value stocks have higher average returns that are not explained by market beta
- Fama and French pulled together these market anomalies in 1992 and proposed the Fama-French three-factor model. The three factors are market-risk, size and value. When they added these two independent factors to market-risk, they proved that the manager’s skill can be effectively be reduced to zero
Watch from 2:05 to 6:00 of this video titled Should you be factor investing:
- Ben brings up his colleague’s public work. His colleague took a handful of actively-managed funds and did a three-factor analysis. The analysis shows that much of the active funds’ returns can be attributed to factors identified by the researchers. The returns are less to do with managers’ skill but because they tilted their portfolio towards smaller and value stocks
- In 1997, Mark Carhart added a fourth factor called the momentum factor.
- In 2012, Robert Novy-Marx added a fifth factor called the profitability factor.
- These 5 factors together explain 95% of the return differences between diversified portfolio.
- In 2014, Fama and French came up with their own 5-factor model. The 5 factors are market, size, relative price, profitability and investment. They ignored momentum as a factor.
- Researchers continue to identify factors to better explain the differences in return. The prestige of being recognised for their work is a driver for this continuous work. It can be a problem. Much academic research has claimed to identify new factors. Over 300 factors have been identified in academic literature. However, many of these factors did not pan out. Often, they end up as a repackaging of the original factors.
- A sniff test to consider whether something is a factor. They should have 5 characteristics: They should be persistent (different time periods), pervasive (different assets or regions), robust to alternative specifications (whether you use price-earnings or price-to-book it shows up), investable (can it be cost-effectively captured in a portfolio) and sensible
Ben Felix later came up with a video to summarize and explain the 5-Factor Smart Beta Model Better:
One thing we all will realize is that this work is not going to be completed. Some researchers will come out and prove that the existing factor model do not explain all the difference in return of diversified portfolio.
Further testing would identify some other factors.
The Commonly Discussed Factors
There are many factors that are talked about. Worse, some of them are pretty similar to one another. Some researchers disagree that some factors are considered factors due to a lack of economic principles (e.g. momentum).
Andrew Ang, BlackRock’s head of factor investing strategies breaks down the drivers of return into Macro Factors and Style Factors.
Macro Factors
These are the factors that drive return on a high level. You can read them as risks and uncertainties.
- Economic growth. Exposure to business cycles
- Real interest rates. The risk of interest rate movements
- Inflation. Exposure to changes in prices
- Credit. Default risk in lending to companies
- Emerging markets. Political and sovereign risks
- Liquidity. Holding illiquid assets.
Style Factors
These are the factors that were proven overtime to be pervasive, persistent, can be tested and be harvested in some ways.
MSCI’s academic research have a list of common style factors:
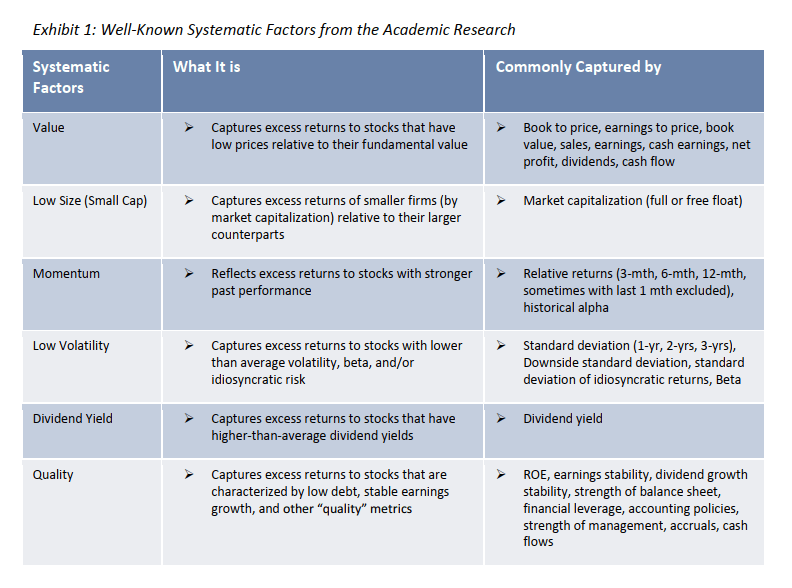
Different companies may have variation of these factors but the very common ones are:
- Value
- Size
- Momentum
- Low Volatility
- Quality or Profitability
There may be more factors identified over time. However, often than not, what we realize is that these new factors is a combination of a few of these existing style factors.
This means that at first you will see that these factors generate positive excess returns over the market.
However, if you normalize or try to account for the presence of these existing factors (market, value, size, momentum, low volatility and quality), the positive excess returns go away.
The Economic Principles Behind Smart Beta
Andrew Ang explained that we can pigeon-hole the occurrence of these factors into three categories:
- There is a reward for bearing some form of risk. This could be market risk, buying smaller, riskier companies, companies that are less liquid, taking on insurance risk. Some factors have earned higher long-term returns to compensate investors for taking on more risk.
- Structural Impediments. Market rules or other constraints can place restrictions on certain large investors. Those off-limits investments can become opportunities for others.
- Behavioural Bias. Investor behaviour is not always perfectly rational, giving rise to mispricings
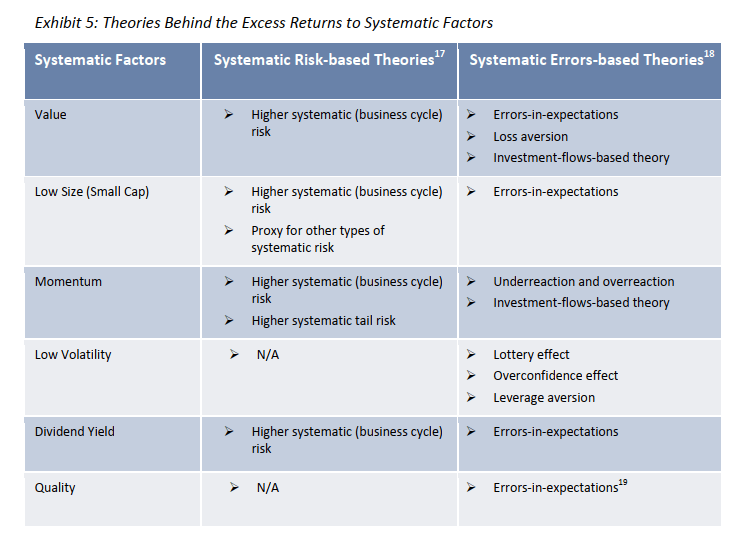
The researchers at MSCI listed multiple theories that support why these factor anomalies exist. They came up with a pretty similar conclusion as Andrew:
- Systematic risk. These are traits that cannot be diversified away. Factors earn excess returns because these systematic risks cannot be diversified away.
- Systematic errors. Rooted in behavioural finance. Contrary to the assumption of efficient markets, we are susceptible to chasing winners, over-reacting, overconfidence, prefer familiar investments of companies we worked for, home bias, myopic loss aversion.
If we classify things this way, certain factors can be explained better. One good example is low volatility. By default, if we just use market-risk to explain returns, lower volatility stocks should have lower returns (usually higher risk equals higher returns)
Certain aversion to low volatile stocks may be able to explain the better performance of low volatile stocks.
The Improved Portfolio Returns That Smart Beta Indexes can Achieve Over Market Cap-Weighted Index Investing
The goal of investing is to help us build wealth over the long term. This is often translated to getting a good return for the risk undertaken.
Risk is measured in terms of volatility of the portfolio measured by standard deviation. (as opposed to the definition of risk by individual stock investor of permanent capital impairment)
By adding or mixing up securities in our portfolio, we should:
- Increase the long-term annualized return of the portfolio (so that you can reach your wealth-building goals)
- Reduce the standard-deviation or volatility of the portfolio (so that you won’t be shaken and do stupid things with your money, and stay invested)
- Increase the long-term annualized return while reducing the standard deviation of the portfolio.
The good thing about factor research is that we can back-test these factor strategy to see our experience if we invested based on these factors in the past.
Factors allow investors to invest based on their portfolio goals
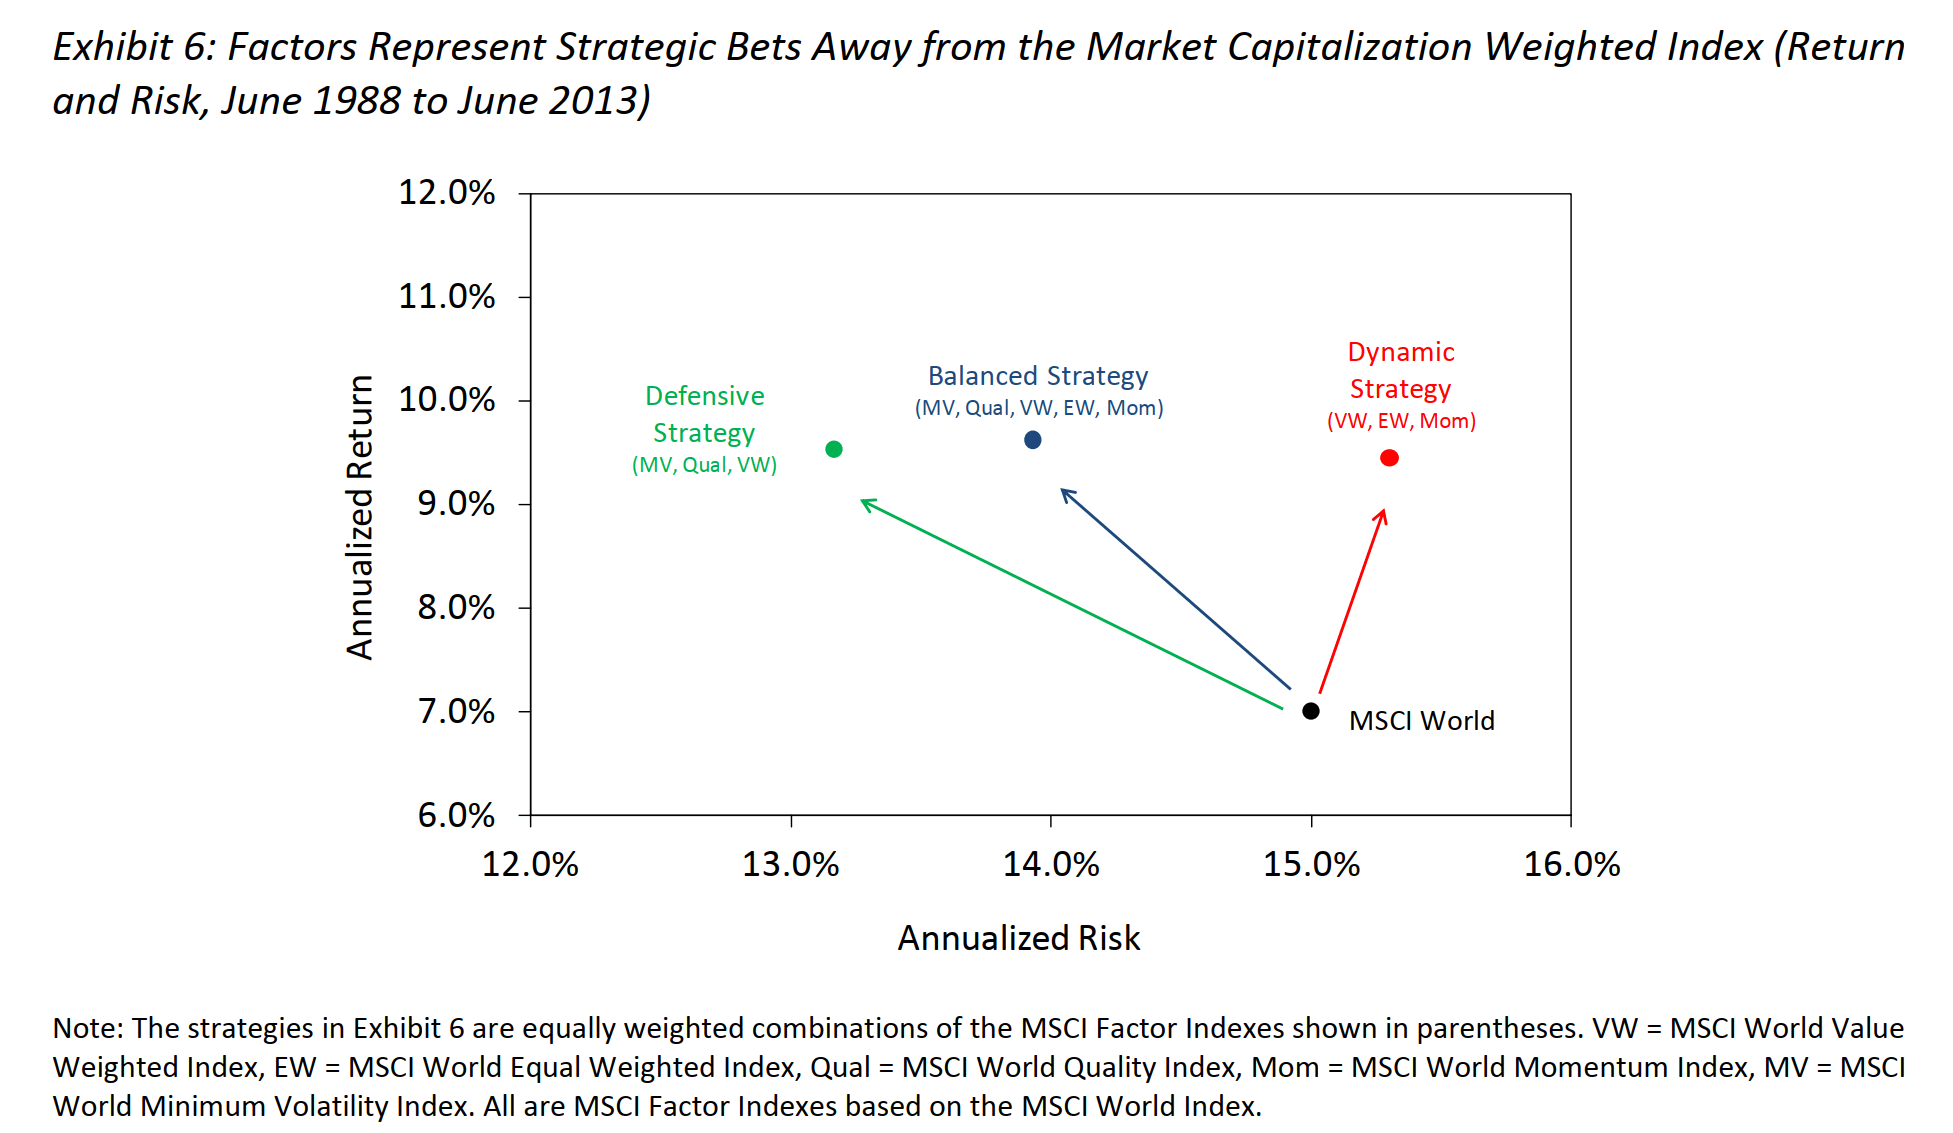
MSCI slice-and-dice the MSCI World, a market-cap-weighted index into various sub-basket of stocks as factor indexes and backtested the returns from 1988 to 2013.
What you will notice is that almost all sub-baskets have higher annualized returns over MSCI World. Certain factors result in lower volatility while giving higher return.
You can combined these factors and have three different strategies based on your portfolio goal:
- Defensive Strategy: Minimum Volatility, Quality and Value
- Balanced Strategy: Minimum Volatility, Quality, Size (equal-weighted) and Momentum
- Dynamic Strategy: Value, Size and Momentum
If we have factor-based ETFs that targets different factors, we can shift our portfolios according to our thoughts on the market, yet still, be exposed to the market to capture the returns.
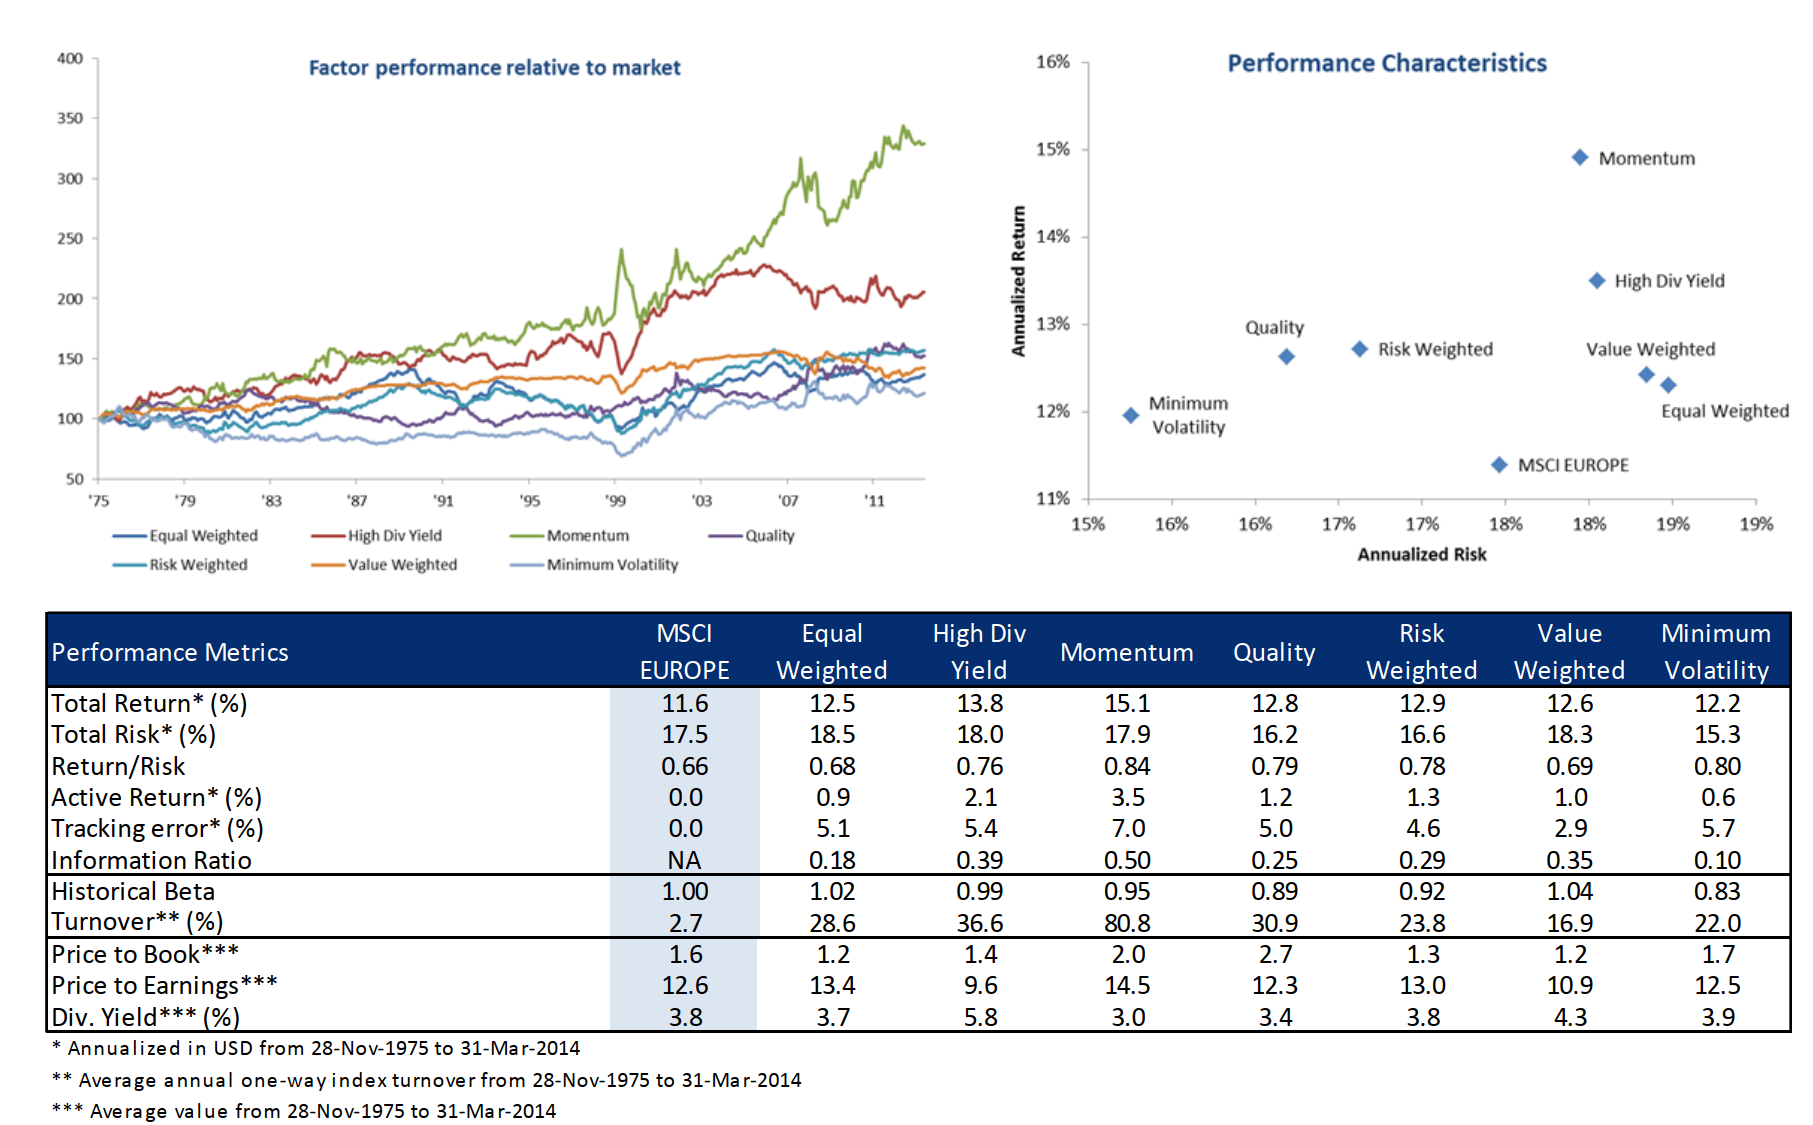
Factors generally do better in terms of returns and risk versus the cap-weighted index over time
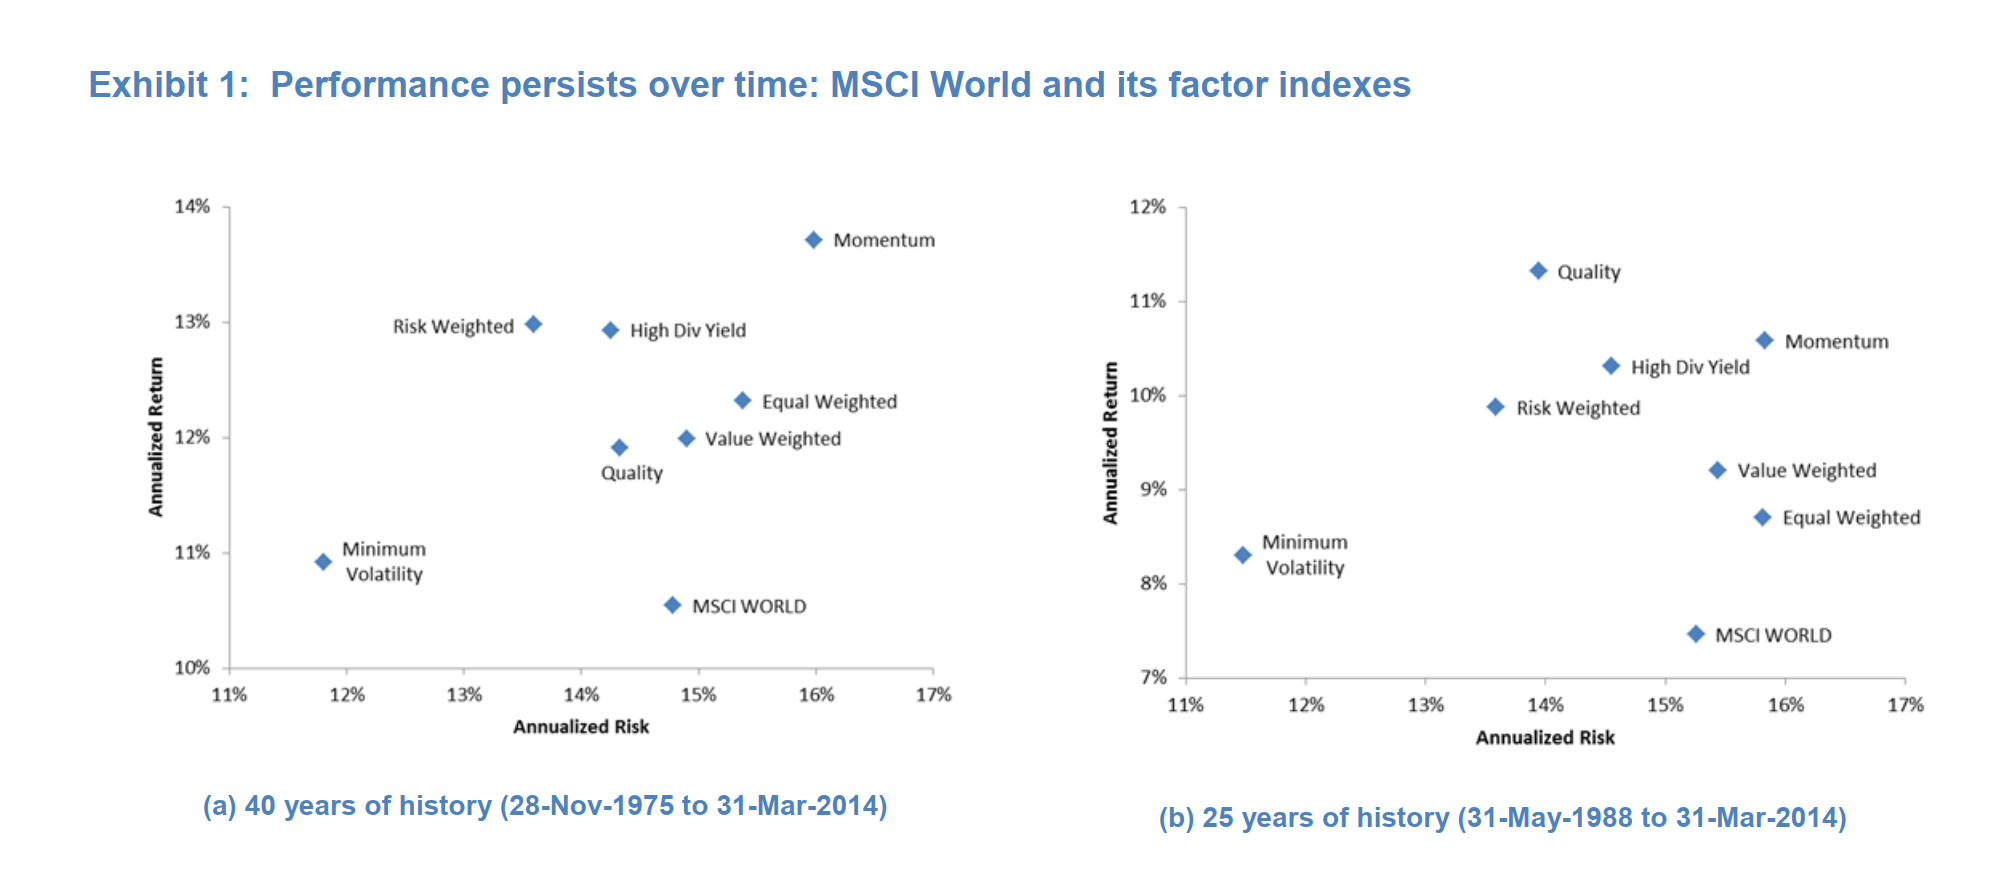
The chart above shows the risk versus the return of different factor indexes over the past 40 years.
The charts show that all factor indexes have outperformed their parent index (MSCI World Index) over the 40-year horizon.
Some factors have higher performance with lower risk:
- Quality
- High Dividend Yield
- Risk-weighted
- Minimum Volatility
Factors do show periods of underperformance even when they have long-term outperformance
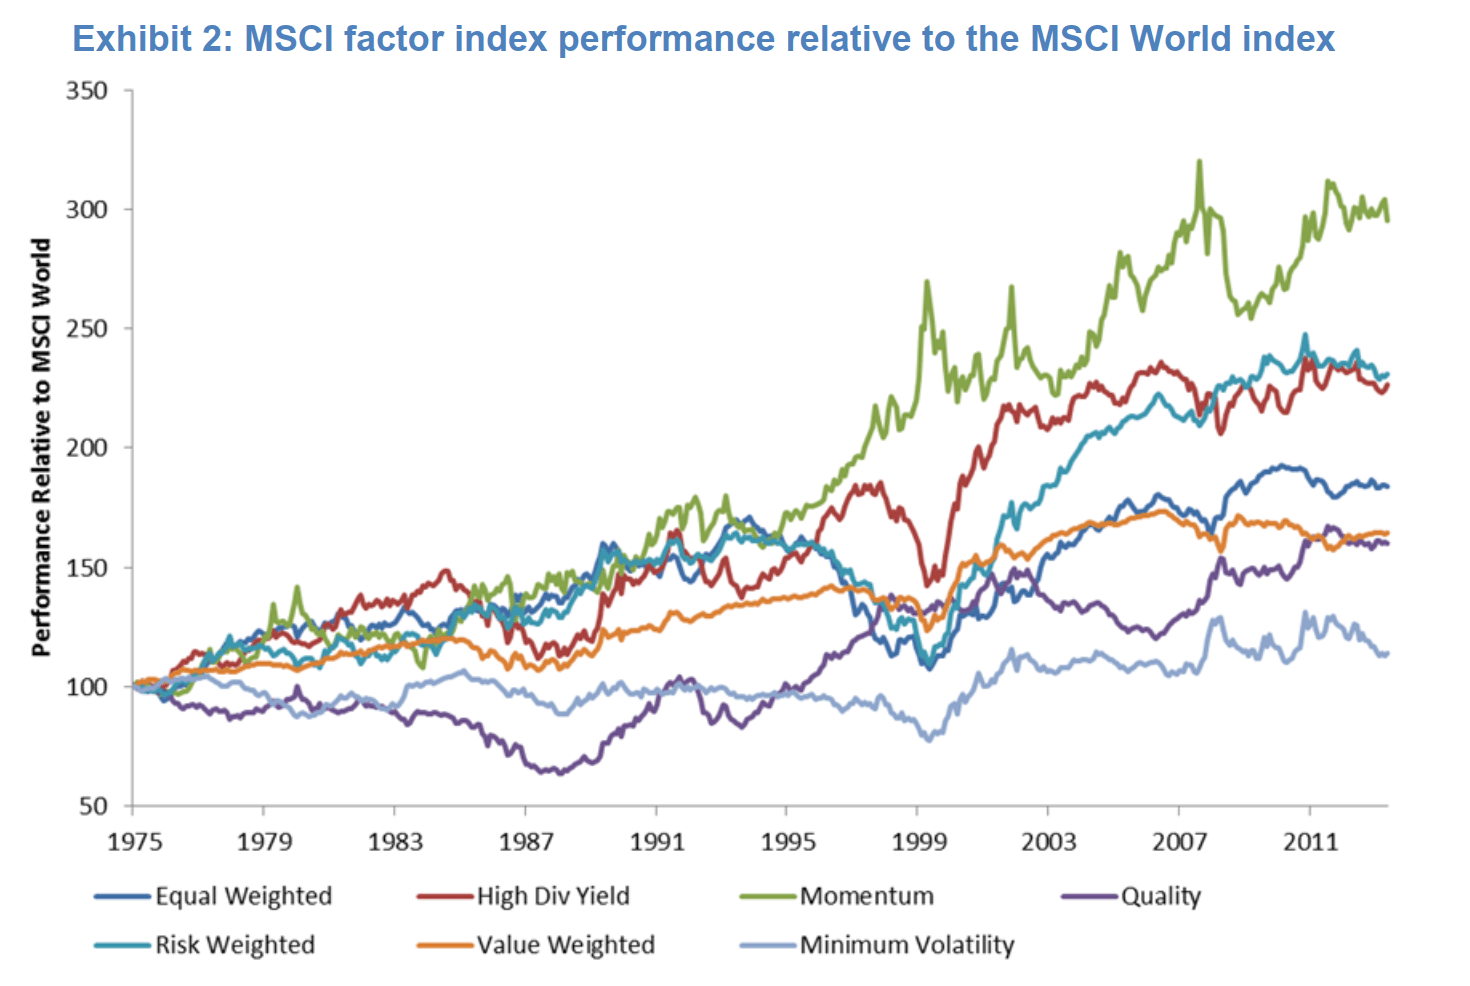
While the long-term returns are persistent over 40-year periods, there are sub-periods where some factor indexes lagged their respective parent indexes.
The chart above shows that all the factor indexes outperform over time (above 100 is outperformance)
Quality index experience long but slow underperformance from 1980 to 1988 (although they are doing well now!)
Risk-weighted and equal-weighted indexes experience shorter and steeper underperformance in the 1990s.
And we know the story of value underperformance today.
There are also other characteristics:
- Momentum factor have been negatively correlated to most other factor indexes (especially in the run-up to the dot-com bubble)
- Value and Minimum Volatility indexes show much smoother growth over time compared to the rest
It is important to understand that there is no free lunch. There will be periods where these factors disappear and other factors do better.
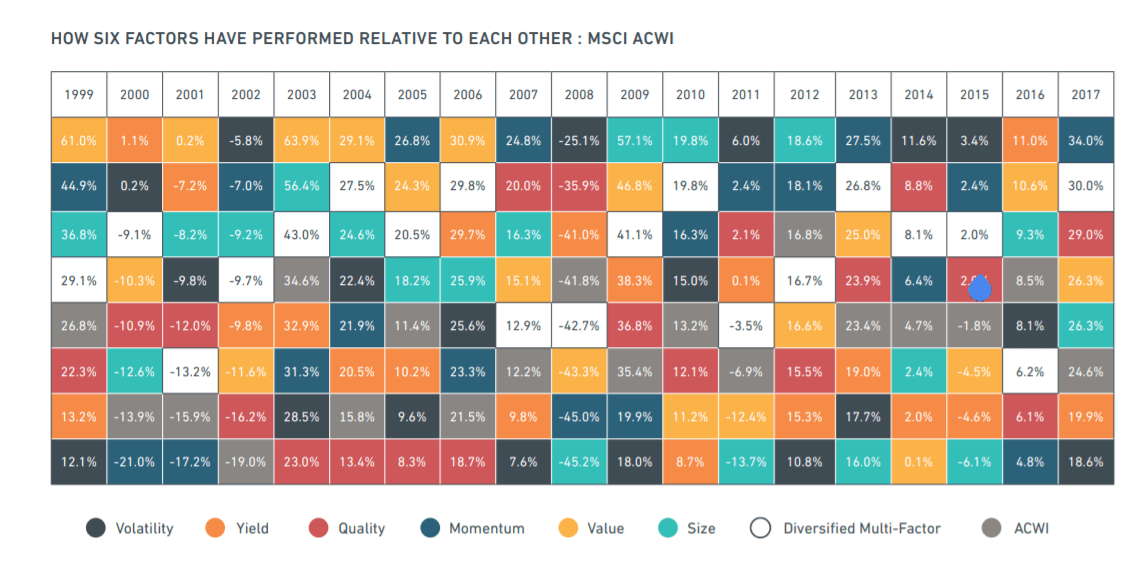
The canvas above shows the performance of six different factors over the base MSCI All Country World Index (ACWI) from 1999 to 2017 (18 years).
There are some observations:
- Throughout the 18 years, no single factor remains undisputed on top or at the bottom
- Value did very well in the first 9 years. Then it didn’t do so well
- Quality didn’t do that well from 2003 to 2006
- The base MSCI ACWI didn’t outperform in any of the 18 years (if I am right after 2017, the base MSCI ACWI managed to do that)
- The diversified multifactor index, which is a blend of all the different factors were consistently higher than the base MSCI ACWI for 17 of the 18 years
Factor Outperformance and Volatility Profile Over Rolling Periods
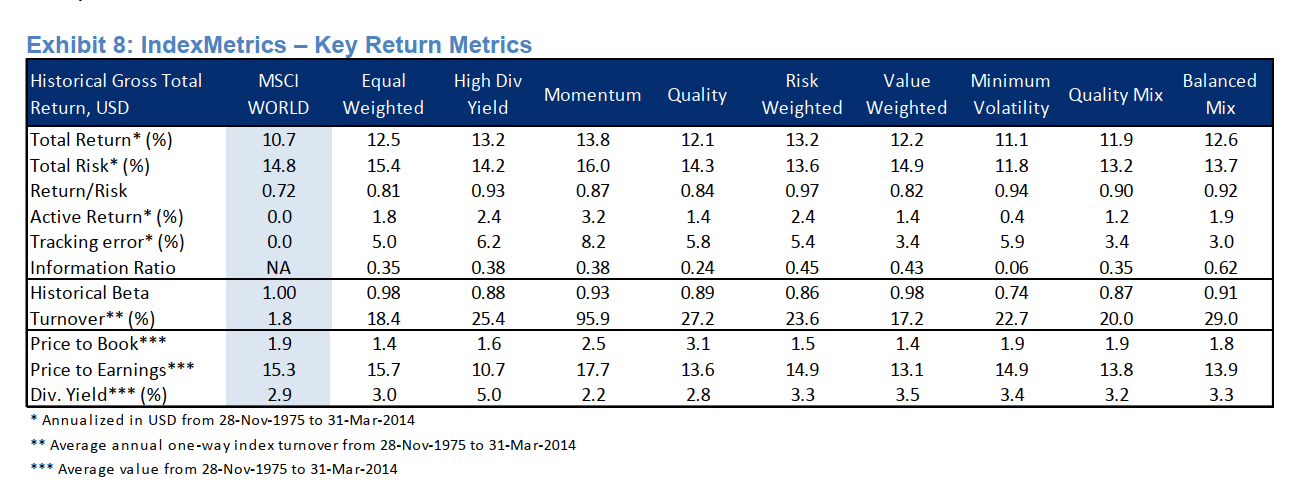
The following table shows how factor indexes have performed over the MSCI World index using varioius rolling time periods.
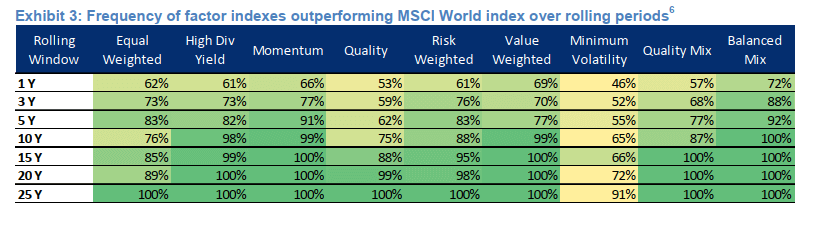
MSCI use monthly prices and look at returns on a monthly rolling basis. For example, the first row shows how often the 1-year performance of individual factor indexes have been greater than the MSCI World.
This table allows you to see the experience if you invest in the factor index. Over a short term, say 3-year period, there are instances that these factors will not do so well versus the MSCI World.
Over the longer term, they tend to do better.
MSCI Global Minimum Volatility indexes display the lowest frequency of outperformance. MSCI explaines that this result is by design. The Minimum Volatility index was constructed to deliver the performance characteristics of a minimum-variance strategy, with a focus on absolute return and low volatility.
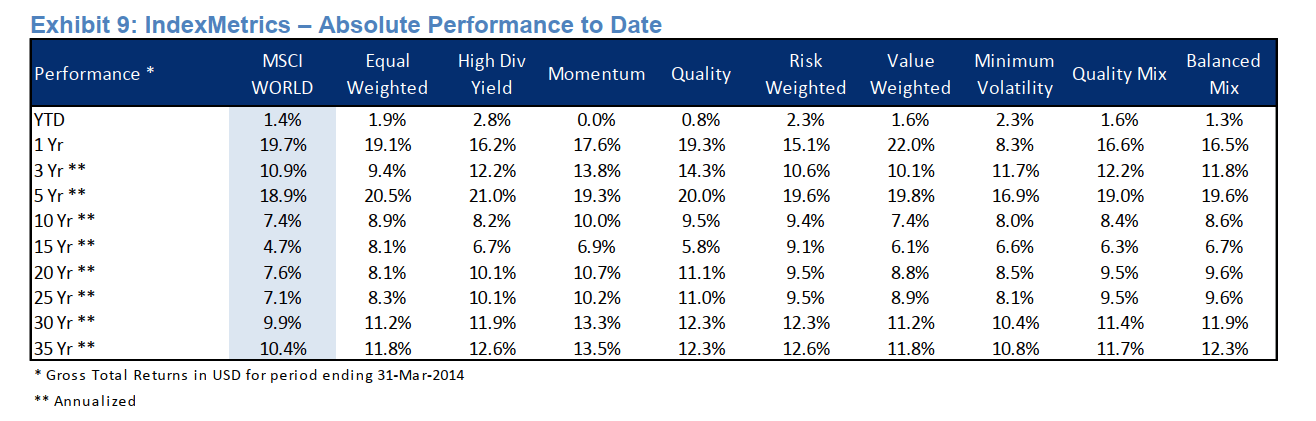
The following table shows the volatility profile of these indexes:
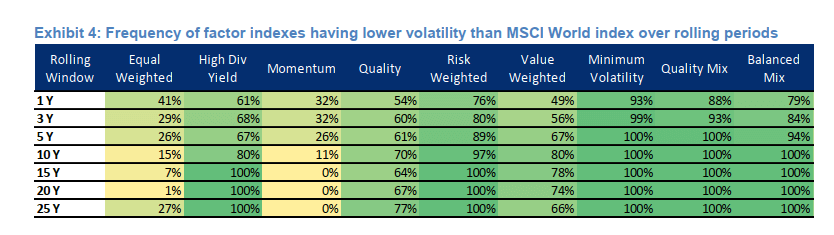
The result is quite the opposite if we take a look at momentum and minimum volatility.
Over the long term, the momentum volatility will always be higher than MSCI World. The minimum volatility and quality indexes showed some of the lowest volatility.
I want to bring your attention to the last column: Balanced Mix.
This is a combination of six current MSCI factors indexes: Value, Momentum, Equal Weighted, Quality, High Dividend and Minimum Volatility.
If we look at the returns and volatility, the balanced mix was able to do better than the MSCI World over various rolling periods.
The question on our mind is whether we can get exposed to such a balanced mix in real life to get this kind of returns profile.
More Metrics Regarding the Factor Indexes.
How Pervasive and Persistent are The Premiums of These Factors?
It may be well and good that these factors worked on MSCI World, but what about other markets or assets.
My research leads me to believe that some of these factors are not so pervasive across ALL types of assets and ALL markets.
In some markets, certain factors do better.
MSCI have provided the data for these major markets.
The sick region. All factor indexes outperformed the parent index over the 40-year period. Momentum looks to generate the highest return. Minimum volatility, quality and risk-weighted is able to generate higher returns at lower volatility.
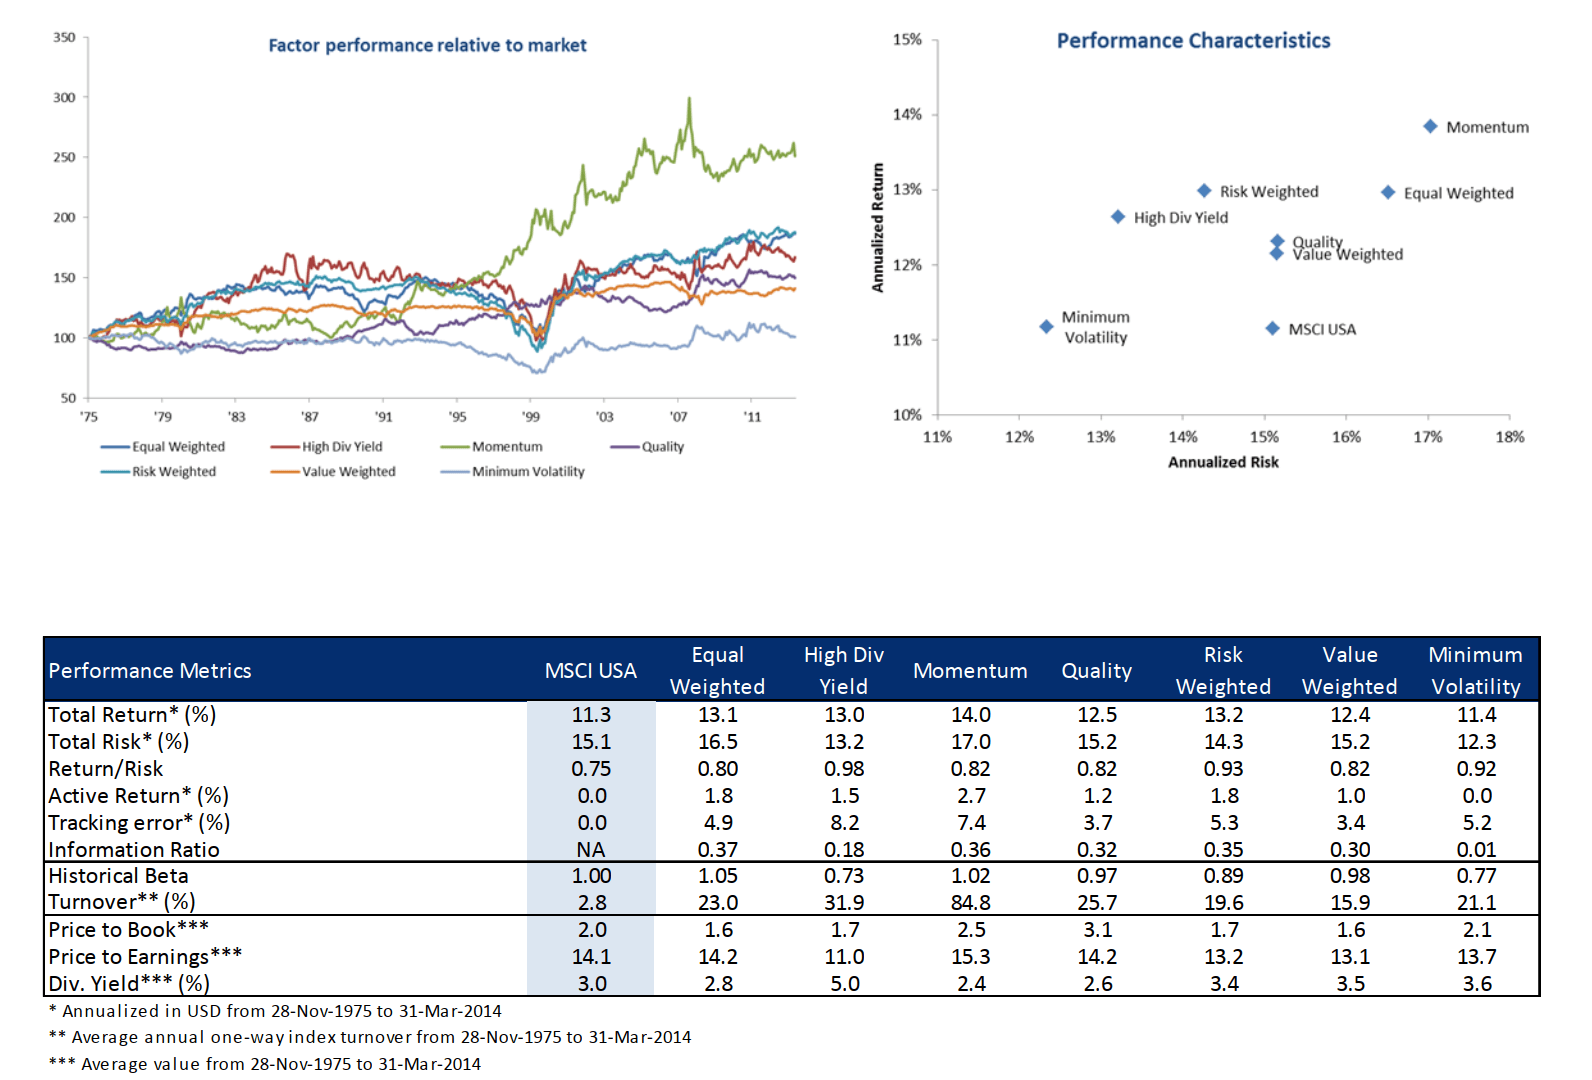
The economic super power. Almost all factor outperformed the parent index over the 40-year period.
The exception is the Minimum Volatility Index. On a risk-adjusted basis, Minimum Volatility outperformed its parent index with a return per unit risk of 0.92 versus 0.75 for MSCI USA.
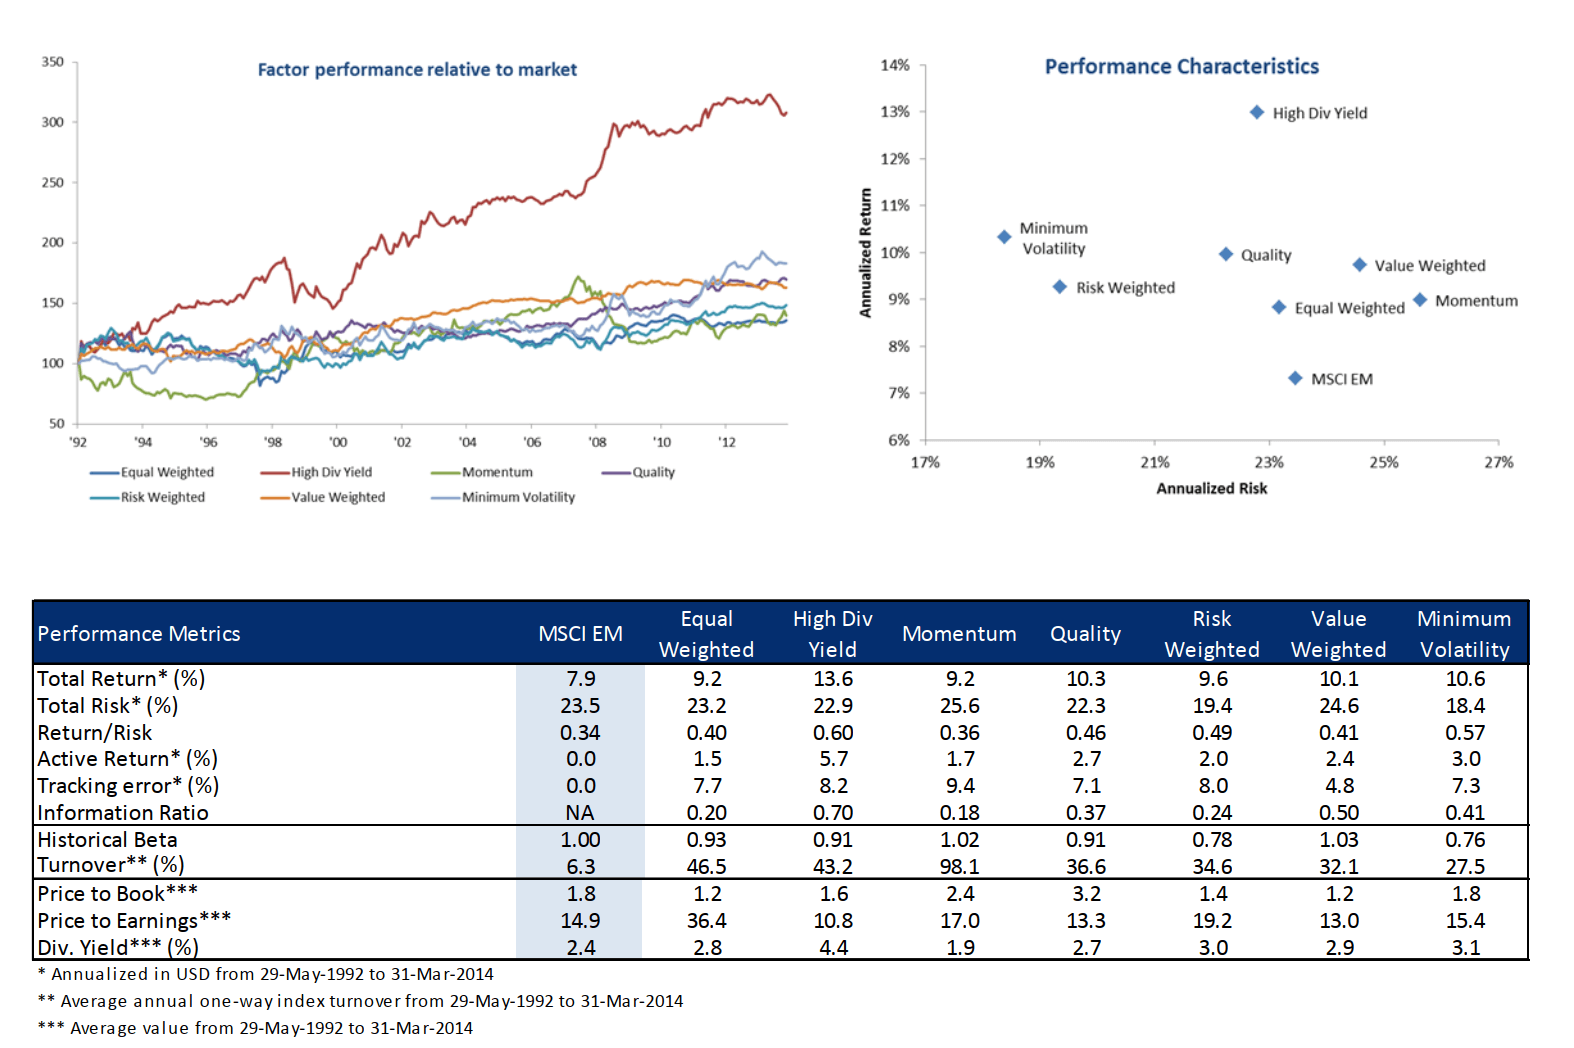
All emerging market factors outperformed the parent index.
Quite importantly, most show lower volatility.
The High dividend index shows the highest return for this region.
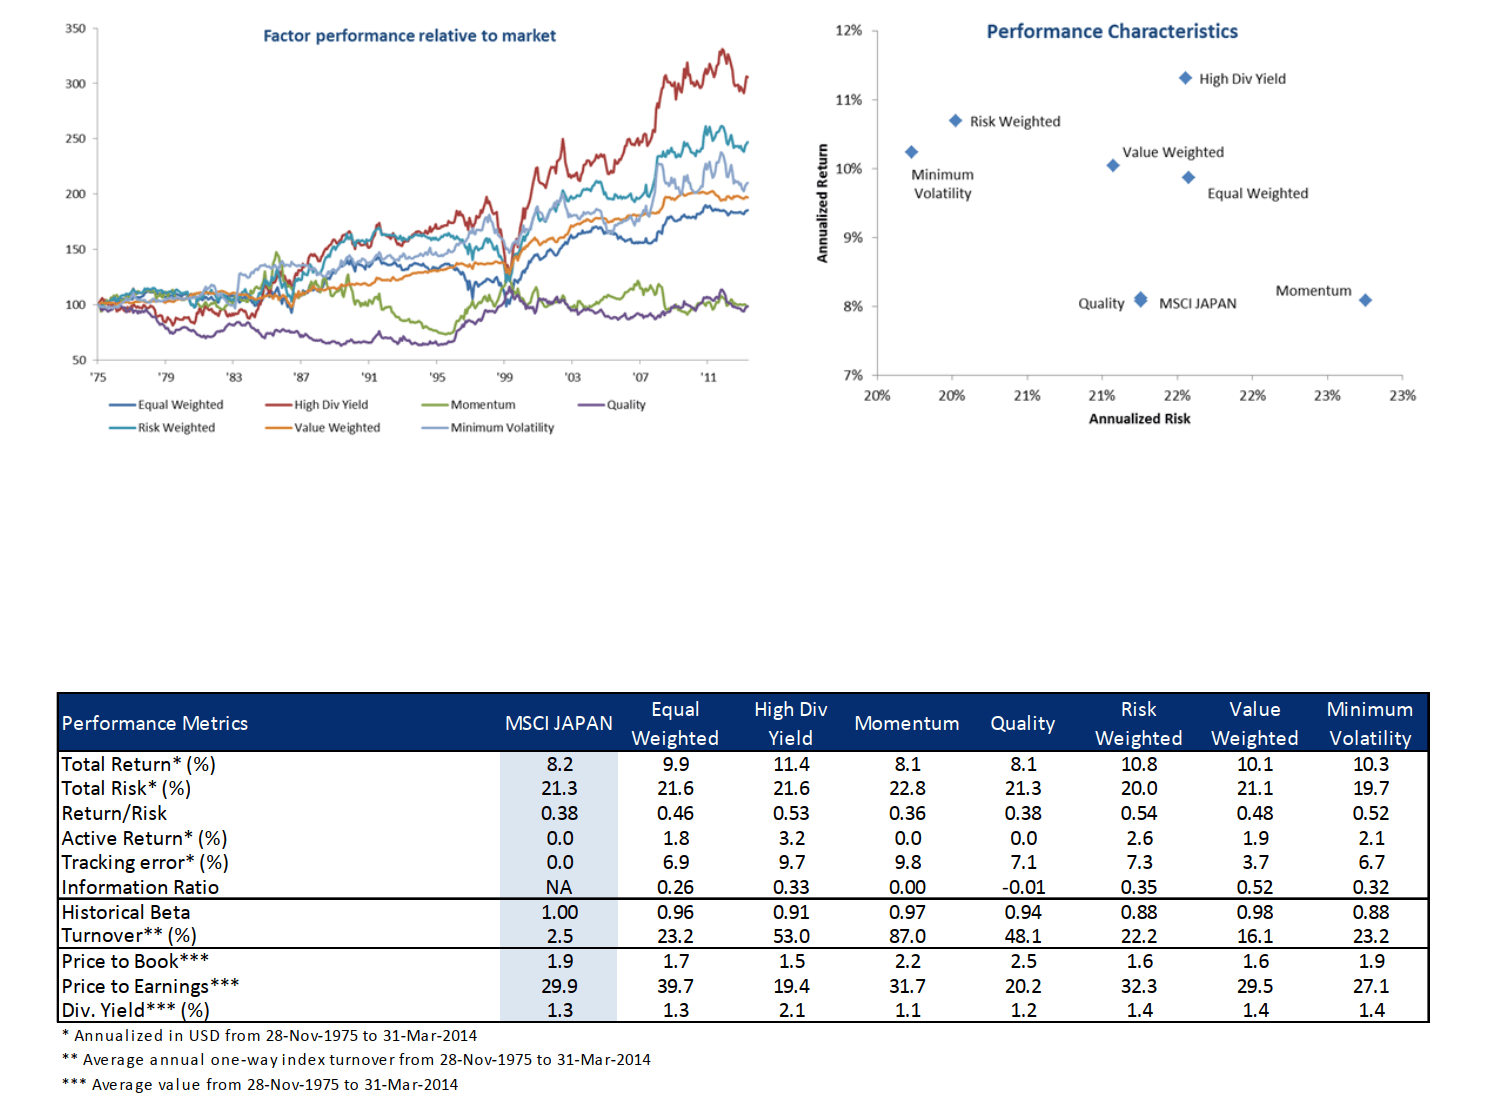
Japan is interesting because we know Japan went through a 30 year bear from 1990 to now.
For Japan, Quality and Momentum indexes do not show any premium for the 40-year period. The winner here is the High dividend index.
Some short observations:
- In most regions, the factors are persistent
- Momentum is a great factor, but in emerging markets, it did underperform for periods and didn’t appear in Japan
- The factors are cyclical. They do not always appear. You will still need to invest for the long term
- It will be great if we can mesh a few of these factors together to smooth out the returns
Smoothing Out the Cyclical Nature of Independent Factors with Multi-Factor Indexes
If you manage to interpret the factor data up to this point, you may wonder whether it is possible to smooth out the cyclical nature of each factors by layering them together.
This is what multi-factor indexes tried to do.
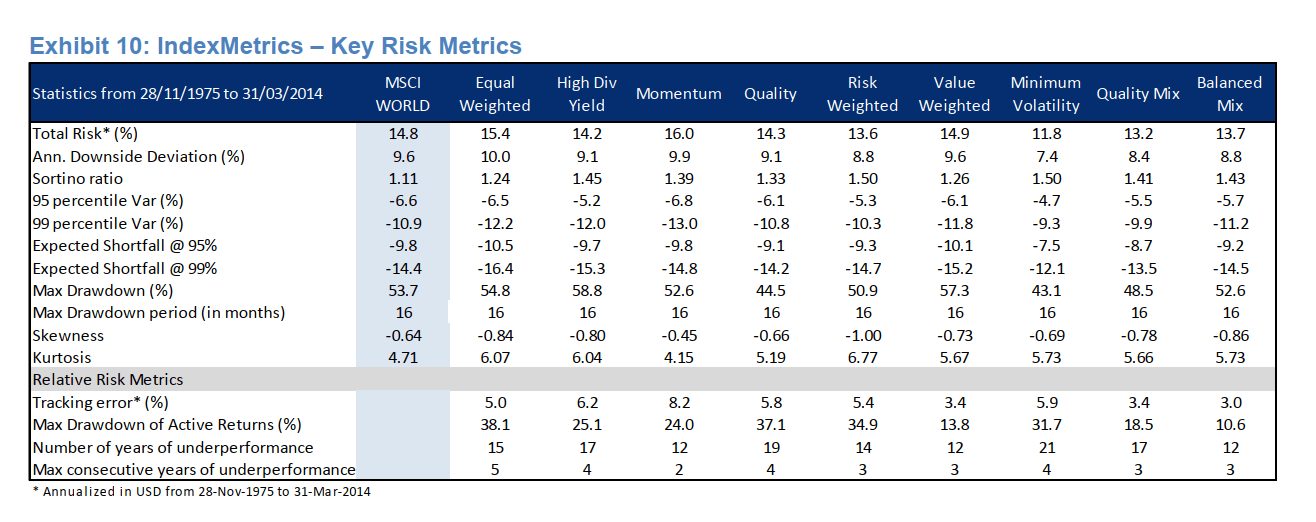
Each of the factors have their own performance cycles.
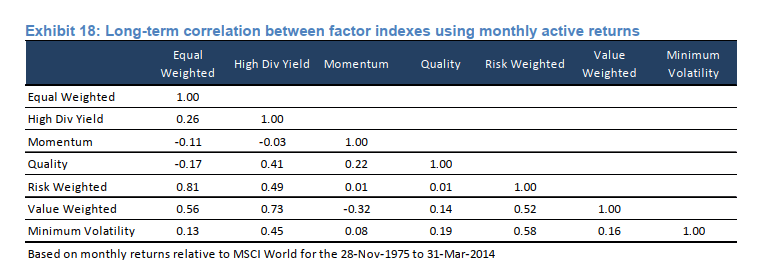
The table above shows the long-term correlation between the different factors. 1 represents two factors being exactly correlated with each other. -1 represents that two factors being exactly uncorrelated. If the correlation is closer to 0, it means two factors have a low correlation.
- Equal-weight have low correlation with most. High correlation with risk-weighted.
- High dividend yield have rather high correlation with most factors except momentum
- Momentum is the most negatively correlated or have very low correlation with most factors
- Quality have low correlation with most with the highest correlation with high divdiend yield (0.41)
- Risk weighted have higher correlation with equal-weight, value-weighted and minimum-volatility
- Value is more correlated with equal-weighted, high dividend yield and risk-weighted
- Minimum-volatility is rather uncorrelated with most except risk-weighted
Feels to me that if you wish to have the lowest correlation, it will be a combination of minimum-volatility, quality and momentum.
I feel the volatility of momentum will be counterbalanced by minimum-volatility. Minimum-volatility and quality tend to do better during market downturns, which is when momentum will do the worse. During trending markets, momentum and quality will do better than minimum-volatility.
However, these 3 factors may be less correlated but historically, they may not provide the highest return.
Traditionally, the highest return goes to value and momentum. Perhaps in the future we can developed more studies in this area.
MSCI show us a hypothetical mixture of six current factors: Value, Momentum, Equal-Weighted, Quality, High Dividend Yield and Minimum Volatility.
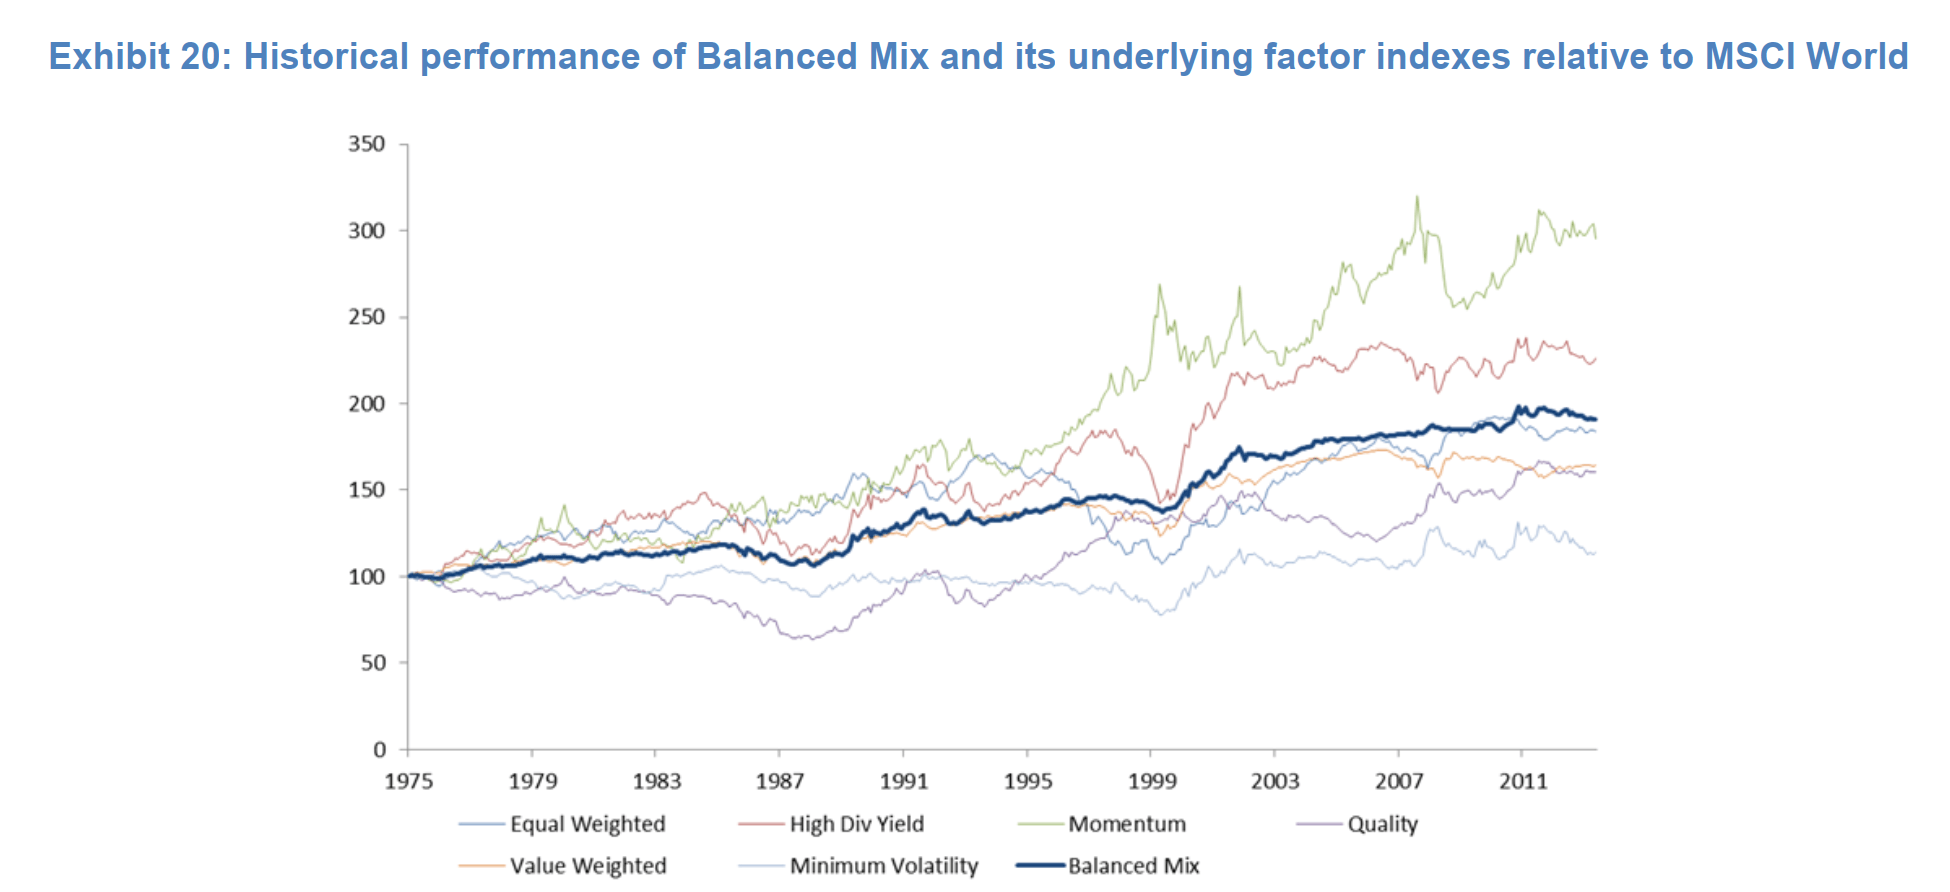
The thick blue line shows the performance of the balanced mix, which combined the six factors.
This combination takes most of the timing/selection concerns out of the investment decision by using all the factors.
- The outperformance is smoothed
- Drawdown periods are relatively short and shallow
- Exhibit lower tracking error to th eparent index
- Higher information ratio
One question that was thrown to me was: If you combined everything, then wouldn’t the performance be equal to buying an index fund?
The thick blue line above 100 shows that the combination of these factors means that there certain aspect of risks that are not explained by a market-cap weighted index fund.
Some of these factor indexes are limited to 300 stocks, and at any one time, the selection mix of some of these factor indexes may have resulted in the omission of certain poorer performing stocks. While value and momentum seemed like the opposite, we can also make a case that at some point, value stocks may have positive momentum such that those stocks get double weighted.
Investors can choose to buy a multifactor index ETF or they could pick and choose a certain combination, depending on what they wish to achieve for their portfolio.
How Each Factor Performed During Different Economic Regimes
A question on our mind is whether a manager can time these factors.
Dimensional’s research says that this is very difficult to be done. BlackRock’s research do show that if we gauge valuation of each factors (yes value each of the factors through time), relative strength and the dispersion, we may be able to time the factors well.

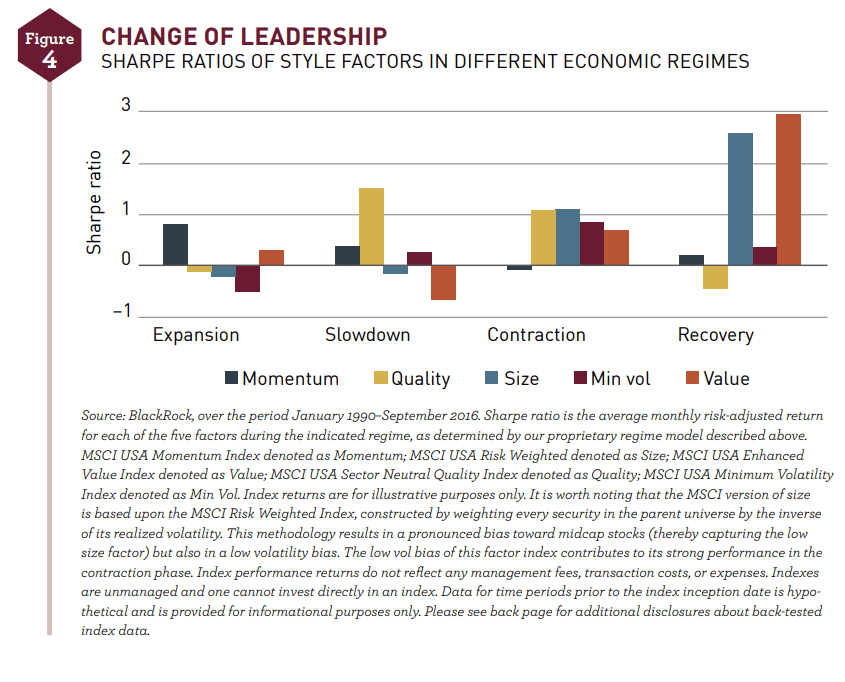
In any case, different factors tend to do better or poorly in different periods of the market cycle.
For example, more of the time, bull markets run longer than bear. The factor that did best tends to be momentum.
However, momentum usually fare the worst when emerging from a bear market. Size and value tend to do the best.
If you are more conservative and risk averse, and would like to guard against slowdown and contraction, quality and minimum volatility tend to do better during that part of the cycle.
If you wish to perform better than buy-and-hold, you will need to have a view, and live with your decision.
Factor Indexes Greatly Improves the Passive Investing Implementation
Ben Felix raised an important point.
A lot of research tries to identify factors that are able to explain market returns. This may be good in an academic sense.
However, a lot of these studies did not consider whether these factors are investable.
For instance, the Fama-French portfolios include alot of illiquid names, and do not account for a manager’s ability to short certain positions. MSCI explains that only until recently, these factors were only reasonably able to be carried out by active managers.
In the last decade, index providers were able to capture the factors in a transparent rules-based manner.
Certain improvement in the markets may have also made certain implementation possible.
For example, one of the problem with the momentum factor is the high turnover. Asset turnover increases the cost, and this will affect the returns.
However, research have show that the turnover is less of a problem if the cost of trading can be drastically improved.
Thus, lower trading fees might improve the factor ETFs ability to capture the returns.
Certain managers such as Dimensional Fund Advisors are known for their trading execution to squeeze out basis points of return compared to the trades done by others before and after their trades.
How I Would Frame Factor Investing
I thought I would pen some thoughts on how I look at factor investing:
- If I choose to invest in a broad-based index ETF or unit trust, I am choosing to take on market-risk, over risk-free rate and capture the returns in a passive manner.
- As investment tools get better, we are able to take on more independent risk factors and to capture greater returns than market returns in a passive manner.
- Capturing these factors is like how I would invest in individual stocks in the past: pick neglected stocks, pick higher dividend-yielding stocks, pick stocks that have greater momentum. This is more systematic (but may not always be better)
- Believing in factor investing is also believing enough that risks are better defined by the various factors. The better we are able to define independent risks, the better we can capture the returns.
- In the best case, we are able to capture better than index returns. In the worse case, we earn close to the index returns in the long run (based on the data)
- Investment tools such as factor indexes and exchange-traded fund houses have allowed me to delegate the filtering of these stocks, buying and selling execution, and rebalancing to an ETF provider such as BlackRock, JP Morgan and invest in a passive manner.
- Their total expense ratios are largely low enough
- If I have a view of the markets, the factor ETFs will allow me to slice and dice in a different manner.
How to Invest in Smart Beta or Factor ETFs as a Singaporean (or International investor)?
With ETFs, an investor can easily delegate the investment job to a large degree.
If you have a brokerage account that allows you to invest in major markets, then you can make use of this strategy.
For Singaporeans, I felt the most applicable markets are Singapore, the United States, Hong Kong and the London Stock Exchange.
In general, I prefer to invest in Singapore if I have the option, but currently, there aren’t a lot of factor ETFs or smart beta ETFs.
In Jan 2020, SGX acquired smart beta index specialist Scientific Beta. This indicated their ambition to do more in this area but probably in the ESG factor area (yes, ESG is supposed to be a factor)
The United States stock exchange would have listed more factor ETFs but as discussed in my Estate Taxes article, you have to consider the potential estate taxes issues if you are a buy-and-hold investor.
I hope Hong Kong develops well since they are currently estate tax favorable and have a similar climate as Singapore.
Which leaves London Stock Exchange.
On the London Stock Exchange, there are enough Irish-domiciled Smart Beta ETFs to get you started. The liquidity can be an issue and I do hope that ETF market in London develops more (although with Brexit, I am a little scared if the development will be smooth)
Here are the Factor ETFs that you can take a look.
Quality Factor
- Xtrackers MSCI World Quality Factor UCITS
- WisdomTree US Quality Dividend Growth UCITS ETF – DGRA
- iShares Edge MSCI World Quality Factor UCITS ETF – IWQU
- iShares Edge MSCI USA Quality Factor UCITS ETF – IUQA (biggest fund size)
- iShares Edge MSCI Europe Quality Factor UCITS ETF – IEQU
- Invesco FTSE RAFI Emerging Markets UCITS ETF – PSRM
- VanEck Vectors Morningstar U Wide Moat UCITS ETF
- VanEck Vectors Morningstar Global Wide Moat UCITS ETF
Momentum Factor
- iShares Edge MSCI World Momentum Factor UCITS ETF – IWMO (2.5 bil)
- iShares Edge MSCI Europe Momentum Factor UCITS ETF – IEMO
- iShares Edge MSCI USA Momentum Factor UCITS ETF – IUMO
- Xtrackers MSCI World Momentum Factor UCITS ETF – XDEM
Size Factor
- Xtrackers S&P 500 Equal Weighted UCITS ETF – XDEW (3 bil)
- iShares MSCI World Small Cap UCITS ETF – WSML (2.8 bil)
- iShares S&P SmallCap 600 UCITS ETF – IDP6 (1.1 bil)
- SPDR Russell 2000 US Small Cap UCITS ETF – R2US (1.4 bil)
- iShares MSCI USA Small Cap UCITS ETF
- iShares MSCI UK Small Cap UCITS ETF
- iShares MSCI Japan Small Cap UCITS ETF
- iShares MSCI Emerging Markets Small Cap UCITS ETF
- WisdomTree Emerging Markets SmallCap Dividend UCITS ETF
- WisdomTree Europe SmallCap Dividend UCITS ETF
Value Factor
- iShares Edge MSCI World Value Factor UCITS ETF – IWVL (3 bil)
- iShares Edge MSCI UA Value Factor UCITS ETF – IUVL (2.3 bil)
- iShares Edge MSCI Europe Value FActor UCITS ETF – IEVL (1.7 bil)
- UBS ETF MSCI USA Value UCITS ETF
- Xtrackers MSCI World Value Factor UCITS ETF
Minimum Volatility
- iShares Edge MSCI World Minimum Volatility UCITS ETF – MVOL (2.9 bil)
- iShares Edge S&P 500 Minimum Volatility UCITS ETF – MVUS (1 bil)
- iShares Edge MSCI Europe Minimum Volatility UCITS ETF – IMVU (1 bil)
- Xtrackers MSCI World Minimum Volatility UCITS ETF – XDEB
- iShares Edge MSCI EM Minimum Volatility UCITS ETF – EMMV
Multi-Factor
These are ETFs that is a combination of a few factors.
The iShares Edge ETFs is a combination of Value, Size, Quality and Momentum.
The Invesco Goldman Sachs is a combination of Low beta, Size, Value, Momentum and Quality.
- iShares Edge MSCI World Multifactor UCITS ETF – IFSW (400 mil)
- Invesco Goldman Sachs Equity Factor Index World UCITS (392 mil)
- iShares Edge MSCI USA Multifactor UCITS – IFSU
- iShares Edge MSCI Europe Multifactor UCITS – IFSE
Personally, I invest in some of these factor ETFs listed on the London Stock Exchange through Interactive Brokers.
Are Factor Investing Considered Passive or Active Management?
Philosophically, even the plain old index can be considered actively managed. Someone has to consider whether Tesla should be added to the S&P 500 and when DOW needed to replace part of Apple, what are the stocks to add to an index.

I would urge you to frame passive and active as a spectrum.
At one end, you have the index funds or ETF who are relatively passive. They sought to earn the market returns.
At the other end, are the active managers. They try to use their sophistication to identify stocks that fits into certain factors they think will do well overtime.
Factor investing sits somewhere in between.
- The systematic rules-based re-consistituion of the index and implementation makes the factor ETF more passive
- The nature of the indexes ability to tweak its methodology leans closer to active
As an investor, you can use an ETF (Whether factor ETF or index ETF) in a passive or active manner.
If you use it for speculation, you are being more active with it.
If you buy and hold a few factor ETF, you are being more passive with it.
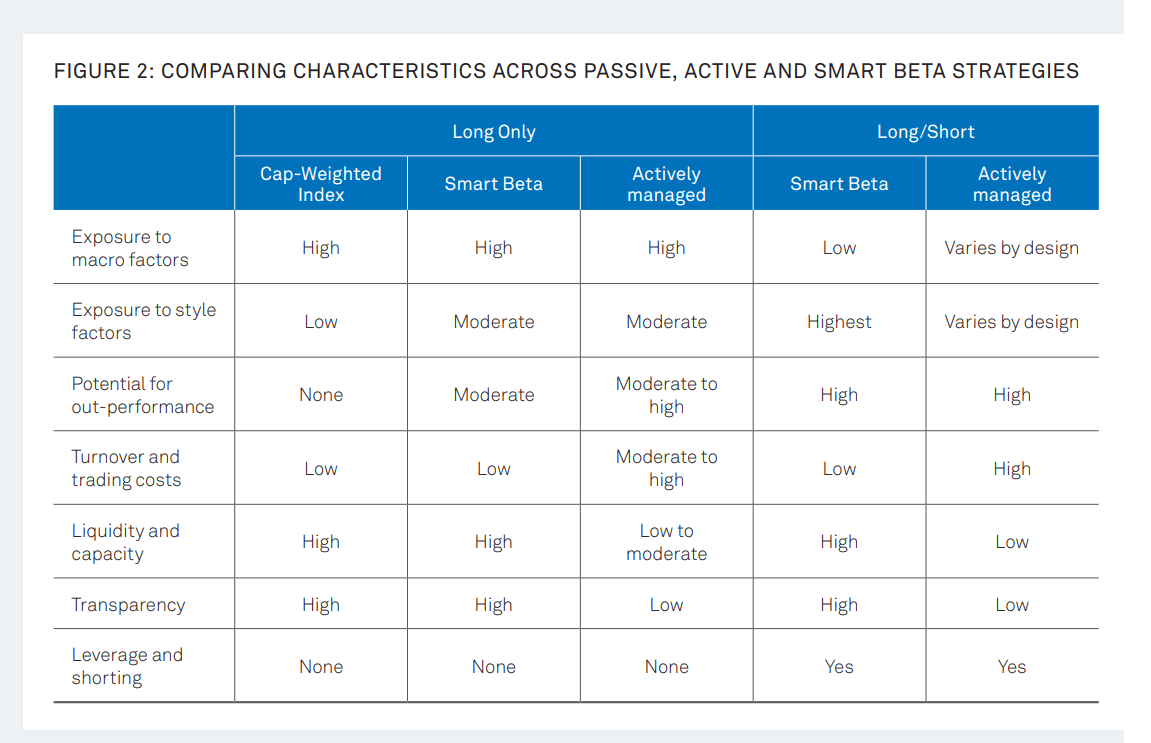
We can decompose the difference between passive index investing, actively-manage stock selection into the various aspect of consideration.
The table above gives us a pretty good break down.
Smart beta is that hybrid that sought to get exposure to macro factors, style factors while that the same time keep turnover and trading costs low, while remain very liquid and transparent.
Dimensional Fund Advisers – Are They Factor-Based Funds?
Some of you would remember my comprehensive post on Dimensional Fund Advisers (DFA) funds.
MoneyOwl and Endowus uses them.
DFA funds form Providend’s model portfolios that we use to help our accumulating and de-accumulating clients as well.
The core of DFA’s philosophy is deeply rooted in evidence-based factor investing.
However, if we assess DFA in the passive-active spectrum, they lean somewhere to the right of these factor ETFs.
Dimensional’s funds can be considered a multi-factor strategy based around the size, profitability (a different take on quality) and value factor.
On a periodic basis, DFA will assign a rank for all the stocks in a certain basket (lets say MSCI World or MSCI All-Country World) based on size, profitability and value.
They will have a shortlist of what will bobbled up to the top. Some of the stocks that sink down will have to be sold.
Instead of replicating the index, DFA’s traders have the leeway of time to execute.
During the execution, this is where momentum can be factored into the mix.
If they have a certain stock that they wish to buy, but the stock does not have positive momentum, they will hold the purchase.
If there is certain stock that is earmarked to be sold exhibit positive momentum, they would hold off the sale.
Based on the academic work, DFA also factored in the growth of investment into their selection. The research provides evidence that growth in assets on the balance sheet is negatively correlated with returns.
So that is adjusted for.
In summary, they lean close to a multifactor quantitative implementation but with a more active implementation.
In terms of bonds, they lean closer to active side, trying to capture the term and credit premium (longer duration risk and higher credit risk)
Conclusion
I think that is enough for an introduction.
I have probably discovered this too late but better late than never. I am sure there are part of factor research that I have missed out in this post, so I may correct them in future post.
If you wish to build wealth or spend down your wealth using a more diversified portfolio, I think some of these factor funds can be considered.
Let me know what you think. Which factors interest you. That may be the next factor I zoomed in, if I have the time.
I do have a few other data-driven Index ETF articles. These are suitable if you are interested in constructing a low-cost, well-diversified, passive portfolio.
You can check them out here:
- IWDA vs VWRA – Are Significant Performance Differences Between the Two Low-Cost ETFs?
- The Beauty of High Yield Bond Funds – What the Data Tells Us
- Searching for Higher Yield in Emerging Market Bonds
- The performance of investing in stocks that can Grow their Dividends for 7/10 years
- Should We Add MSCI World Small-Cap ETF (WSML) to Our Passive Portfolio?
- Review of the LionGlobal Infinity Global – A MSCI World Unit Trust Available for CPF OA Investment
- 222 Years of 60/40 Portfolio Shows Us Balanced Portfolio Corrections are Pretty Mild
- Actively managed funds versus Passive Peers Over the Longer Run – Data
- International Stocks vs the USA before 2010 – Data
- S&P 500 Index vs MSCI World Index Performance Differences Over One and Ten Year Periods – Data
Here are some supplements to sharpen your edge on low-cost, passive ETF investing:
Those who wish to set up their portfolio to capture better returns believe that certain factors such as value, size, quality, momentum and low volatility would do well over time and are willing to harvest these factors through ETFs and funds over time, here are some articles to get you started on factor investing passively:
- Introduction to factor investing / Smart Beta investing.
- IFSW – The iShares MSCI World Multi-factor ETF
- IWMO – The iShares MSCI World Momentum ETF
- GGRA – The WisdomTree Global Quality Dividend Growth UCITS ETF
- Investing in companies with strong economic moats through MOAT and GOAT.
- Robeco’s research into 151 years of Low Volatility Factor – Market returns with lower volatility that did well in different market regimes
- JPGL vs IFSW vs Dimensional Global Core vs SWDA – 22 years of 5-year and 10-year Rolling Returns Performance Comparison
- 98 Years of Data Shows the US Small Cap Value Premium over S&P 500
- 42 Years of data shows that Europe Small Cap Value premium over MSCI Europe
I invested in a diversified portfolio of exchange-traded funds (ETF) and stocks listed in the US, Hong Kong and London.
My preferred broker to trade and custodize my investments is Interactive Brokers. Interactive Brokers allow you to trade in the US, UK, Europe, Singapore, Hong Kong and many other markets. Options as well. There are no minimum monthly charges, very low forex fees for currency exchange, very low commissions for various markets.
To find out more visit Interactive Brokers today.
Join the Investment Moats Telegram channel here. I will share the materials, research, investment data, deals that I come across that enable me to run Investment Moats.


Do Like Me on Facebook. I share some tidbits that are not on the blog post there often. You can also choose to subscribe to my content via the email below.
I break down my resources according to these topics:
- Building Your Wealth Foundation – If you know and apply these simple financial concepts, your long term wealth should be pretty well managed. Find out what they are
- Active Investing – For active stock investors. My deeper thoughts from my stock investing experience
- Learning about REITs – My Free “Course” on REIT Investing for Beginners and Seasoned Investors
- Dividend Stock Tracker – Track all the common 4-10% yielding dividend stocks in SG
- Free Stock Portfolio Tracking Google Sheets that many love
- Retirement Planning, Financial Independence and Spending down money – My deep dive into how much you need to achieve these, and the different ways you can be financially free
- Providend – Where I used to work doing research. Fee-Only Advisory. No Commissions. Financial Independence Advisers and Retirement Specialists. No charge for the first meeting to understand how it works
- Havend – Where I currently work. We wish to deliver commission-based insurance advice in a better way.
Kyith is the Owner and Sole Writer behind Investment Moats. Readers tune in to Investment Moats to learn and build stronger, firmer wealth foundations, how to have a Passive investment strategy, know more about investing in REITs and the nuts and bolts of Active Investing.
Readers also follow Kyith to learn how to plan well for Financial Security and Financial Independence.
Kyith worked as an IT operations engineer from 2004 to 2019. Currently, he works as a Senior Solutions Specialist in Insurance Start-up Havend. All opinions on Investment Moats are his own and does not represent the views of Providend.
You can view Kyith's current portfolio here, which uses his Free Google Stock Portfolio Tracker.
His investment broker of choice is Interactive Brokers, which allows him to invest in securities from different exchanges all over the world, at very low commission rates, without custodian fees, near spot currency rates.
You can read more about Kyith here.
- New 6-Month Singapore T-Bill Yield in Late-April 2024 to Drop to 3.70% (for the Singaporean Savers) - April 18, 2024
- Golden Nuggets from JPMorgan Guide to Retirement 2024. - April 16, 2024
- Be Less Reliant on Banks and Build Stronger Capital Markets by Pushing for Better Shareholder Dividend and Buyback Yield - April 14, 2024
Chee Kiang
Monday 22nd of February 2021
Hi Kyith,
Many London based ETFs are very low volume, just like SGX ETFs. How do you over come this? Thanks.
Chee Kiang
Thursday 25th of February 2021
@retirewithfi, Kyith, thanks for sharing
retirewithfi
Thursday 25th of February 2021
@Chee Kiang,
You can take a look at https://www.etf.com/etf-education-center/etf-basics/understanding-etf-liquidity For ETFs, the market makers and authorized participants are there to ensure liquidity. So long the ETF is tracking an index where the underlying constituents have sufficient liquidity, it shouldn't be a problem.
Kyith
Monday 22nd of February 2021
Hi Chee Kiang, either we live with the low volatility or pick those that have higher volatility. Usually, they happen to be the ones with higher AUM. At least that is what I do.