Measuring the performance of your investments can be a big headache for some of you.
This is because most financial institutions don’t help you accurately compute the returns of the investments you have with them. Many private bank statements only show you simple returns, which is the gain on the cost of your investments with them.
Some financial institutions cannot even compute the cost of your investments correctly!
Although you pay good money to a private bank for the assortment of banking services, aggregating accounts that are not with them to have a holistic financial view is not one of the services provided.
Sometimes, we have difficulty reviewing prospects or clients’ investments with other banks because the investments were separated in disparate accounts, and there were no overall money-weighted or time-weighted returns (Find out the difference between money-wegithed and time-weighted returns).
That is why many of us have to create our very own spreadsheets and aggregate investments all over the place in one place.
If you use Interactive Brokers as your investment trading platform, you do not have this issue because they can show your returns in either Time Weighted or Money Weighted.
Interactive Brokers have a comprehensive reporting view called PortfolioAnalyst, which can slice and dice your investments in a way I have not seen in any local or overseas brokers, Robo-advisers, or private or retail banks.
If you pair this comprehensive performance report with:
- Access to a large number of worldwide stock exchanges.
- Trade with meagre cost commission.
- Change between different currencies at the near-spot rate and US$2 per transaction.
- No monthly minimum access fee.
This makes Interactive Brokers a platform you should check out.
If you have not taken a look at PortfolioAnalyst, in today’s article, I will roughly show what you can find in the reports, the degree of customization.
And how to configure Interactive Brokers to automate the delivery of this influential report!
What Are the Financial Data That You Can Review in the PortfolioAnalyst Report
First, let me briefly show what you can find in a standard, detailed PortfolioAnalyst report by default.
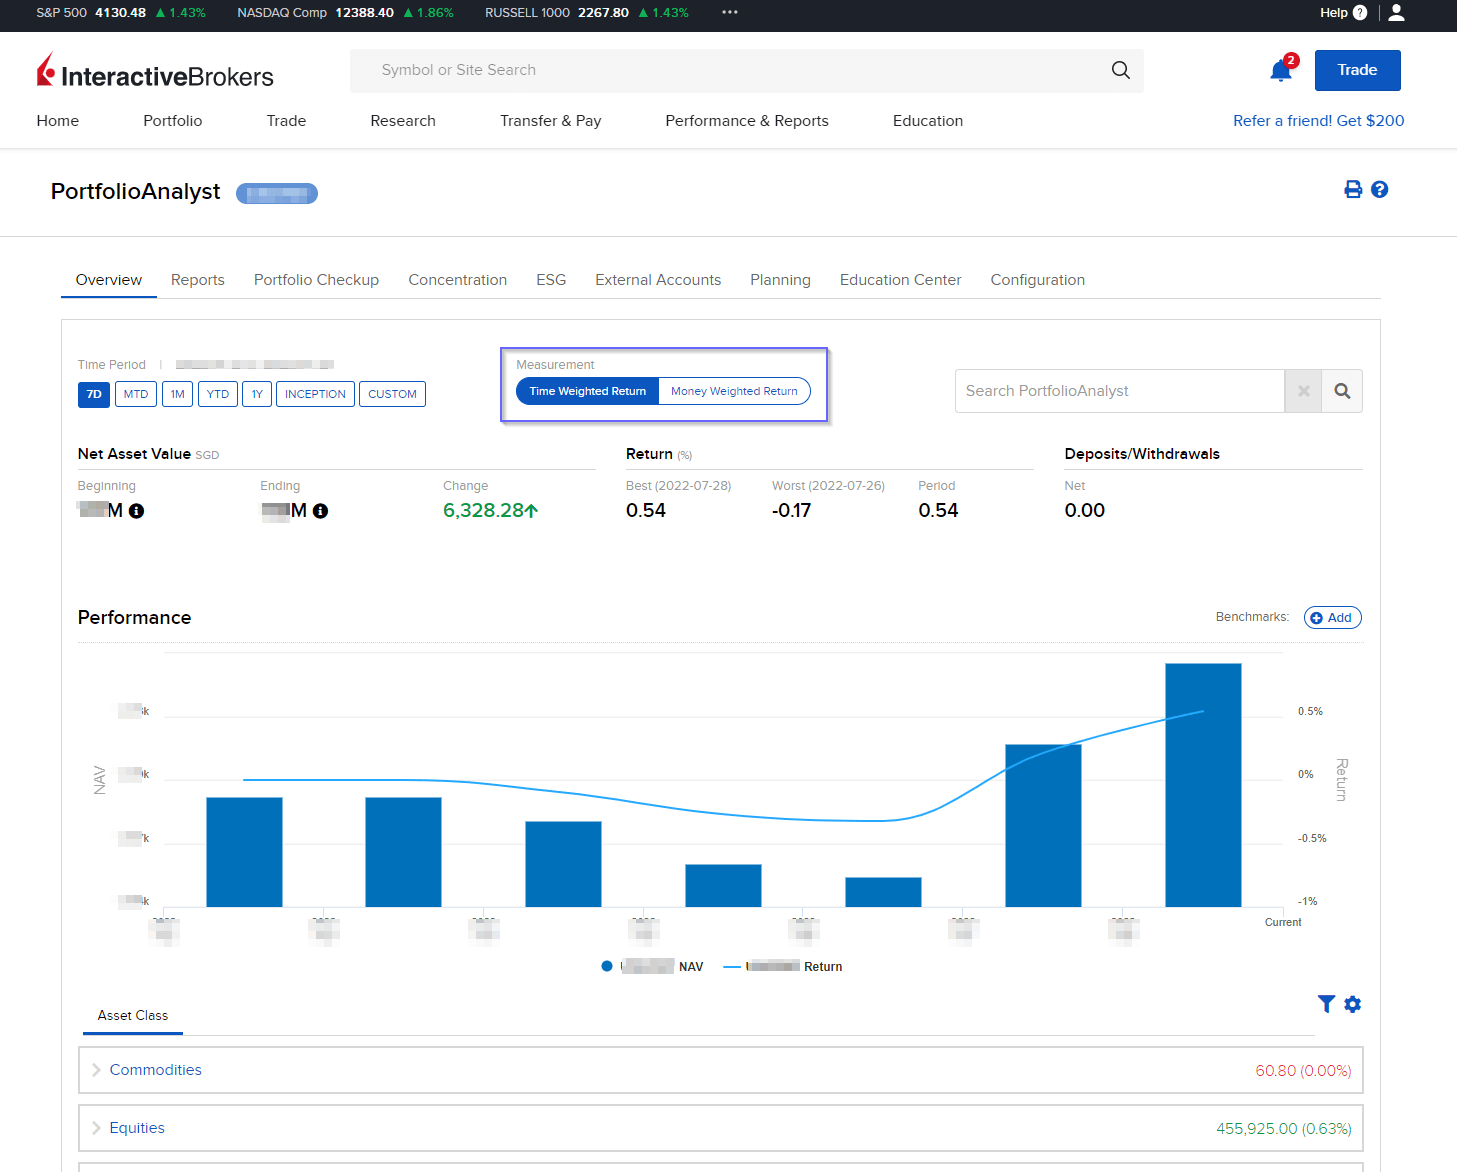
Account Overview

Account overview will provide you with a summary of the performance of various accounts over time. You will see the growth in the value of accounts and the returns over the various time frames.
I don’t think there is a lot of value in the summary screen as an Interactive Broker client would often check this information frequently on his or her mobile applications.
Historical Performance versus the Benchmarks
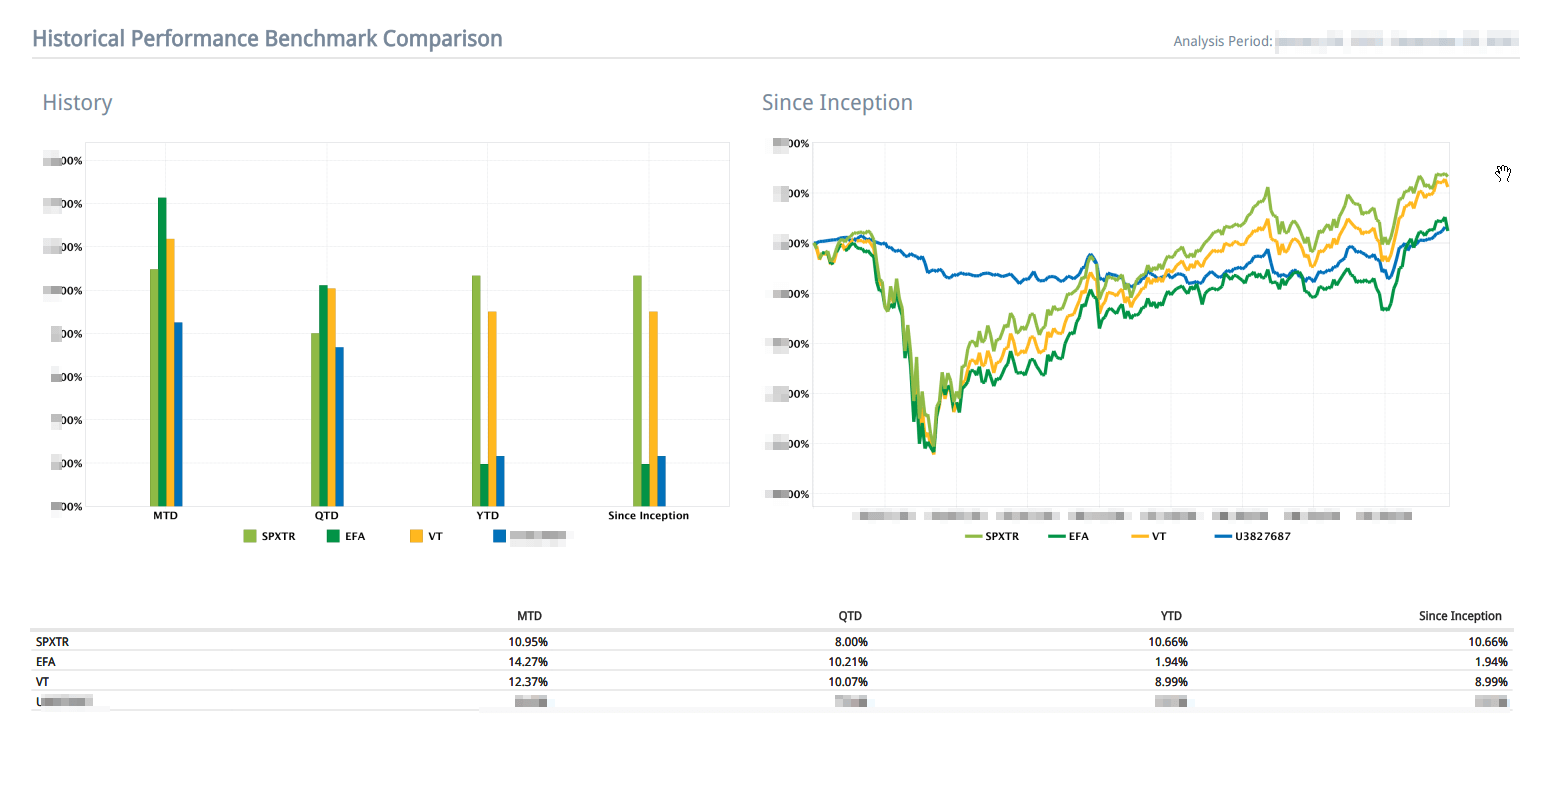
The PortfolioAnalyst report will show account performance versus standard ETF benchmarks. The default is the S&P 500 (SPXTR), iShares MSCI EAFE (EFA), which covers 21 developed countries in Europe, Australasia, and the Middle East and the Vanguard Total World Stock ETF (VT), which covers the large, mid and small-cap stocks in developed and emerging markets.
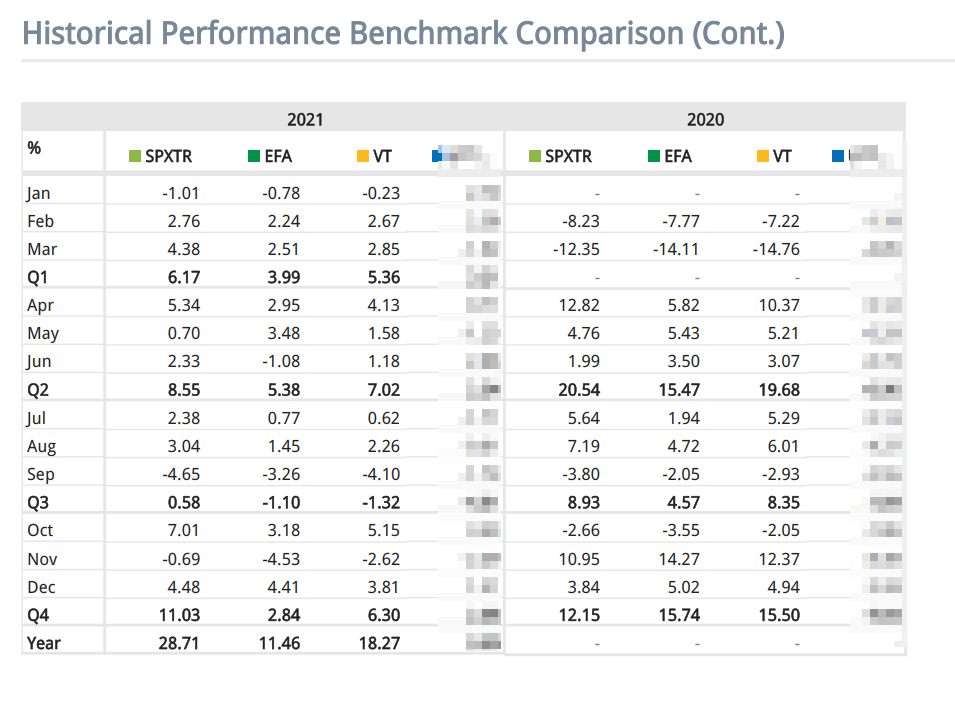
PortfolioAnalyst can also provide the performance comparison month by month over different years, just like boutique funds present month-by-month results.
Level of Concentration
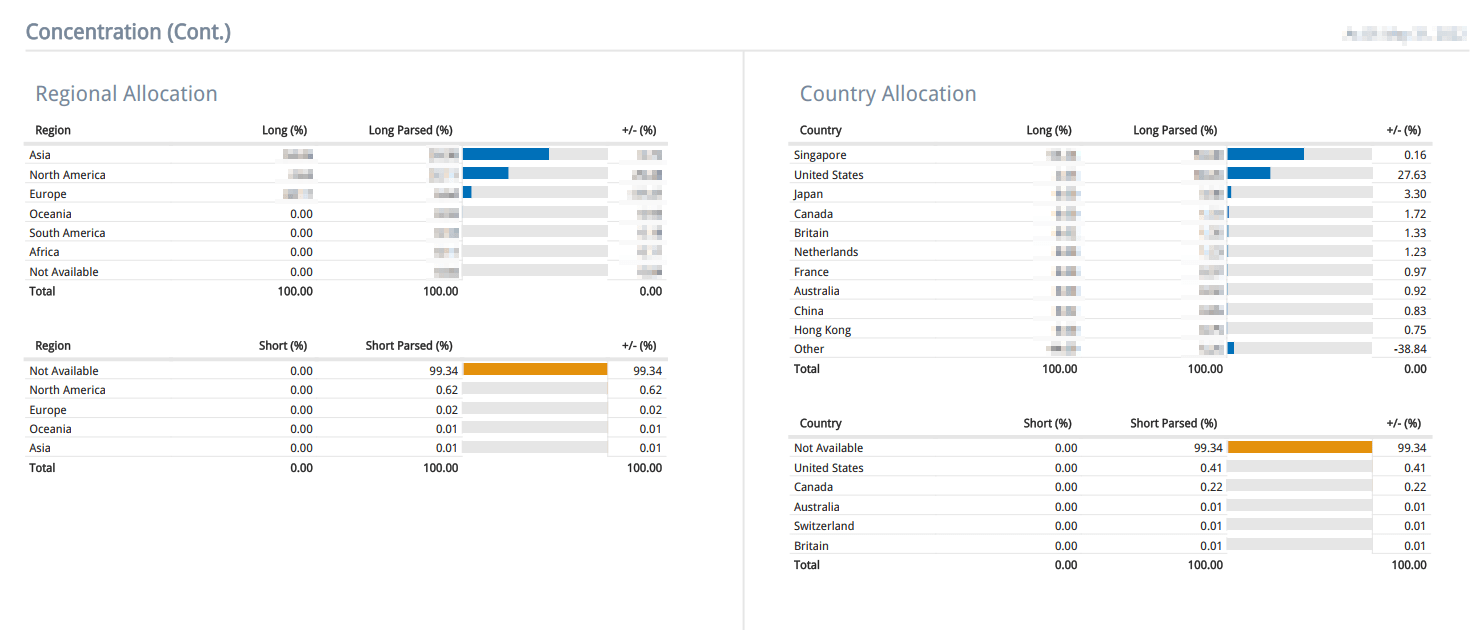
The level of concentration is less valuable because, for most of us, it will show where we are invested in various accounts. So if most of your money is in cash, your money will be in your home country. If you are invested in a London Stock Exchange, then your money will be in Europe.
ESG Summary

Investors nowadays are concerned about the impact of the companies they invest in.
Interactive Broker‘s PortfolioAnalyst report can aggregate the holdings’ ESG score. Each of your holdings has an individual ESG score, making it possible to create an ESG profile of your portfolio.
Risk Analysis

Investors will face additional work if they wish to know the risk-adjusted return of their portfolio compared to the various benchmarks.
They will also need to know how to calculate these financial ratios and figures.
This is where Interactive Brokers PortfolioAnalyst can add a lot of value.
Projected Income
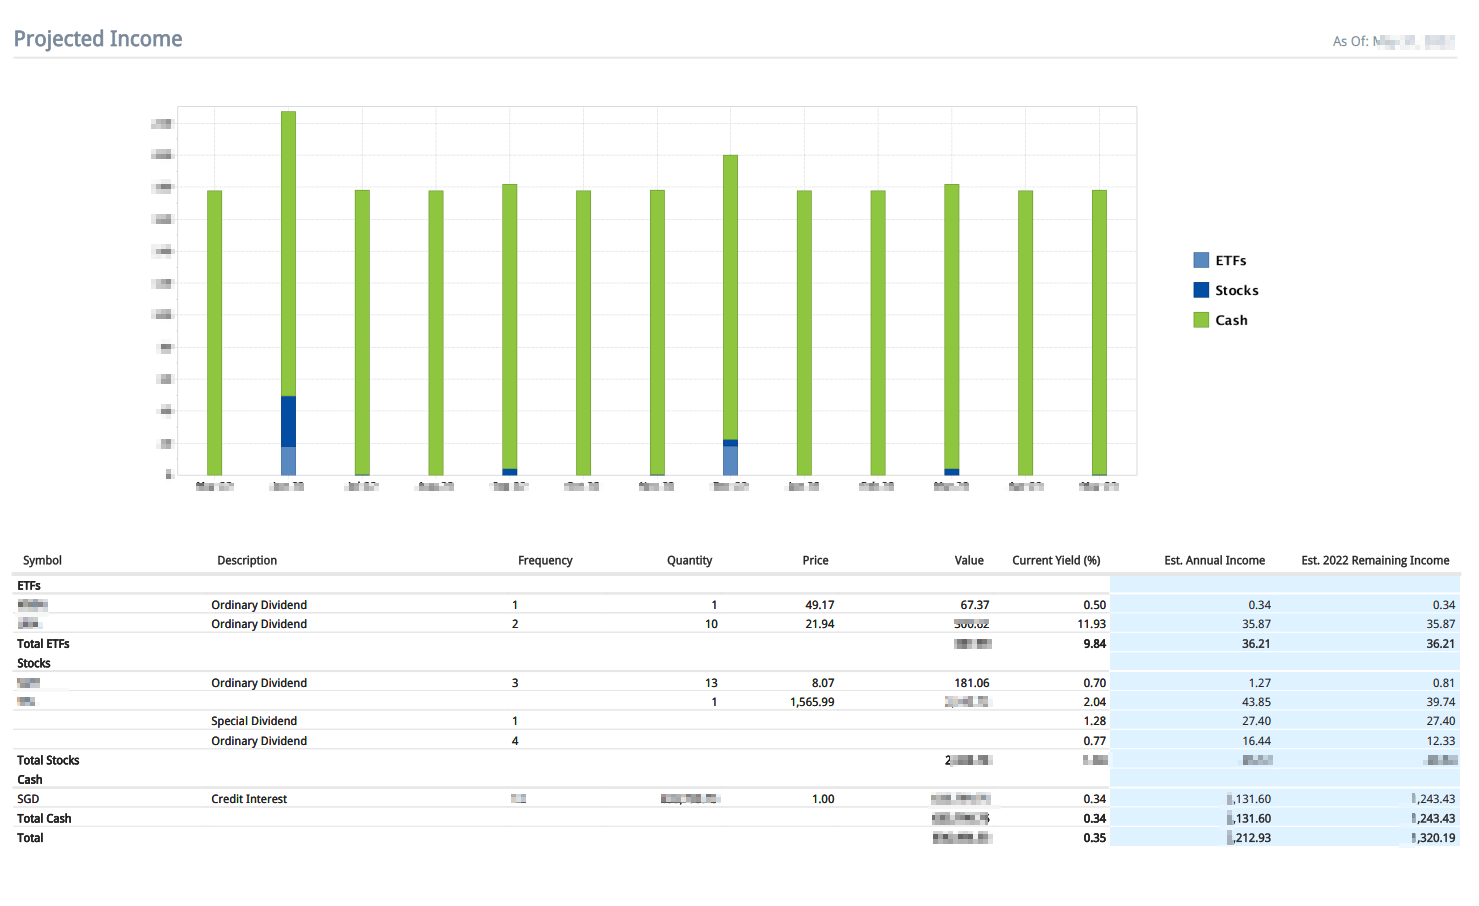
Dividend-focused investors would be interested to know their distribution frequency and the income received during the period.
PortfolioAnalyst can estimate your forecasted annual income.
Interest and Fees

PortfolioAnalyst can provide us with a summary of the cost incurred for the period.
How to Have A Detailed PortfolioAnalyst Report Delivered to Your Email
I have shown how detailed and valuable the PortfolioAnalyst report is, and it will be beneficial to have it delivered to you periodically.
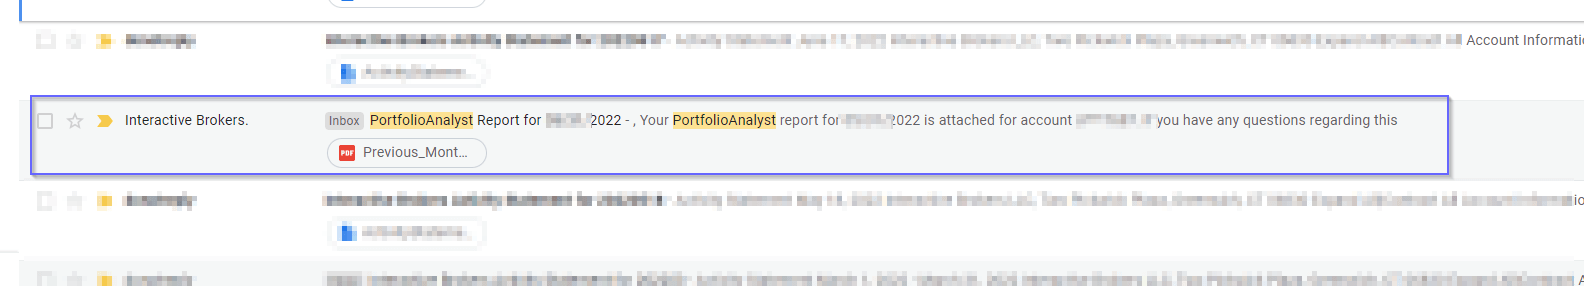
I set Interactive Brokers to deliver the report to me at the end of the month. Usually, the report will be delivered to my email around the 3rd of the month.
Here are the instructions to configure Interactive Brokers to deliver the report.
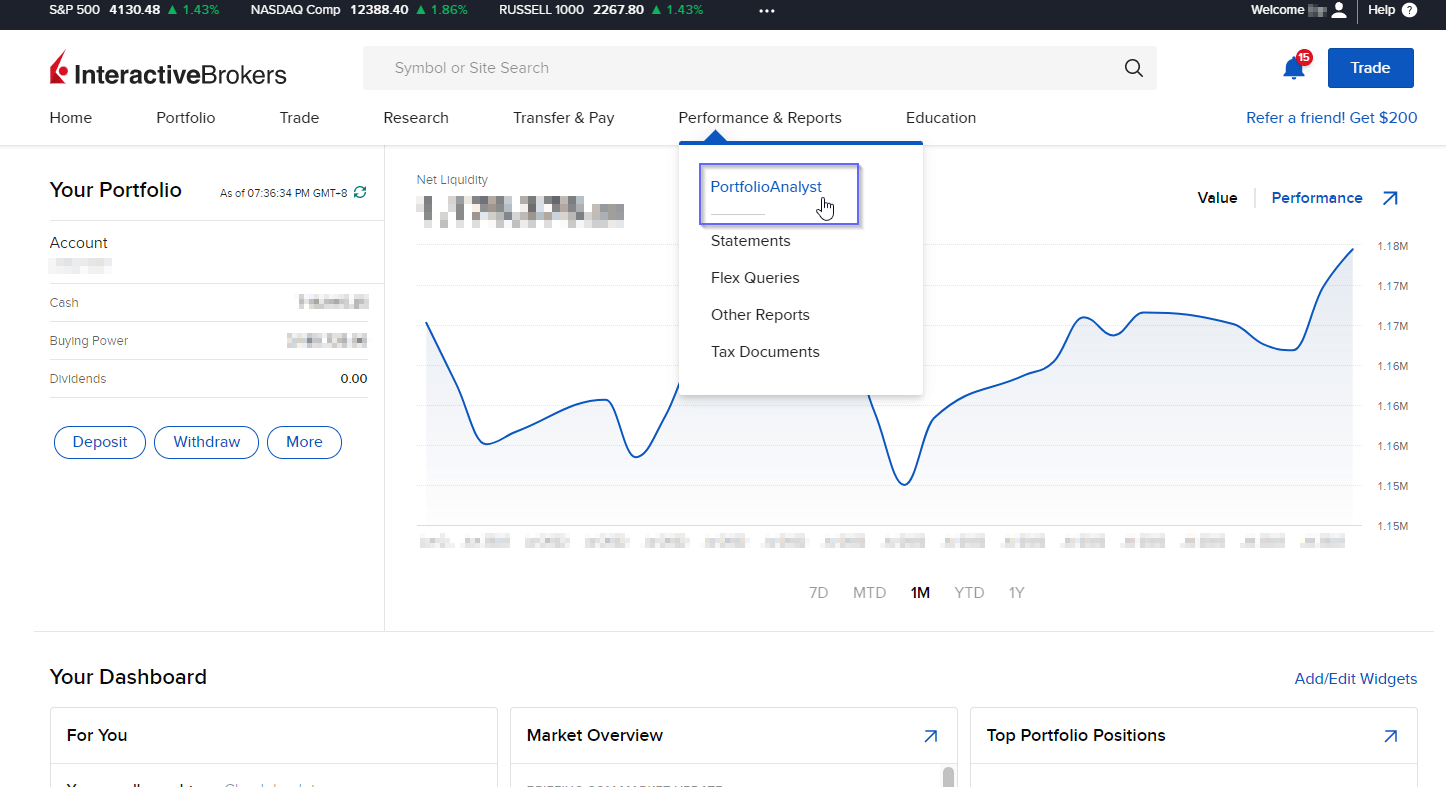
Login to Interactive Brokers on your desktop. Go to Performance & Reports and select PortfolioAnalyst.
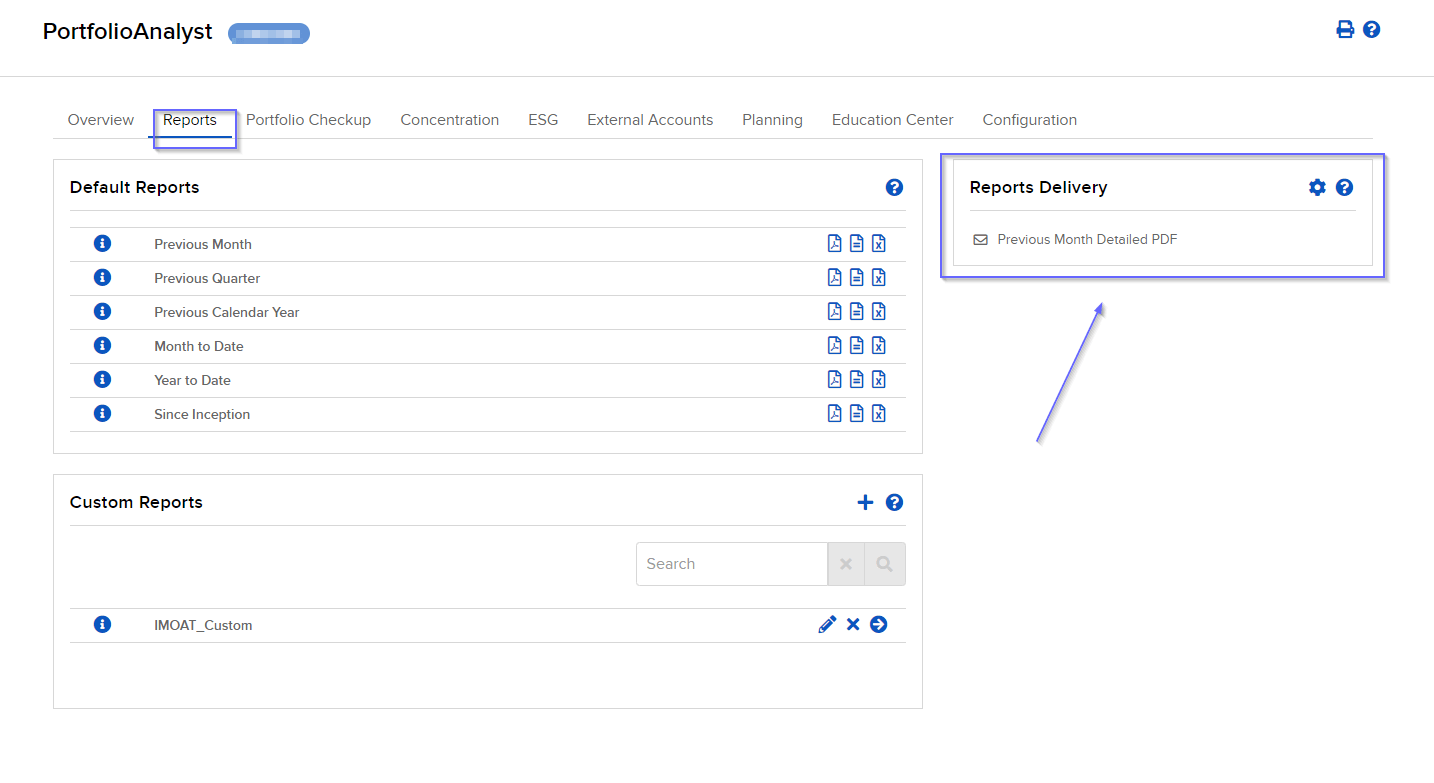
If you click on the Reports tab, you can generate different sections of the PortfolioAnalyst report shown previously.
On the right side, there is a Reports Delivery. Click on the gear icon.

At this screen, you can configure what to deliver to you. Keep the delivery method to Email. In this instance, I only choose to provide the previous month’s performance. The detailed PDF report was selected.
You can choose a year-to-date or since-inception report.
In the screenshot above, you can observe an IMOAT_Custom. This is a custom report, and you can also configure the report to be delivered to you.
If you follow through with the instructions, you can successfully set up the report delivery.
How to Create a Custom PortfolioAnalyst Report
You can configure Interactive Brokers to deliver only your desired sections of the PortfolioAnalyst report.
Under Reports in the Custom Reports section, click on the Plus icon.

This screen will appear.
You can specify the report name, which period you wish to report, and the frequency of delivery. In this example, the report will be delivered monthly and will be a detailed PDF report, where the performance is measured on a money-weighted basis (IRR) instead of a time-weighted return.
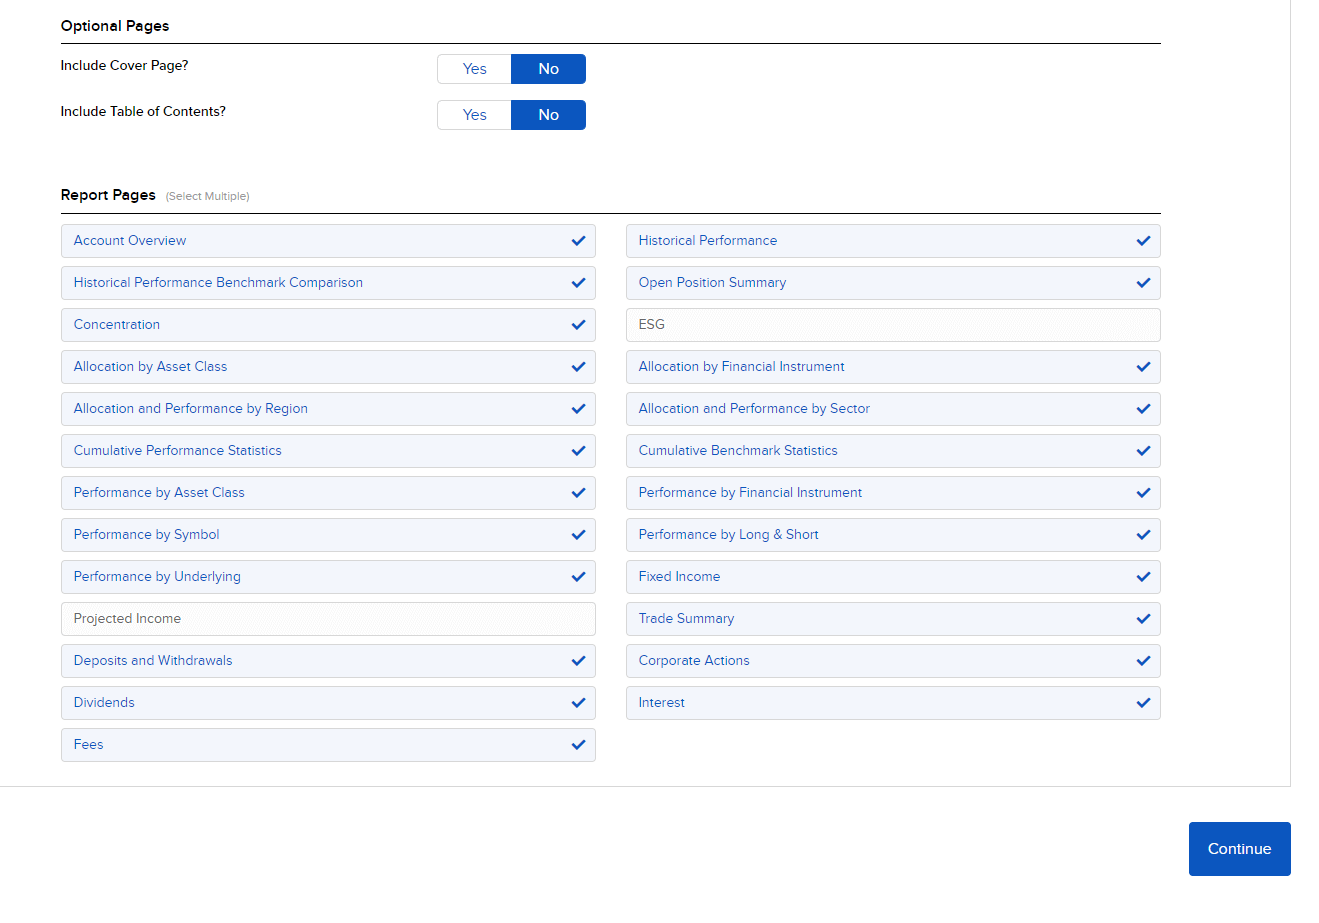
Next, you can configure the report sections you wish to include. The screenshot above shows the available options. You might need to do some trial and error.
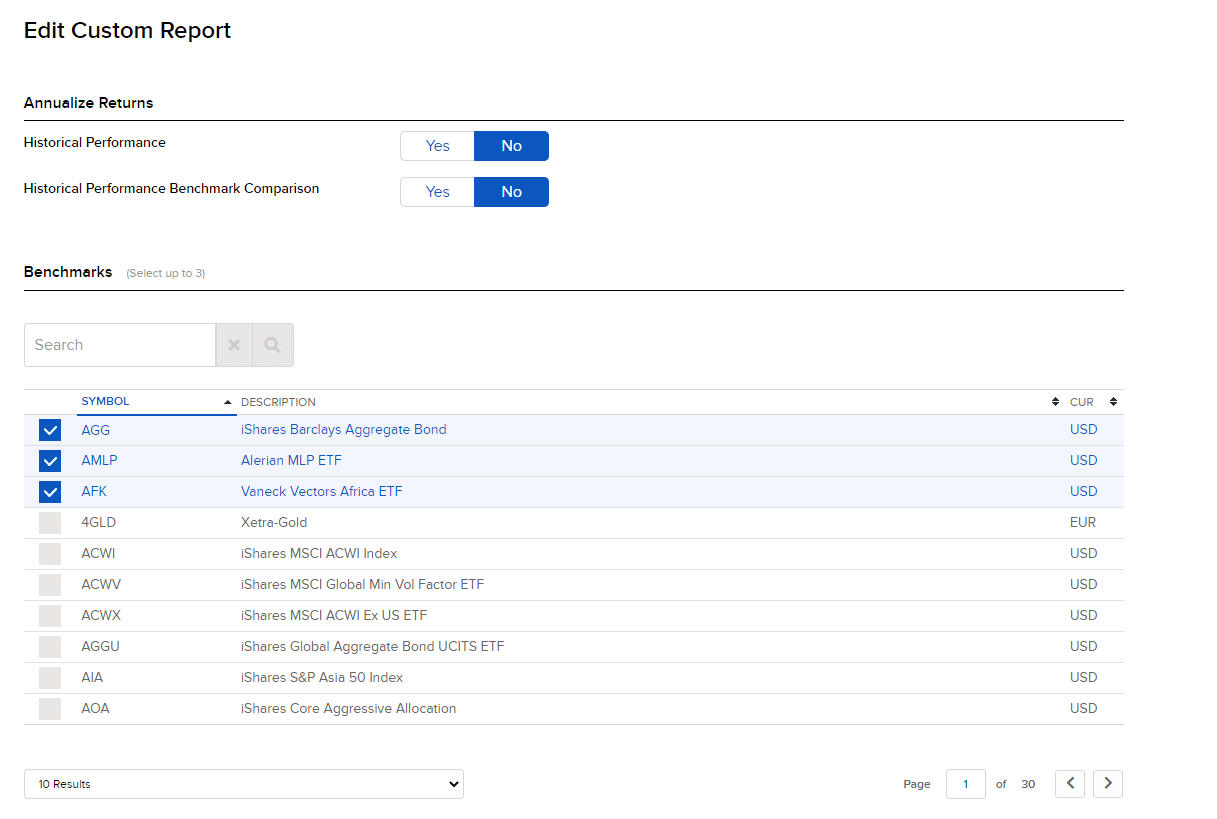
Lastly, you can select the benchmarks to measure your portfolio against. In this case, I choose three different ETFs as benchmarks. You can also set an aggregate custom benchmark created by you previously (we will show you how to make it later).
If you go through with this, you will successfully create a custom report.
You can immediately generate a PDF report.
You may also set Interactive Brokers to deliver the report periodically (through the instructions in the previous section).
How to Create A Custom Benchmark to Measure Your Account Performance Against
If you prefer to hold a 60% equity and 40% bond allocation, measuring against a 100% equity index might not be meaningful.
You can create a custom benchmark to measure your performance against.
Here is how we do it.

Go to the Configuration tab and select Configure Custom Benchmarks.
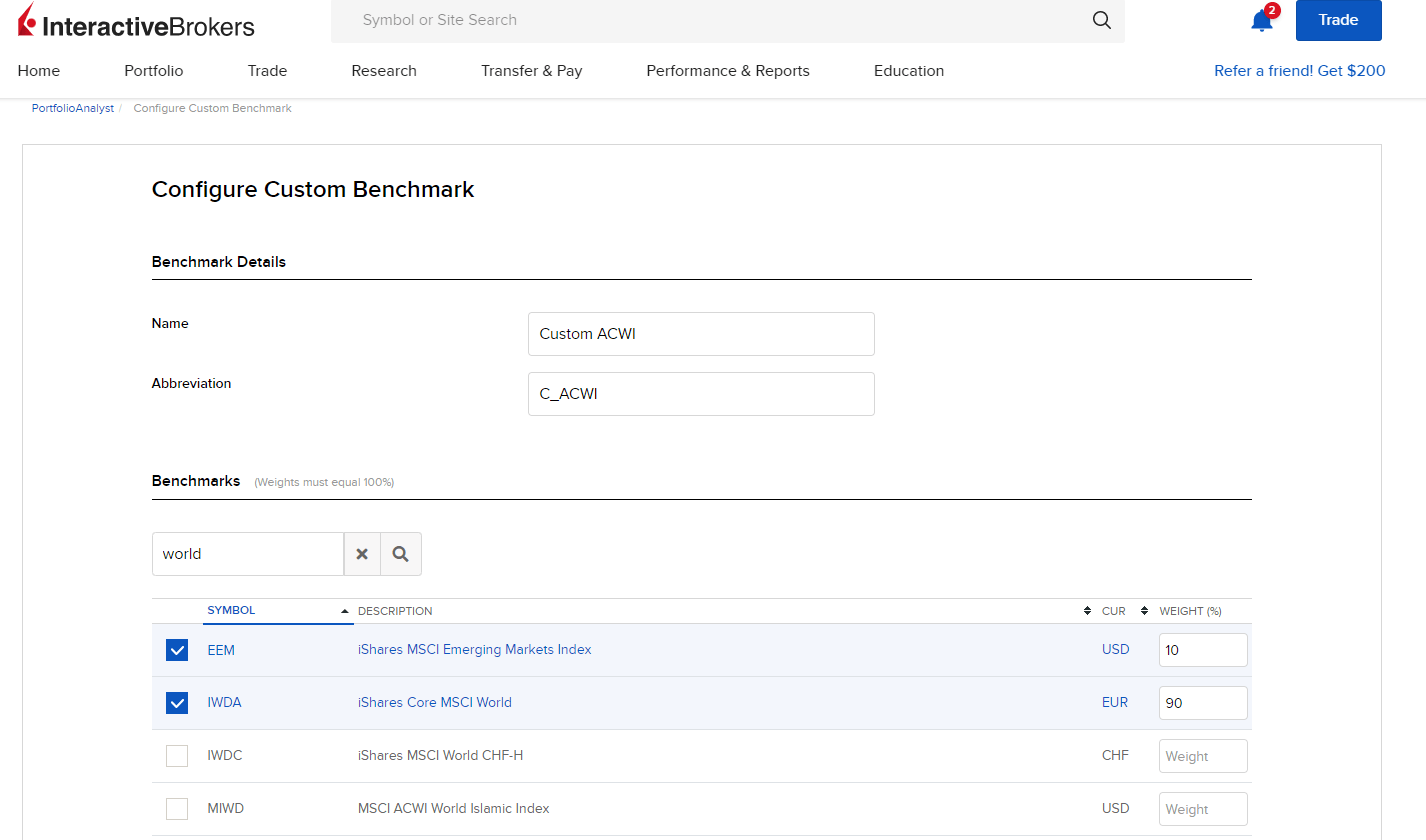
Enter an appropriate name for your custom benchmark and under Benchmarks, you can select a group of ETFs to create a custom benchmark of an allocation you prefer.

This benchmark will only appear in Custom Reports and not the default reports. Once successfully creating the custom benchmark, you can select the benchmark in the custom report (shown in the previous section).
How to Link External Accounts to PortfolioAnalyst
You may dream of having a consolidated view of your financial life. PortfolioAnalyst allows you to import external data from other platforms to create your holistic financial view.
Go to the External Accounts tab.
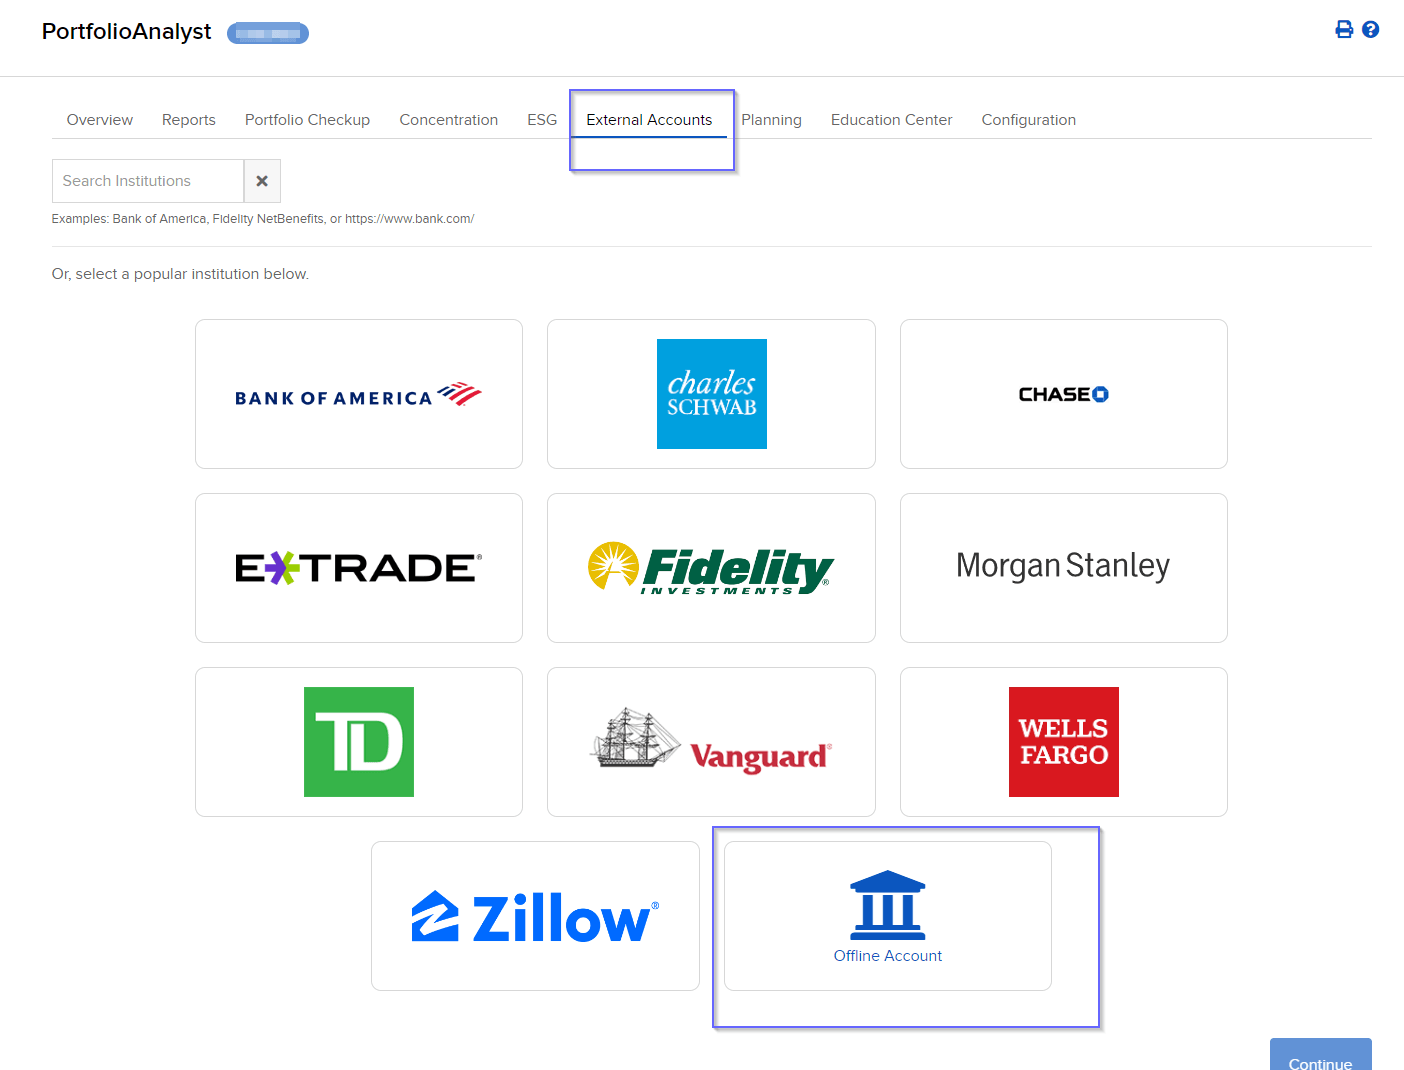
US or Singapore investors with TD Ameritrade or ETrade accounts can link to their accounts to import the data seamlessly.
You may need to select Offline Account to import the data manually for local Singaporeans.
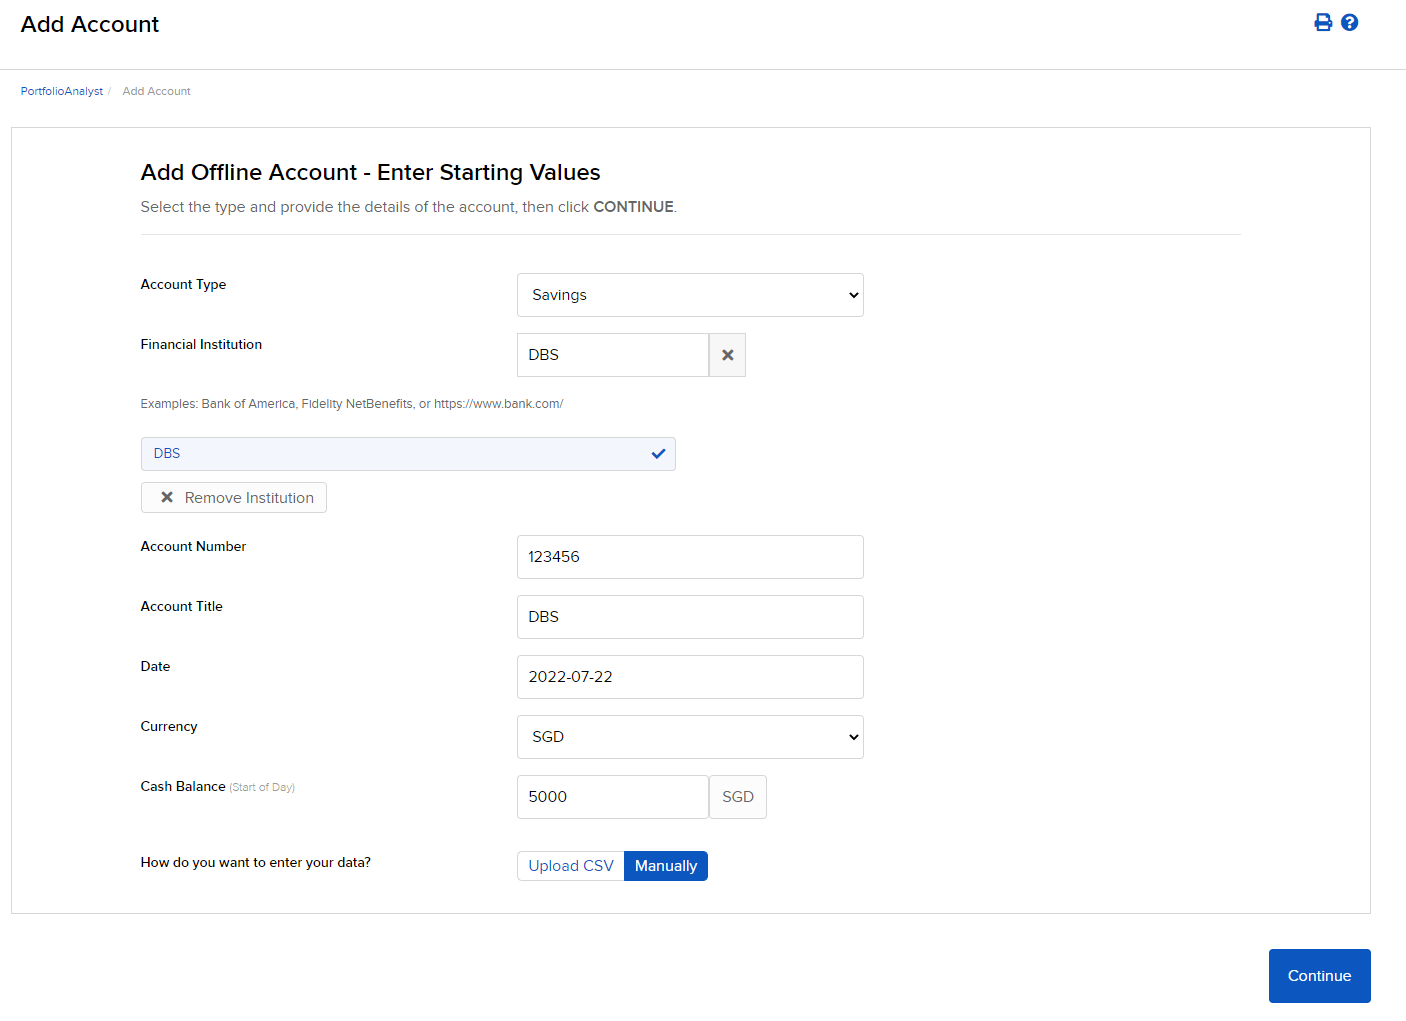
I selected Savings account from DBS and had to key in the details as shown in the screenshot manually.
We have the option to upload a CSV (if your financial institution provides that) or manually.
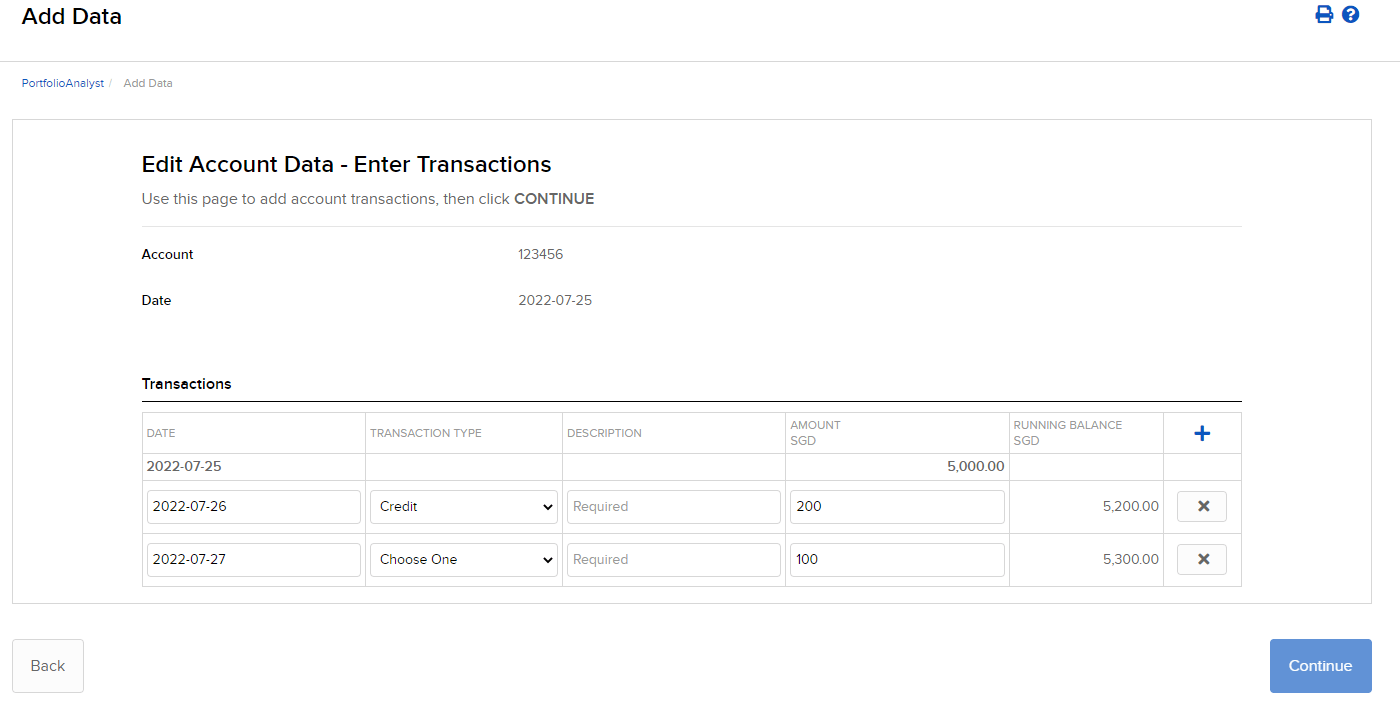
If you choose Manually, you can update your transactions manually.
Over time, you need to update the transactions regularly to ensure that your reports stay relevant.
If You Need To Know Your Exact Transactions…
The PortfolioAnalyst report is not the right report for that.
You need to generate a custom statement that will be sent to your email periodically (every month). The report consists of your transactions, cost, and more information, such as the taxes withheld on your dividends.
In this article, I explain how do you create a custom report and automate sending the report to your email periodically.
Conclusion
Unlike other brokers, Interactive Brokers can empower your performance reporting greatly with PortfolioAnalyst.
You can generate some reports other than PortfolioAnalyst reports, and I will show you in another post.
They give us enough granular control so that you do not need to log in to the Interactive Brokers so often just to assess performance.
PortfolioAnalyst is a vital feature that allows you to trade at a very low-cost commission, access to numerous markets, near spot currency conversion and no monthly minimum maintenance fee.
My Comprehensive Interactive Brokers How-to Guides
Interactive Brokers is a great low-cost, financially strong brokerage platform that can be the standard broker for holding your long-term investments. You can access 150 global exchanges, including exchanges such as Singapore, the US, Hong Kong, London, European and Canada.
You will enjoy cheap commissions and zero minimum recurring platform fees or maintenance fees. Convert your funds to different currencies at near-spot rates, paying a flat US$2 fee.
To get started or become familiar with Interactive Brokers, check out my past articles on how to invest with Interactive Brokers. I hope the guides make your life and investing experience easier and brighter.
An Easy Step-By-Step Guide to Setup Interactive Brokers (IBKR)
How to Fund & Withdraw Funds from Your Interactive Brokers Account
How to Convert Currencies in Interactive Brokers
How to Buy and Sell Stocks and Securities on Interactive Brokers
How Competitive are Interactive Brokers Commissions Pricing?
How Safe is it to Custodized Your Money at Interactive Brokers? The things they do better than other brokers.
How Safe is it to Custodized Your Money at Interactive Brokers (2)? Financial strength of IB during recent banking crisis and during Great Financial Crisis
Interactive Brokers have Eliminated the US$10 monthly inactivity fee. More details here.
How to Transfer your shares from Standard Chartered Online Trading to Interactive Brokers
How to trade after-hours and premarket
Create Customized Reports and automatically send them to your email
What is the PortfolioAnalyst Report and Automatically Send the PortfolioAnalyst Report to Your Email
Send Money from TransferWise to Interactive Brokers
Interactive Brokers’ Fluid Interest Income on Cash
Introducing IMPACT by Interactive Brokers
Kyith is the Owner and Sole Writer behind Investment Moats. Readers tune in to Investment Moats to learn and build stronger, firmer wealth foundations, how to have a Passive investment strategy, know more about investing in REITs and the nuts and bolts of Active Investing.
Readers also follow Kyith to learn how to plan well for Financial Security and Financial Independence.
Kyith worked as an IT operations engineer from 2004 to 2019. Currently, he works as a Senior Solutions Specialist in Insurance Start-up Havend. All opinions on Investment Moats are his own and does not represent the views of Providend.
You can view Kyith's current portfolio here, which uses his Free Google Stock Portfolio Tracker.
His investment broker of choice is Interactive Brokers, which allows him to invest in securities from different exchanges all over the world, at very low commission rates, without custodian fees, near spot currency rates.
You can read more about Kyith here.
- Golden Nuggets from JPMorgan Guide to Retirement 2024. - April 16, 2024
- Be Less Reliant on Banks and Build Stronger Capital Markets by Pushing for Better Shareholder Dividend and Buyback Yield - April 14, 2024
- The LionGlobal APAC Financials Dividend Plus ETF Won’t Give Singapore Investors 5% Dividend Yield Always. Further personal thoughts (with some data). - April 13, 2024