When it comes to bonds, many investors still believe in owning individual bonds till maturity.
It feels more right in that firstly you do not suffer from capital losses if you held the bond to maturity and secondly you get predictable coupon returns that was promised to you at the start.
Unfortunately, the investors ran into some problems:
- They demanded a certain respectable interest yield on their bonds. If it is too low, they find that it is unattractive and would not go for it.
- They need to reinvest into another bond after the previous one matures. This maturity period may take place anytime.
- Prefers bonds in local currency
- For some, they might not have enough capital to diversify (traditionally the minimum you need to purchase bonds is $250,000)
With these requirements, what tends to happen is that these investors push themselves up the risk spectrum.
When they push themselves up the risk spectrum, they take on more geographical risk, currency risk, default risk, duration risk.
But in their mind, these bonds are as safe as a high quality government bonds.
There is a mismatch in expectations and some investors learn the hard way that the risk of these bonds defaulting and not getting 100% of their principal back is real.
I think it is challenging to recommend people to purchase these bonds on the higher yield spectrum unless you have a competent adviser or fund manager. A competent one would know the ins and outs to not just select the bonds to invest, but to sell or trade out to another bond in certain favorable and unfavorable circumstances.
What if We Invest in a Basket of High Yield Bonds?
We don’t recommend investing in individual high yield bonds but what if Kyith have $100 million and can buy a portfolio of high yield bonds?
That was something that crossed my mind last year. How would such a portfolio do?
So I decide to take a look at some of the data.
As an investor, you can invest in exchange traded funds (ETF) that tracks certain global or United States high yield bond indexes.
If we wish to gain exposure to a global high yield ETF that have less estate duty/inheritance tax complication, the iShares $ High Yield Corp Bond UCITS ETF (IHYA) listed on the London Stock Exchange may fit the bill.
This is a US$6 billion ETF with 0.50% expense ratio that tracks the Markit iBoxx USD Liquid High Yield Capped Index.
The IHYU share class was only launched in 2017 but the distributing share class SHYU was launched in 2011.
Unfortunately, I do not have the data for the Markit iBoxx High Yield index. So I got to make use of the Bloomberg Barclays Global High Yield Total Return Index.
This index represents the union of US High yield, the Pan-European HIgh Yield and Emerging Markets Hard Currency High Yield Indices.
I was able to get my hands on 29 calendar yars of global high yield returns.
Here are some current parameters for the index:
- Yield to Worst: 6.51%
- Time to Maturity: 6.85 years
- Number of bonds on index: 3651
Compounded Average Growth
I baked in a 0.50% expense ratio into the index.
From 1990 to Jun 2020 (31 years), the compounded average growth of the BB High Yield index is 8.4% a year.
$1 in 1990 grow to $12 after 31 years.
Indeed the returns tend to be quite equity-like.
Some investors may wonder whether with interest rates getting lower and lower, the 8.4% is very much skewed by better performance before 2000s.
I think the short term interest rates has an influence over high yield bonds, but there are other factors that have influence over high yield bond performance as well.
There are risks of default, liquidity risks.
With more risks, we hope that we can be compensated well to take on the risk.
Let us dissect the compounded average growth:
| CAGR | $1 Growth | |
| 1990 to 2020 | 8.4% | $12 |
| 1990 to 1999 | 11.3% | $2.92 |
| 2000 to 2009 | 8.1% | $2.17 |
| 2009 to 2020 | 5.9% | $1.82 |
From the compounded growth breakdown, we observe that either the falling interest has a profound impact on high yield bond returns, or that in the quest for higher yield, demand for high yield bonds relative to other bonds is higher.
I have no way to prove the latter.
In terms of the growth of $1, the absolute return difference between 8.1% and 6.3% looks less significant. But the difference of 3% between 11.3% and 8.1% look huge!
Here is the BB High Yield Index vs the MSCI World Index with Gross Dividends:
| BB High Yield Index | MSCI World | |
| 1990 to 2020 | 8.4% | 6.9% |
| 1990 to 1999 | 11.3% | 12.0% |
| 2000 to 2009 | 8.1% | 0.2% |
| 2009 to 2020 | 5.9% | 8.8% |
In short, the returns of the global high yield index was able to give you equity like returns.
2000 to 2009 was the period where the United States, which formed 50% of the MSCI World, did poorly.
This would also be the period that I may investigate further how well a retiree would do if they have invest in a BB High Yield Index instead.
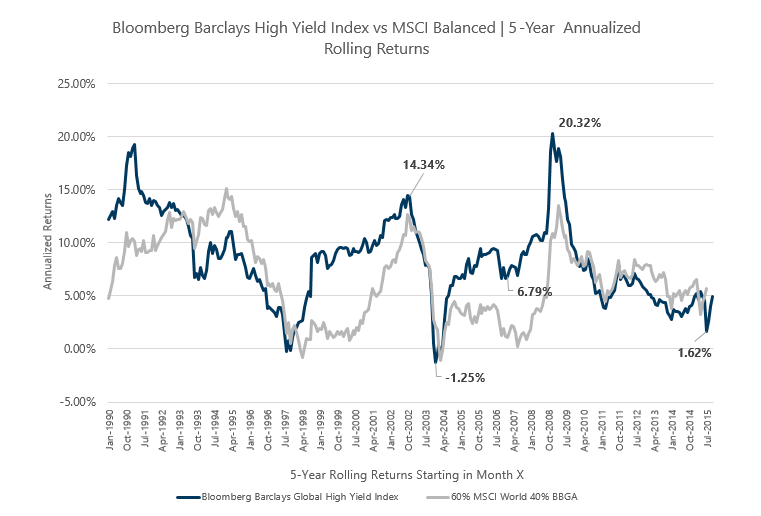
Bloomberg Barclays Global High Yield 5-Year Rolling Returns
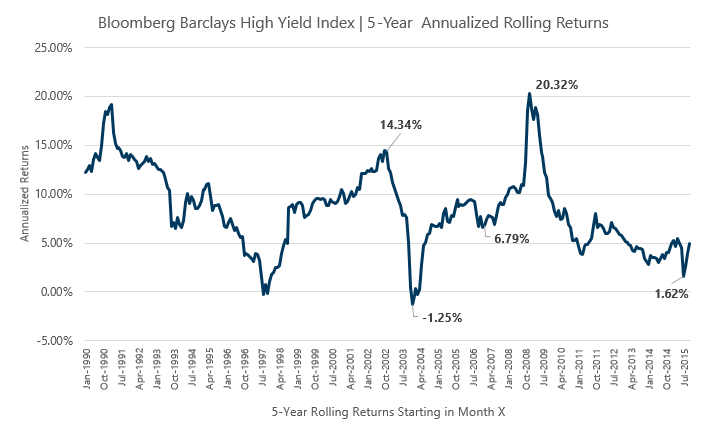
The chart above shows 310 instances of 5-year annualized returns.
For example, if you put $100,000 into this index on Oct 2002, 5 years later, your annualized return is 14.34% a year.
However, if you put $100,000 into this index on Jul 2003, 5 years later, your annualized return is -1.25% a year.
Very contrasting difference.
Some observations:
- While the market peaked in 2007 to 2008, if you have invested then, your annualized return is not too shabby at 6.79% a year
- What is considered a challenging 5-year period for high yield bonds might not coincide with the challenging periods for equities
The 1.62% a year return starting in Jul 2015 factors in this 2020 Pandemic mayhem.
Bloomberg Barclays Global High Yield vs MSCI World 5-Year Rolling Returns
Let us compared the rolling returns versus the MSCI World. The MSCI World allows you to capture the returns of a basket of global blue chip stocks.
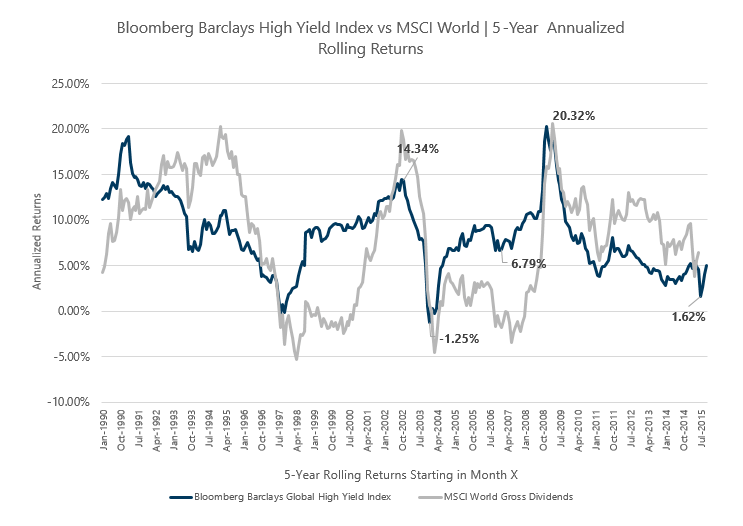
Like the Global High Yield Index, your mileage may vary depending on when you get invested. The 2000 to 2010 was an atrocious period for equities, and you would have been better off invested in this somewhat risky high yield segment.
If we considered other periods, the MSCI World gives you better high yield returns.
You might find it difficult to see whether the global high yield index did better or the MSCI World.
The global high yield minus MSCI World chart might give a better idea:
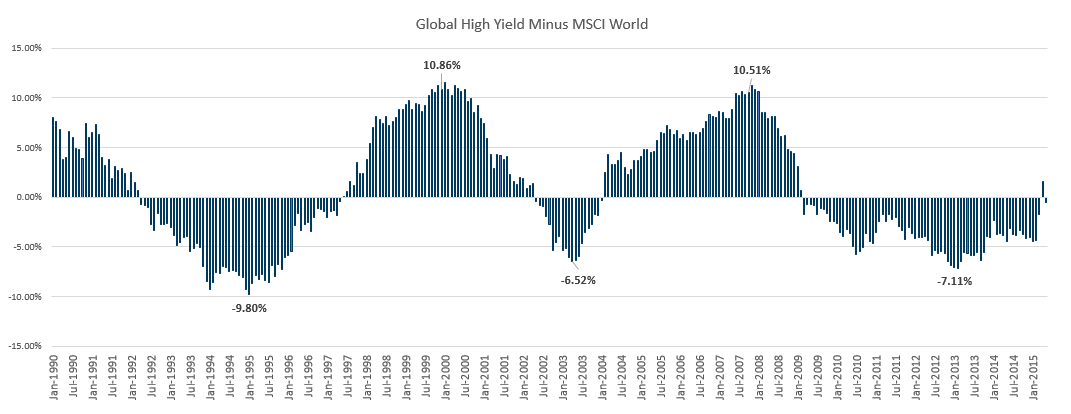
The period above zero are those periods where the global high yield did better than the MSCI World and the periods below zero are when the global high yield did nto do so well.
The interesting thing is that the high yield outperformance was higher than the MSCI world.
Global High Yield Bond Volatility vs MSCI World Equity Volatility
Returns is just one side of the equation.
In order to capture the returns, you got to be able to ride the volatility. The higher the volatility, the tougher it is for us to live with.
The higher the volatility, the returns tend to be higher as well.
| BB High Yield Index | MSCI World | |
| 1990 to 2020 | 9.86% | 14.95% |
| 1990 to 1999 | 9.62% | 13.93% |
| 2000 to 2009 | 11.50% | 16.50% |
| 2009 to 2020 | 8.19% | 14.20% |
The table above shows the standard deviation of the BB Global High Yield and MSCI World.
Basically, BB Global High Yield Index has a slightly weaker return but its volatility profile is close to that of a 60% Equity 40% Balanced fund.
BB Global High Yield has a higher risk-adjusted return versus the MSCI World.
This means that investors may have a more livable experience with high yield than equity over this 31-year historical time period.
If the experience is more livable, they tend to be able to stick to it for a longer period.
Global High Yield Bond Drawdown Profile
Even if we compare the volatility between two asset class, it does not give you a good idea the downside volatility.
Volatility can be to the upside or to the downside.
If we examine the profile of the drawdown, it may give us a better picture. A drawdown happens when prices fall down from a certain point.
Drawdowns can be as shallow as 0.1% to as much as 33%.
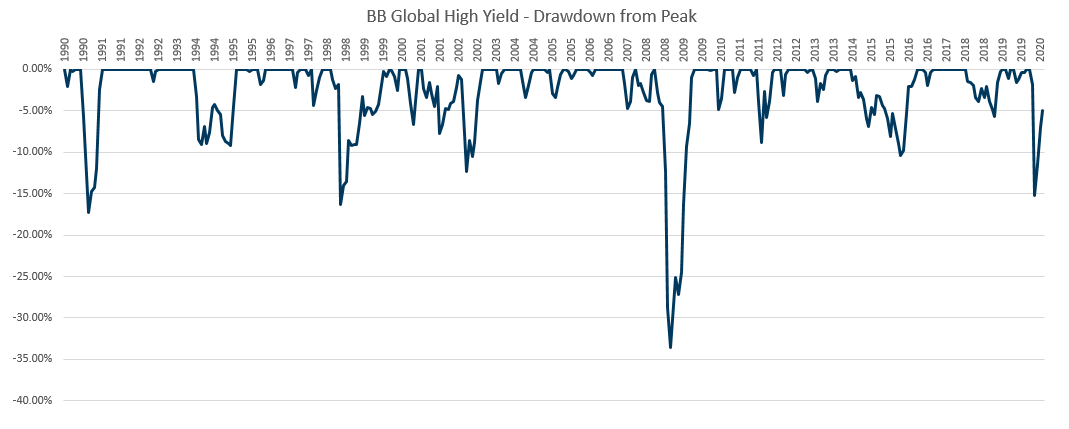
The chart above shows the number of times you will face a drawdown and how deep are the draw down.
The GFC draw down was steep at -33.57%. But you will notice that most of the drawdown is less than 10%.
Here is a table to show the break down of the drawdown:
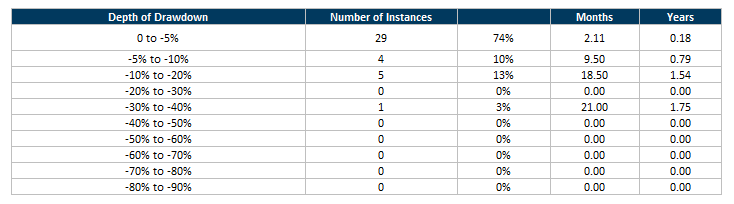
In this 31 year period, there were 39 notable drawdowns.
74% of these drawdowns were less than 5% in magnitude. They take an average of 2 months to recover so that you get back to the peak.
10% of those drawdowns were between 5% to 10%. 13% of those drawdowns were between 10% to 20%. (this includes the pandemic drawdown)
There is one big drawdown that is -33.5% in magnitude.
About 85% of the drawdown recovered within the year.
Global High Yield Bond Versus Balanced Fund
Remember that I said previously that at this point, the Global High Yield Bond Index has quite a similar profile to a 60% Equity 40% Bond Balanced Fund?
How well will each do if we pit them against each other?
I have created a 60% MSCI World Index + 40% Bloomberg Barclays Global Aggregate Bond Index with 36 basis point of fee. The bond is rather long duration so the returns tend to be closer to the high yield.
| BB High Yield Index | 60% MSCI World 40% BBGA | |
| 1990 to 2020 | 8.4% | 6.2% |
| 1990 to 1999 | 11.3% | 9.8% |
| 2000 to 2009 | 8.1% | 2.3% |
| 2009 to 2020 | 5.9% | 6.6% |
I think return wise the BB Global High Yield Index gives a more balanced return.
| BB High Yield Index | 60% MSCI World 40% BBGA | |
| 1990 to 2020 | 9.86% | 8.98% |
| 1990 to 1999 | 9.62% | 8.86% |
| 2000 to 2009 | 11.50% | 9.60% |
| 2009 to 2020 | 8.19% | 8.35% |
While BB Global High Yield has higher return, its volatility profile tends to be higher than the balanced portfolio.
The risk adjusted returns, after factoring in volatility is also higher for the BB Global High Yield index.
If we layer the Balanced fund against the BB Global High Yield Index, you will notice that they tend to be correlated for most periods.
But the returns of the high yield index always looked better.
Actual ETF Performance Versus BB Global High Yield Bond Index
Both the SHYU and IHYU sought to replicate the Markit iBoxx USD Liquid High Yield Index and not the Bloomberg Barclays Global High Yield Index.
So I thought it might be a good idea to do a sanitary check just to ensure that the performance is not too far off.
IHYU do not have a long history and so I sought to compare the performance of SHYU, converted from GBP to USD to its Markit iBoxx index and BB Global High Yield Index:
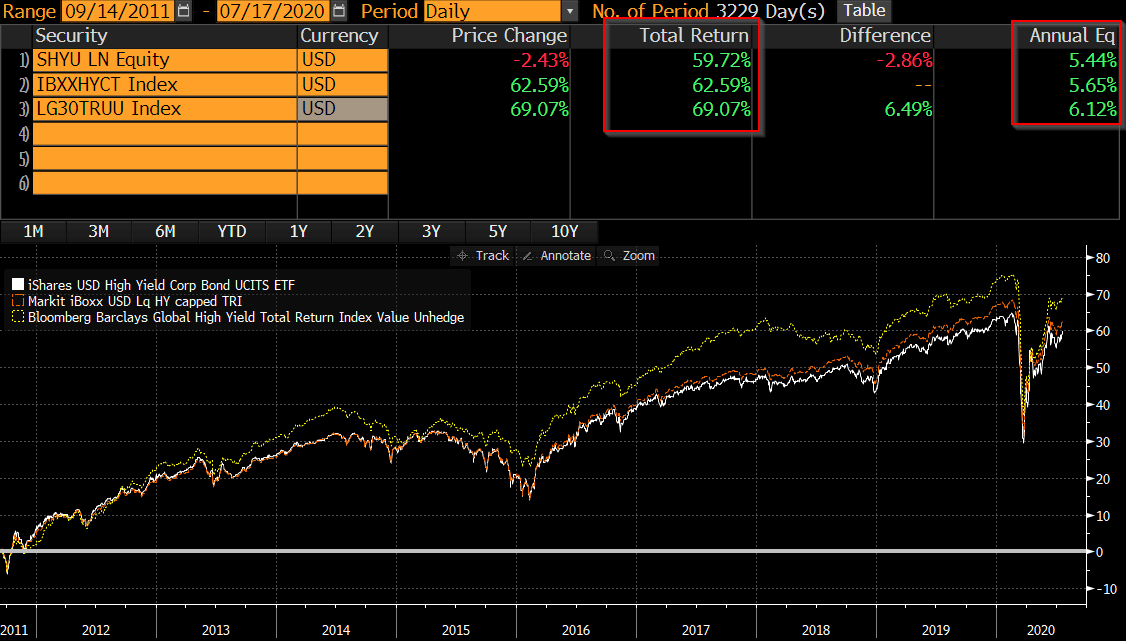
What we notice is that the BB Global High Yield Index performed better than the Markit iBoxx HY Index.
In a way SHYU is not doing too badly versus its own index. The difference over 9 years is about 10% which is pretty big in the grand scheme of things.
But still 5.44% a year return vs 6.12% a year is not too far off.
ETF Versus Active Funds
I thought while we are at this, let us take a look at how the ETF compares to some of the popular unit trust funds out there.
They say that the active manager can better add value when it comes to bond management as compared to equities.
So I managed to pick up some Blackrock, Pimco, and JP Morgan Global High Yield funds and contrast their performance to the SHYU over this 9-year period.
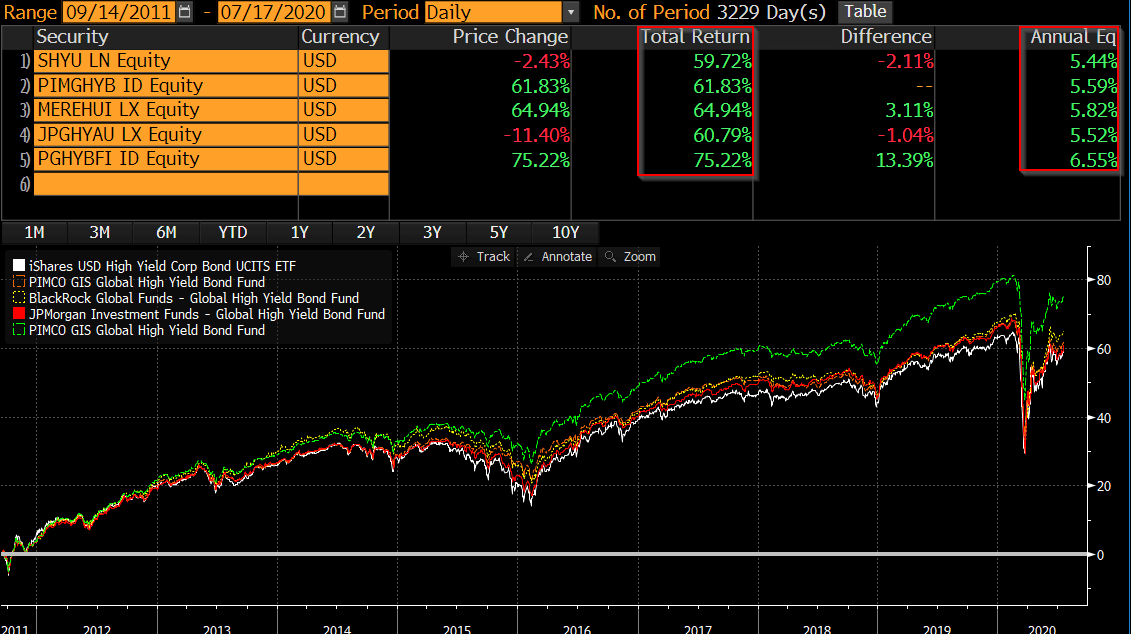
You will notice that the performance of most active funds fall pretty close to SHYU. There is one fund that is more special. This is the PIMCO GIS Global High Yield Bond Fund.
Notice that there are two PIMCO fund of the same name. The difference here is the green one is the institutional share class of the same fund. Likely, the expense ratio is much lower than the retail one.
This shows you the difference cost makes.
Summary
If you based a large portion of your portfolio on an individual high yield bond, that could be a very risky thing.
However, if you hold a portfolio of bonds, the returns can be rather decent even though the credit rating for each individual issue can be pretty low.
Based on historical data:
- Global high yield is not bad compared to 100% equities and a balanced portfolio
- The volatility profile of high yield is comparable to a balanced fund
- Total return has come down as interest rate comes down. However, at this point it is rather inconclusive if the fall is largely attributable to the interest rate. Equity returns have come down versus years ago.
- The worst drawdown of a global high yield bond fund is equivalent to that of a balanced fund
Notice that in this whole analysis, there was not much mention of the yield to worst, yield to maturity.
As with most things, I look at things from the total return perspective. How does the capital appreciation and yield measure together versus another security.
The main idea is to not look at high yield bond as a segment closer to high quality bonds but as it is, somewhere that belongs halfway between the equity and bond on the risk spectrum.
You will go through periods of volatiltiy but you should do alright. I do think that unless we have a great reset, future high yield returns, just like equities and bonds will get lower.
If you take a more passive approach to invest and think some of these more data-driven articles would benefit your wealth-building, you can check out this VWRA vs IWDA article and this DFA Global Core rolling returns article on Providend written by yours truly.
I invested in a diversified portfolio of exchange-traded funds (ETF) and stocks listed in the US, Hong Kong and London.
My preferred broker to trade and custodize my investments is Interactive Brokers. Interactive Brokers allow you to trade in the US, UK, Europe, Singapore, Hong Kong and many other markets. Options as well. There are no minimum monthly charges, very low forex fees for currency exchange, very low commissions for various markets.
To find out more visit Interactive Brokers today.
Join the Investment Moats Telegram channel here. I will share the materials, research, investment data, deals that I come across that enable me to run Investment Moats.


Do Like Me on Facebook. I share some tidbits that are not on the blog post there often. You can also choose to subscribe to my content via the email below.
I break down my resources according to these topics:
- Building Your Wealth Foundation – If you know and apply these simple financial concepts, your long term wealth should be pretty well managed. Find out what they are
- Active Investing – For active stock investors. My deeper thoughts from my stock investing experience
- Learning about REITs – My Free “Course” on REIT Investing for Beginners and Seasoned Investors
- Dividend Stock Tracker – Track all the common 4-10% yielding dividend stocks in SG
- Free Stock Portfolio Tracking Google Sheets that many love
- Retirement Planning, Financial Independence and Spending down money – My deep dive into how much you need to achieve these, and the different ways you can be financially free
- Providend – Where I used to work doing research. Fee-Only Advisory. No Commissions. Financial Independence Advisers and Retirement Specialists. No charge for the first meeting to understand how it works
- Havend – Where I currently work. We wish to deliver commission-based insurance advice in a better way.
Kyith is the Owner and Sole Writer behind Investment Moats. Readers tune in to Investment Moats to learn and build stronger, firmer wealth foundations, how to have a Passive investment strategy, know more about investing in REITs and the nuts and bolts of Active Investing.
Readers also follow Kyith to learn how to plan well for Financial Security and Financial Independence.
Kyith worked as an IT operations engineer from 2004 to 2019. Currently, he works as a Senior Solutions Specialist in Insurance Start-up Havend. All opinions on Investment Moats are his own and does not represent the views of Providend.
You can view Kyith's current portfolio here, which uses his Free Google Stock Portfolio Tracker.
His investment broker of choice is Interactive Brokers, which allows him to invest in securities from different exchanges all over the world, at very low commission rates, without custodian fees, near spot currency rates.
You can read more about Kyith here.
- New 6-Month Singapore T-Bill Yield in Late-April 2024 to Drop to 3.70% (for the Singaporean Savers) - April 18, 2024
- Golden Nuggets from JPMorgan Guide to Retirement 2024. - April 16, 2024
- Be Less Reliant on Banks and Build Stronger Capital Markets by Pushing for Better Shareholder Dividend and Buyback Yield - April 14, 2024
Vinson
Sunday 11th of July 2021
Hi Kyth, given that junk bonds as an asset class have similar returns/correlations to a 60/40 world stock/safe bonds portfolio, is there any incentive to invest in this asset?
Kyith
Wednesday 14th of July 2021
Hi Vinson, do you mean incentive to invest in high yield? I am on the fence on this. It looks real good but I am trying to sense on the background if going forward, the low interest environment is just going to make high yield look challenging versus the risk we are undertaking.
James
Friday 31st of July 2020
Hi Kyith,
Any idea what are the capital gain taxes and estate duties for Singaporeans who invest in Ireland domicile S&P 500 ETFs listed on LSE?
Kyith
Friday 31st of July 2020
Hi James, you will not be taxed capital gain taxes if you sell the ETF listed in LSE. it is not because it is listed in LSE but its domiciled in Ireland. as of now Ireland do not tax retail investors estate duties.
Chris
Monday 20th of July 2020
Good insight! I believe there is always a place for HY. BTW statistically what is the default rate for HY vs IG, the we may take a risk based approach.
Kyith
Thursday 23rd of July 2020
Hi Chris, I have not looked into the default rate of high yields. The highest range for emerging market corporate bond is close to 9%. for emerging market govt corporate bond is 6%.
Sinkie
Sunday 19th of July 2020
I think those who have been in funds for a long time, or those who have been investing in US for 15+ years ... this is not new.
Basically the reason you want to add junk bonds funds is the diversification of asset classes. It zogs while stocks zig & treasuries zag. Although it moves closer to stocks behaviour than treasuries. I would say closer to 70:30.
Many ppl in S'pore as usual tend to analyse as whether it can give (almost) guaranteed returns at low risk, and/or binary all-or-nothing approach. Every asset has their cycles & idiosyncrasies. Stocks, treasuries, IG corporates, coco's, junk bonds, properties, commodities, precious metals, USD, SGD etc ... all do very badly at some times & very well at other times, and everything in between.
lim
Sunday 19th of July 2020
i feel currently, high yield bond funds have too much additional risk over Investment Grade Corporate Bond ETFs.
This 'yield compression' as the yield gap between high yield and investment grade is reverting to historical lows (it spiked during the crash but once Fed said they are going to buy Junk bonds, the spread is dropping again)
https://www.creditmarketdaily.com/corporate-bond-index-spread-data/high-yield-corporate-bond-index-spreads-yields/
I looked at the Barclays Global Aggregate Bond index you used for the basis of comparison and the benchmark contains 52% Treasuries and 12% Mortgage backed securities. Maybe a better comparison benchmark would be investment grade corporates only vs high yield.
I'm currently vested in LQDE and VDCP, US Investment grade corporates and happy with the yield and even got some capital gain. As a bonus, investment grade bond ETFs have lower expense ratio.
Kyith
Sunday 19th of July 2020
Hi Lim,we are getting into a market timing conversation now. That is not something I want to look into at this point. I am not sure but I am basing on Barclays global high yield bond index.
lim
Sunday 19th of July 2020
oops the link i provided was European market spreads but globally the pattern seems similar