I have been a bit disturbed over some work & personal stuff, so I didn’t have the bandwidth to think about anything much.
For this Sunday’s piece, I decided to meditate over this research slide deck that I came across.
Over the past few months, one of the core positions that I have built up was the iShares Edge MSCI World Multifactor UCITS ETF (IFSW). This is an exchange-traded fund listed on the London Stock Exchange.
The fund’s objective is to capture the market risk, size, value, quality and momentum factors. The fund does this by mirroring the holdings of the MSCI World Diversified Multiple-Factor Index.
The fund costs is a bit expensive with a total expense ratio of 0.50%. In contrast, the other single factor ETF would cost around 0.30%.
A few days ago, I came across this consultation presentation which outlines a proposal to make certain adjustments to the MSCI Diversified Multiple-Factor (“DMF”) Index Methodology. This slide deck is dated April 2021.
I don’t know whether they would announce whether they will make the change or not but I felt that its pretty cool they are transparent enough to present this to the public.
At least we can have a glimpse about some of the inner working of the multiple-factor index.
Why do they propose the changes?
MSCI optimise the index so that the index can maximise the target factors (size, quality, value, momentum) that the index tries to capture.
But they find that from Dec 2014 to Nov 2020, while the target factors were able to contribute positively to the returns of the index, there was some negative stock-specific contribution that pulled down the performance.
The backtested result (including longer periods) shows that this negative stock-specific contribution was much more muted.
In the last 3 years, some of the key target factors underperform. Together with these negative stock-specific contributions, the overall performance of the MSCI DMF Indexes was not good.
To give you some context, here is IFSW’s performance versus the MSCI World ETF IWDA:
| IFSW | IWDA | |
| 2021 YTD | 12.79% | 10.18% |
| 2020 | 10.70% | 15.95% |
| 2019 | 21.64% | 27.76% |
| 2018 | -11.76% | -8.65% |
| 2017 | 26.18% | 22.45% |
| 2016 | 4.97% | 7.73% |
This proposal is to highlight how they can make tweaks to improve the implementation.
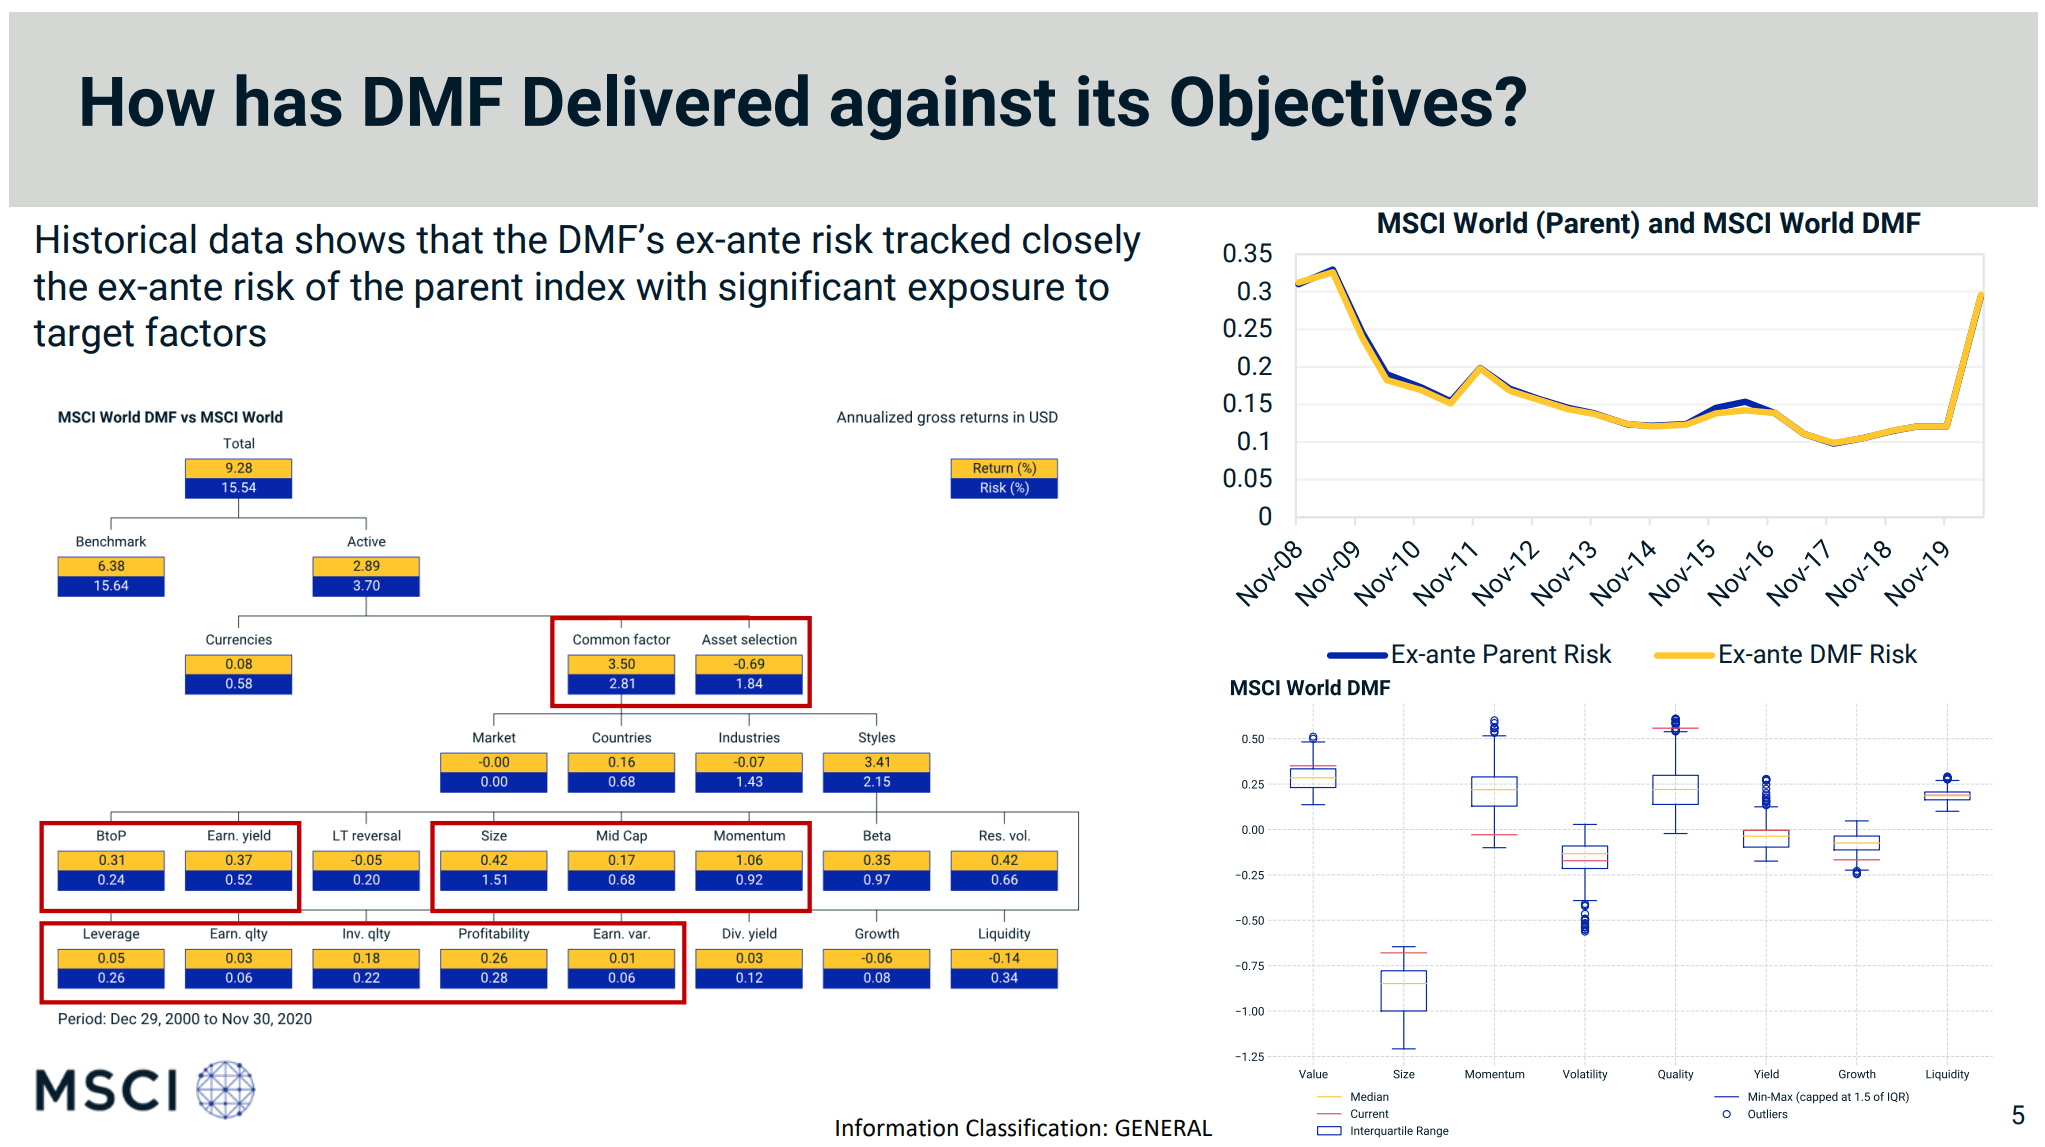
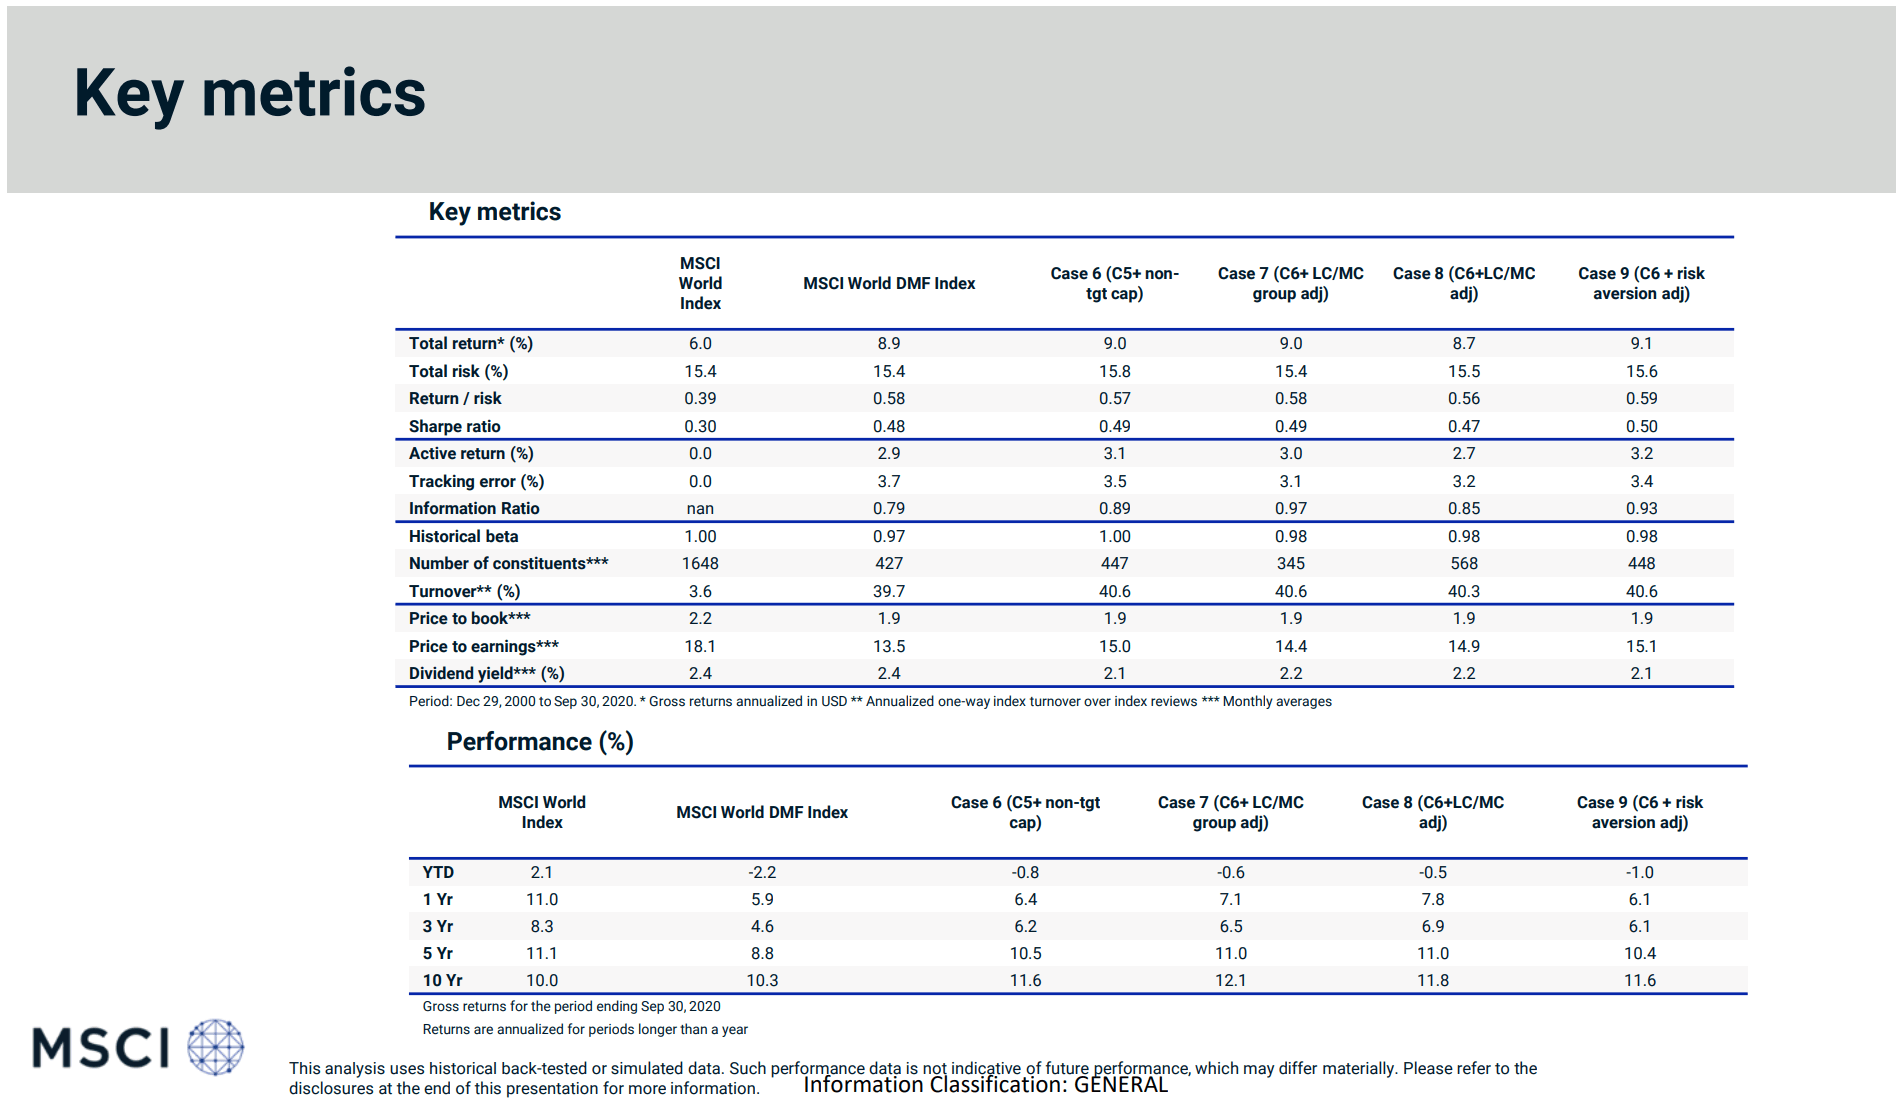
This interesting slide shows the performance attribution of the diversified multiple-factor (DMF) index from 2000 to 2020.
The DMF index delivered a compounded average growth of 9.28% a year. Out of this, 6.38% a year was attributed to the market-risk factor (mainly capturing the MSCI World return) and 2.89% a year is due to active management.
Bulk of that return can be pointed to the individual style metrics such as book-to-price, earnings yield, size, momentum, profitability.
Quite interesting that index outperformance by a multiple-factor index can be traced to so many different metrics.
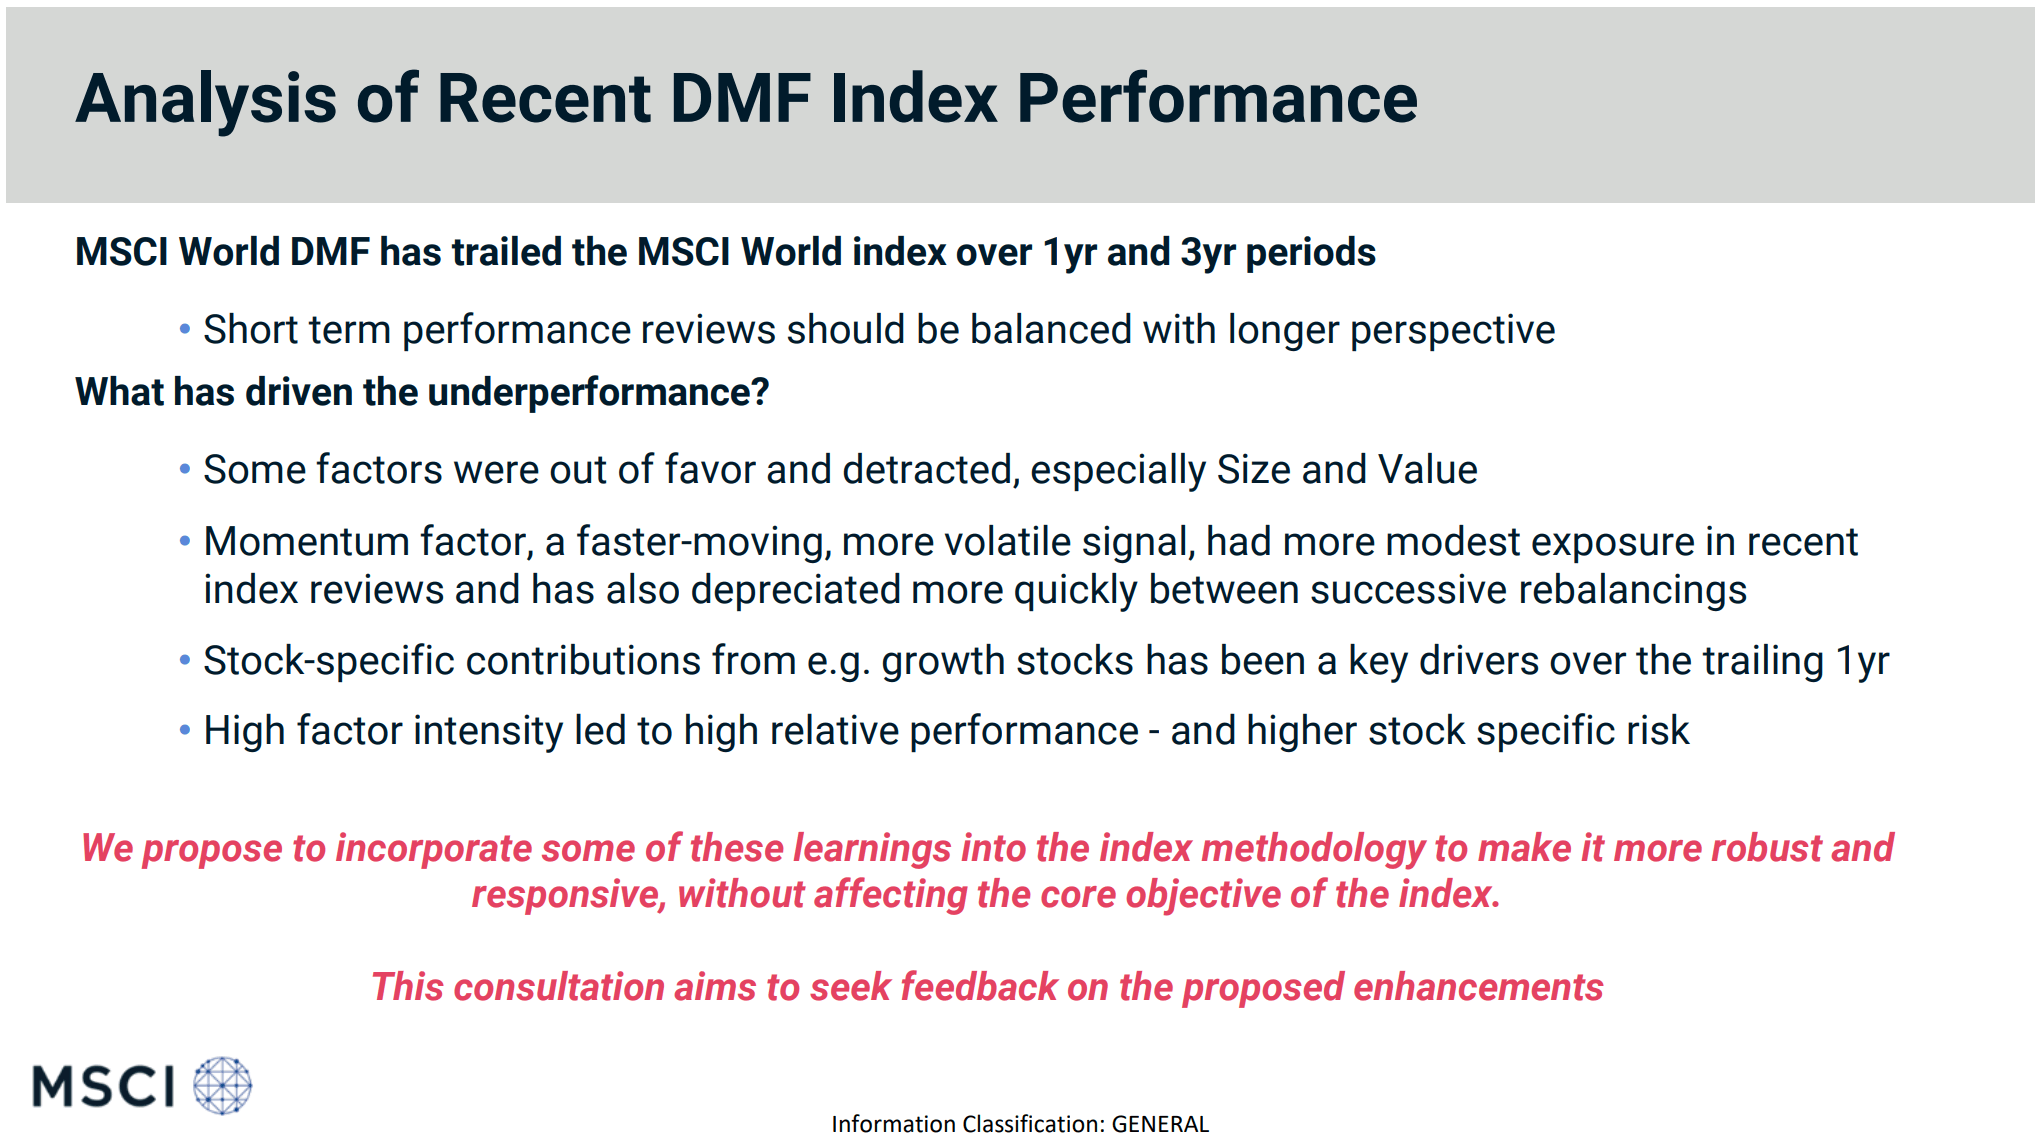
The last three years have not been great for the DMF indexes.
There were negative premiums for size and value. What also hurt was that momentum, which did well in the past three years, was not successfully captured in the index.
High factor intensity led to high relative performance and higher stock specific risk.
So they decide to propose some changes.
MSCI broke down the explanation into a few groups, so that we can visualize the effect of each proposals.
Proposal Group 1: Use a more recent data model
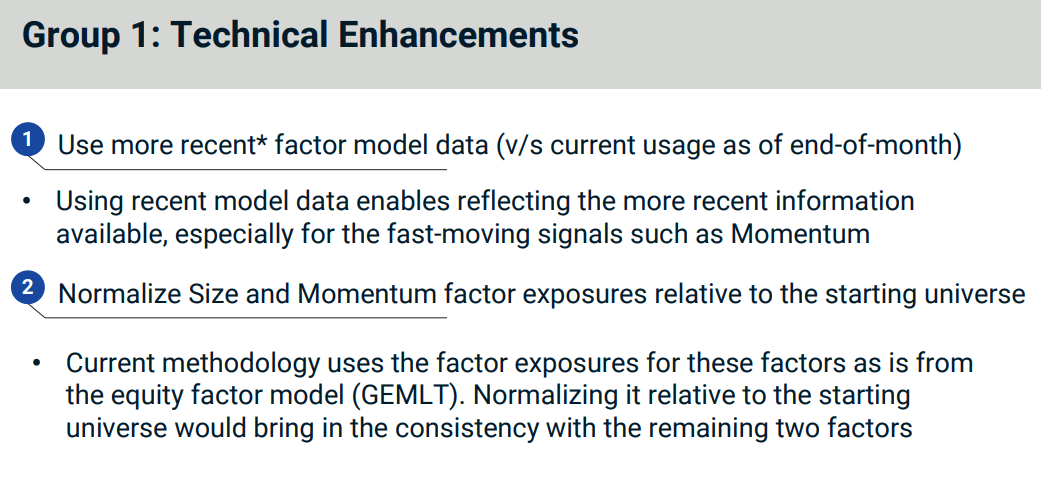
The first proposal group sought to address why momentum was not able to pick up successfully. They proposed to use more recent data, as opposed to data that is end-of-the-month.
Momentum is a rather sensitive factor and by using more recent data might allow the index to pick up the stocks with strong positive price momentum that does not decay so fast.
They also propose normalizing the size and momentum factor exposure.
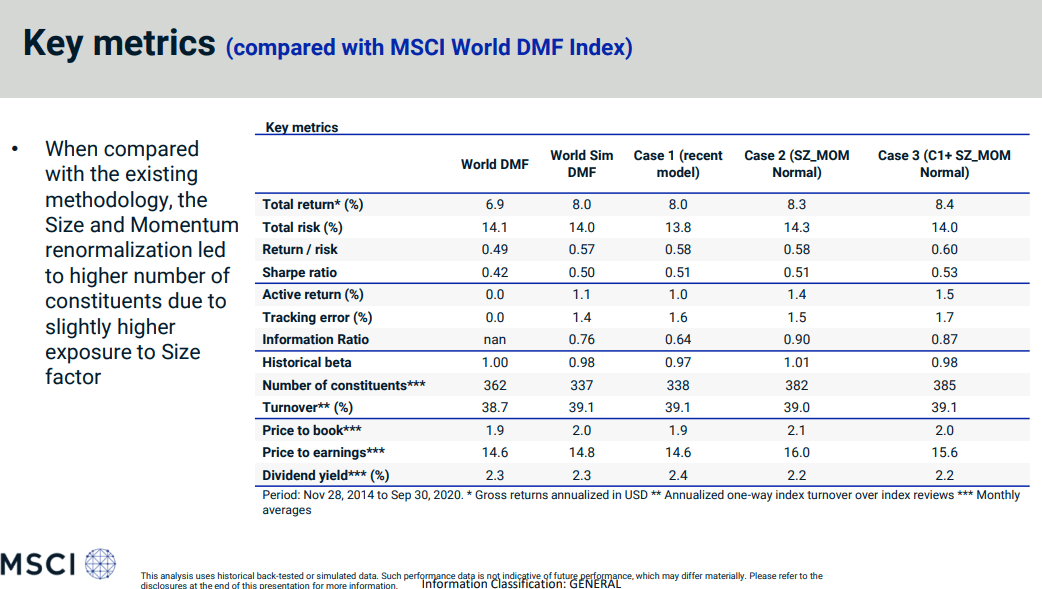
In this slide, MSCI presented 4 variations to the World DMF based on these proposals. I would not go into each of those variations but you can see that all 4 have higher total return for the 6 year period from 2014 to 2020.
The Sharpe ratio and Information ratio is higher as well. (Note: The information answers two important questions: #1 did the manager outperform the benchmark, in this case the World DMF and #2 can the manager outperform the benchmarket consistently? A higher information ratio is bette.)
Proposal Group 2: Better targetting of factors and Increasing rebalancing frequency
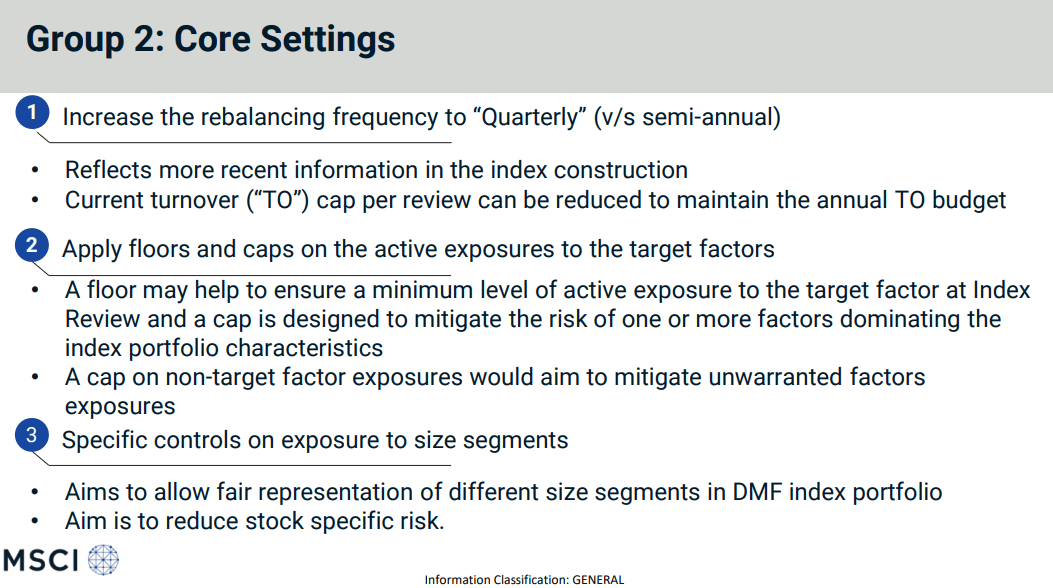
The second proposal group of change sought to increase the rebalancing frequency to quarterly so as to factor more recent information. Another proposal is also to control the minimum and maximum exposure to each of the factors.
The last proposal is to control the size factor, which sought to minimize the negative stock specific risk that have pulled down the DMF index in the past three years.

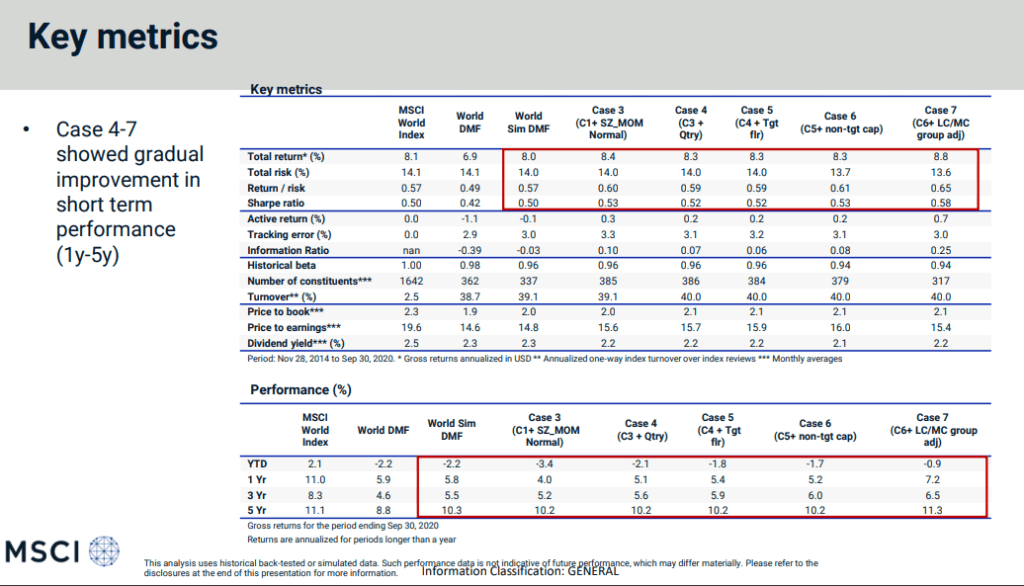
This table above is slightly different from the previous one in that we are comparing this group of proposed changes (those highlighted in the top red box) to the MSCI World instead of the MSCI World DMF over the past 6 years.
Firstly, we can see the underperformance of the World DMF versus the MSCI World.
Most of the changes will realign the performance to be better if we live through the same six years of performance again. The Sharpe ratio and Information Ratio is higher, but not by a lot.
Proposal Group 3: Controlling the Concentration into Smaller Size Stocks
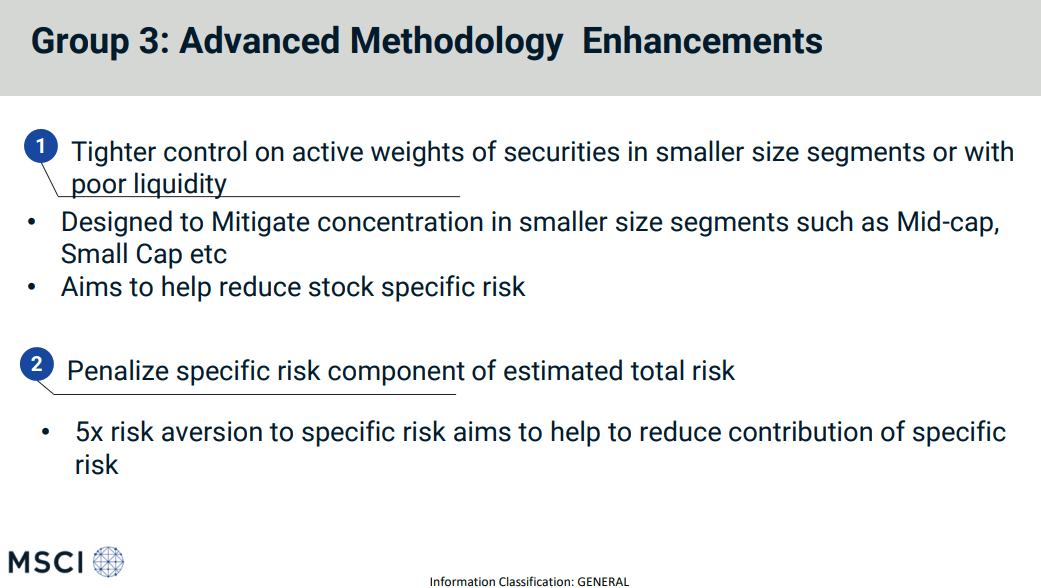
Finally in proposal group 3 sought to reduce the concentration to certain size segments such as mid cap and small cap and also to penalize the specific risk component of estimated total risk.
Honestly, I have no idea how this is going to be done.
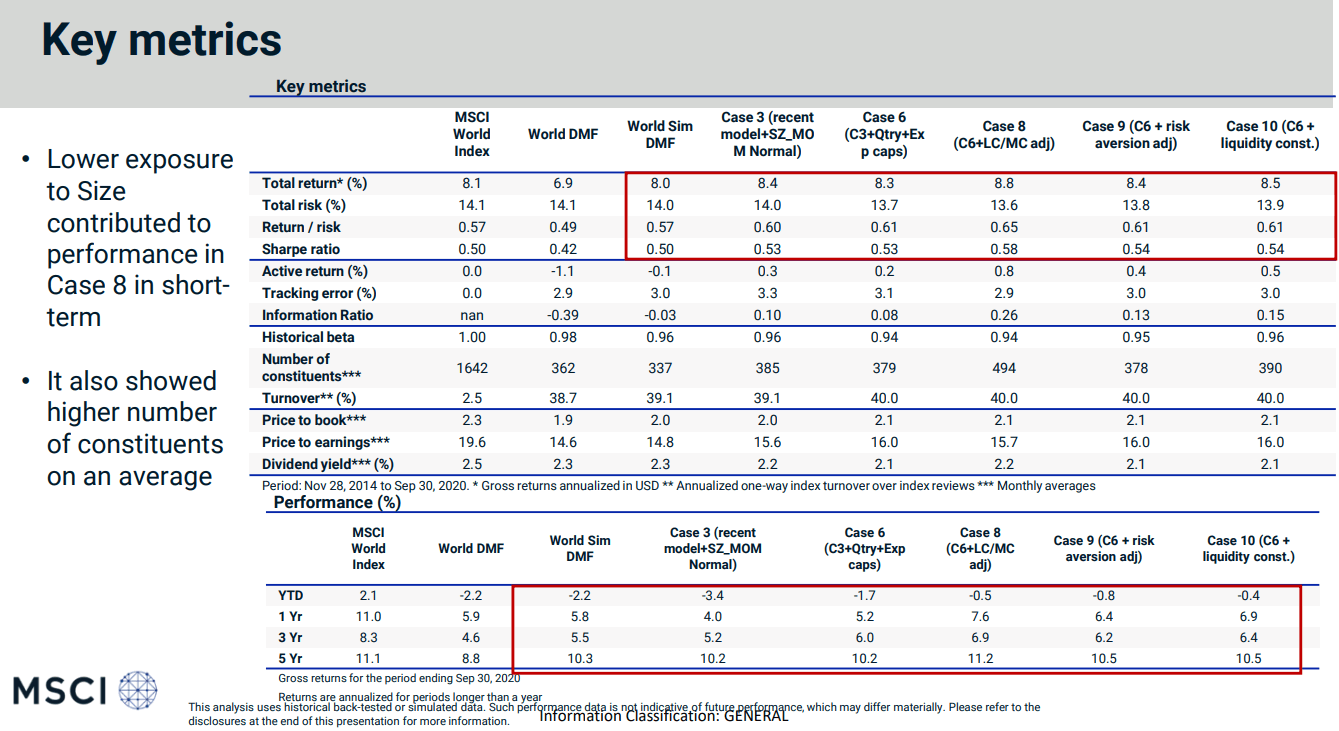
While the total return, Sharpe Ratio and Information Ratio improved with the proposals, I cannot help but noticed that with the proposals, the DMF index would still not fair as well as a market capitalization weighted MSCI World Index for the past 3 years.
Returns of the Proposals Versus MSCI World Returns Over the Past 2 Decades
The table above tries to sum up the proposals by looking at the back-test data not in the past six years but from 2000 to 2020.
With some of these proposal, the total return is still better than the MSCI world and world DMF index over this 21 year period.
The Sharpe and Information ratio is higher with not much noticeable incrase in portfolio turnover.
However, somehow I noticed from the table below that while we can improve the 5-year and 10-year performance and improve the world DMF performance, in the short term, the proposals cannot beat the MSCI World index in the past three years.
Summary
The slide deck gave me a glimpse of the thought process behind how these factor funds are implemented.
While everyone can say that they aim to capture this premium or that premium, in reality, different implementations can give different results.
I feel that it is good MSCI are proactive in trying to optimize the factors to capture, this can be misinterpreted as curve-fitting or trying to reverse engineer, come up with “tweaks” so as to beat the index over this six years period.
Ultimately, the accepted tweaks should show that they can effectively capture the target factors over various market cycles.
This slide deck also shows the challenges in trying to balance the factor capture in a multiple factor strategy.
Is investing in such a factor ETF worth it?
If we based on the performance of the past 3 years, or the past 6 years, it would be stupid to invest in a multiple-factor ETF.
However, investing in such an ETF means I have to subscribe to a methodology that while the methodology may not work so well at times, over the long run, there is empirical evidence that returns would perform better than the parent index.
My view is that, in the worse case, the multiple factor ETF do equal or slightly worse than the parent index, but in the baseline case, the ETF is able to capture returns greater than the parent index.
That looked like a good bet to take.
I would probably change if I could find a better implementation or when I see evidence that fund flows or some other factor have permanently reduced the potential factor premiums drastically.
I invested in a diversified portfolio of exchange-traded funds (ETF) and stocks listed in the US, Hong Kong and London.
My preferred broker to trade and custodize my investments is Interactive Brokers. Interactive Brokers allow you to trade in the US, UK, Europe, Singapore, Hong Kong and many other markets. Options as well. There are no minimum monthly charges, very low forex fees for currency exchange, very low commissions for various markets.
To find out more visit Interactive Brokers today.
Join the Investment Moats Telegram channel here. I will share the materials, research, investment data, deals that I come across that enable me to run Investment Moats.


Do Like Me on Facebook. I share some tidbits that are not on the blog post there often. You can also choose to subscribe to my content via the email below.
I break down my resources according to these topics:
- Building Your Wealth Foundation – If you know and apply these simple financial concepts, your long term wealth should be pretty well managed. Find out what they are
- Active Investing – For active stock investors. My deeper thoughts from my stock investing experience
- Learning about REITs – My Free “Course” on REIT Investing for Beginners and Seasoned Investors
- Dividend Stock Tracker – Track all the common 4-10% yielding dividend stocks in SG
- Free Stock Portfolio Tracking Google Sheets that many love
- Retirement Planning, Financial Independence and Spending down money – My deep dive into how much you need to achieve these, and the different ways you can be financially free
- Providend – Where I used to work doing research. Fee-Only Advisory. No Commissions. Financial Independence Advisers and Retirement Specialists. No charge for the first meeting to understand how it works
- Havend – Where I currently work. We wish to deliver commission-based insurance advice in a better way.
Kyith is the Owner and Sole Writer behind Investment Moats. Readers tune in to Investment Moats to learn and build stronger, firmer wealth foundations, how to have a Passive investment strategy, know more about investing in REITs and the nuts and bolts of Active Investing.
Readers also follow Kyith to learn how to plan well for Financial Security and Financial Independence.
Kyith worked as an IT operations engineer from 2004 to 2019. Currently, he works as a Senior Solutions Specialist in Insurance Start-up Havend. All opinions on Investment Moats are his own and does not represent the views of Providend.
You can view Kyith's current portfolio here, which uses his Free Google Stock Portfolio Tracker.
His investment broker of choice is Interactive Brokers, which allows him to invest in securities from different exchanges all over the world, at very low commission rates, without custodian fees, near spot currency rates.
You can read more about Kyith here.
- New 6-Month Singapore T-Bill Yield in Late-April 2024 to Drop to 3.70% (for the Singaporean Savers) - April 18, 2024
- Golden Nuggets from JPMorgan Guide to Retirement 2024. - April 16, 2024
- Be Less Reliant on Banks and Build Stronger Capital Markets by Pushing for Better Shareholder Dividend and Buyback Yield - April 14, 2024
JC
Monday 27th of November 2023
Hi Kyith,
I’m planning to build up IFSW via IBKR for tax efficiency purposes because my portfolio mainly consists of Avantis ETF (which is not Irish-domiciled) at this moment.
I noticed there are two options for IFSW ETF on IBKR: BVME.ETF and LSEETF.
May I know the differences? Is IFSW LSEETF the ETF you mentioned in this article?
Thank you!
JC
Tuesday 5th of December 2023
@Kyith,
No problem. Thank you! :)
Kyith
Saturday 2nd of December 2023
Hey JC , so sorry for the late response. I am using IFSW. I never seen BVME before.
Matt
Sunday 15th of August 2021
Hi Kyith,
What do you think of the new Dimensional ETFs?
And will they have Irish Domiciled ones in the future?
Kyith
Sunday 15th of August 2021
Hi Matt, have not looked at them but i think they might have one or two that is real good. Personally my sensing is that there might not be UCITS DFA ETF as the reason they have those was due to the tax efficient angle. This may be less so in the international context.
BC
Tuesday 25th of May 2021
Dear Kyith, thank you for your write up on factor fund or ETF. If I only have access to HK, SG and US products, is there any factor fund that you will recommend? Do you prefer multi-factor or a single factor that you believe is more effective in creating the alpha?
Kyith
Tuesday 25th of May 2021
Hi BC, this one i am not sure. These factor funds may be suitable for different people. For some who are more risk averse, perhaps a minimum volatility fund is good. for those who believe in the factors and would like to capture more than market return,then a multifactor funds might be suitable.
Julia Ng
Sunday 23rd of May 2021
Hi Kyith, looking at the performance between IFSW and IWDA, it looks like IWDA would have been a better buy. Did you consider it? Also, do you generally prefer Irish domiciled ETFs? Thanks.
Kyith
Sunday 23rd of May 2021
HI Julia, I prefer Irsih Domiciled ETF due to the tax efficiency. Less estate tax headache for my heirs if I passed away. If we look at the 5 year performance, of course there is no point to buy any factor ETF (Except momentum). But if you assess the period from 1999 to 2009, you would wonder why would we invest in IWDA (total return 20% for 10 years) when the rest of the factor index is at least doubled that return.
Theks
Sunday 23rd of May 2021
Interesting. Is it right to say that this is the iShares version of what the dimensional portfolios or is it more akin to multiple factor investing?
Kyith
Sunday 23rd of May 2021
Dimensional's portfolios are also multifactor funds. It is partly systematic partly due to Dimensional's superior trading desk.
You can equate this to the Dimensional Global Core equity. The Dimensional Global Core equity targets the MSCI World, but the smaller companies, ranks them based on value, then profitability. They infuse momentum when they decide what to buy and sell. for example if they are suppose to buy this list of 10 stocks that match value, small and profitability but the stock is not having positive momentum, they delay buying. similarily, if a stock they are suppose to rotate out of has positive momentum, they delay selling it.
Thus, the Ishares multiple factor etf is pretty close to this. if you track the index performance, sometimes it beats the Dimensional global core index sometimes the global core index beats it.