I have a comment who tried to rub it in for the recent poor performance of my US small-cap value-weighted fund and request for some weird research that I can never do and would never be helpful.
But I would take this opportunity to record some notes regarding the premium of small-cap value over the large-blend index.
I didn’t overly sell the small-cap value concept as others in the past, but this article shows how much premium US small-cap value had over the S&P 500. We will use Dimensional’s US Small Cap Value Research index as a proxy. I have also did the data work with the Fama-French Small Value Research Index, which will show the same conclusion, but I will not show the data here.
You will be able to see over the past 98 years in US, the pessimistic cumulative return, the premium of small-cap value over large-blend index, number of negative years, the median premium.
Five-Years Rolling Return from Jun 1927 to Jan 2023
There are 1089 five-year periods we can extract return data.
I will give you the 25th percentile five-year cumulative return because the 25th percentile is a pessimistic/unlucky investor return. The 50th percentile is the median.
- Dimensional Small Cap Value Index: 53.5%
- S&P 500: 29.9%
Percentage of periods where returns were negative (there are 1089 periods):
- Dimensional Small Cap Value Index: 9.9%
- S&P 500: 11.3%
Here is the value + small premium over large + blend:
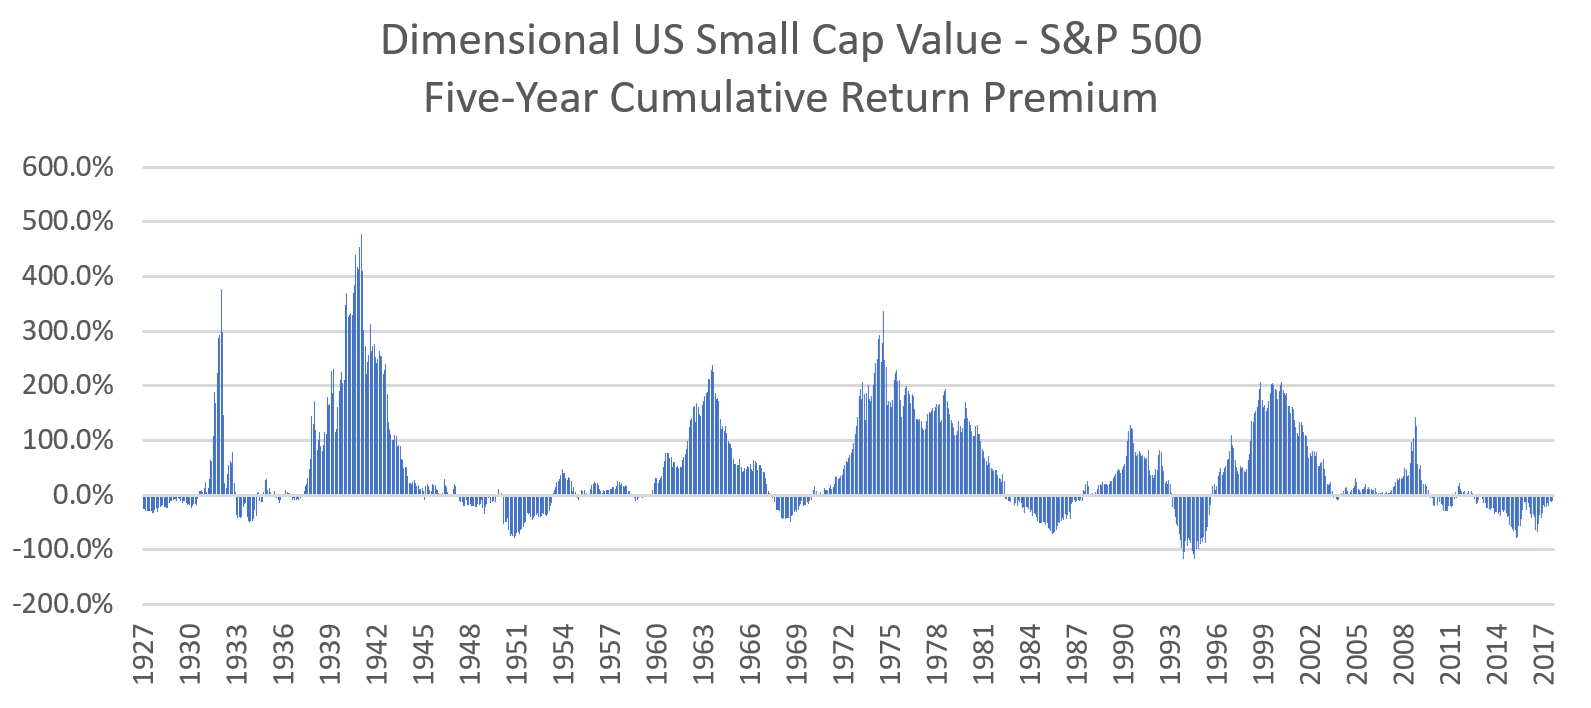
The median premium of small-cap value over S&P 500 is 16.4%.
Negative means that S&P 500 did better than the US small-cap value over those five years. You can observe that throughout history, there are these periods where returns are lower.
But there are some crazy periods where the small-cap value did 400% better than the S&P 500.
Ten-Years Rolling Return from Jun 1927 to Jan 2023
There are 1029 ten-year periods we can extract return data.
The 25th percentile ten-year cumulative return:
- Dimensional Small Cap Value Index: 202%
- S&P 500: 98%
Percentage of periods where returns were negative (there are 1029 periods):
- Dimensional Small Cap Value Index: 3.9%
- S&P 500: 5.2%
Here is the value + small premium over large + blend:
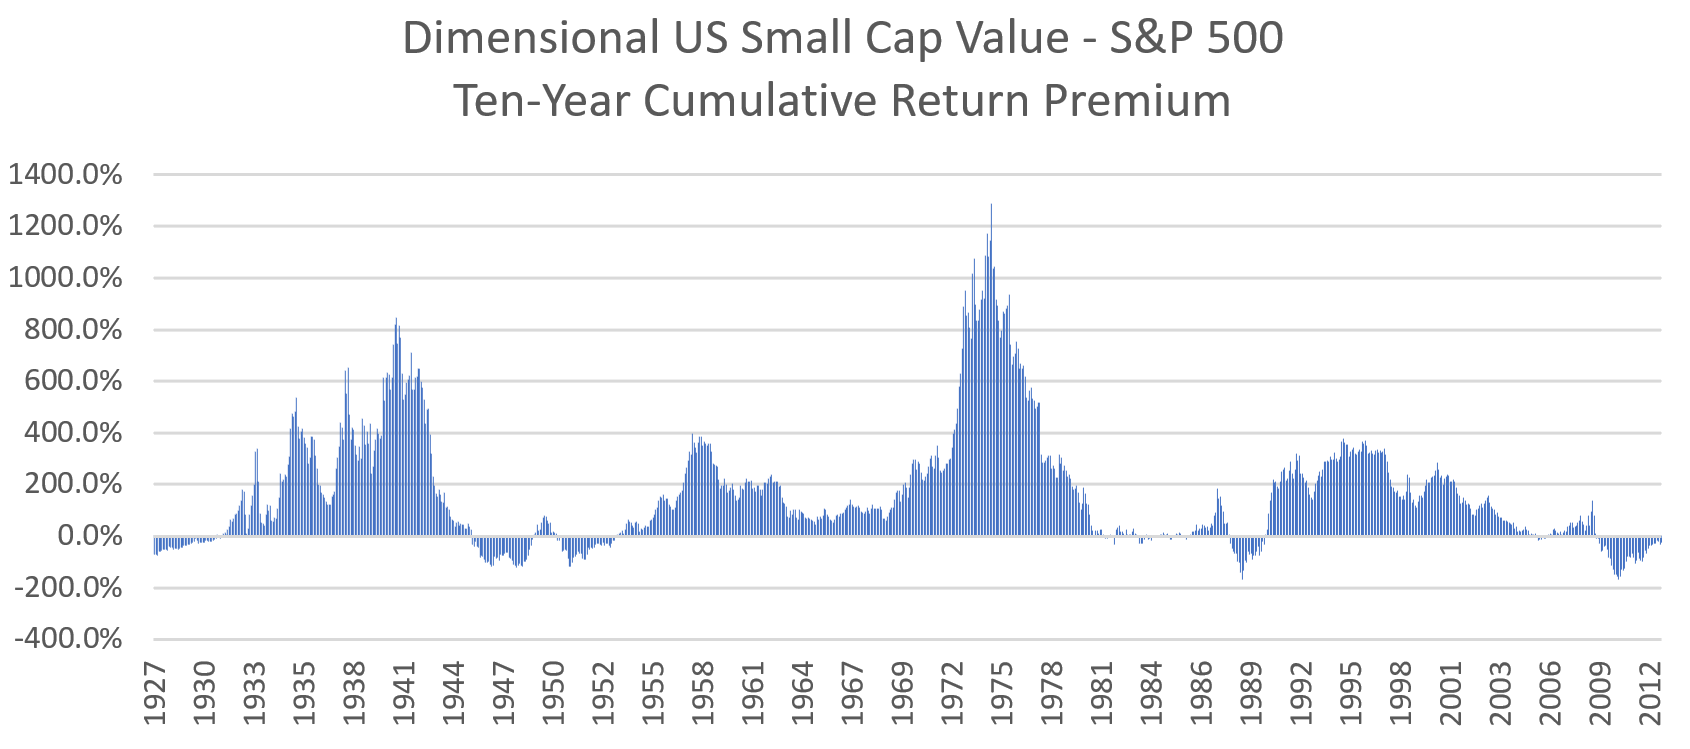
The median premium of small-cap value over S&P 500 is 107%.
There are fewer negative premiums.
There are many ten-year periods where the premium over S&P 500 is 200%.
Fifteen-Years Rolling Return from Jun 1927 to Jan 2023
There are 966 fifteen-year periods we can extract return data.
The 25th percentile fifteen-year cumulative return:
- Dimensional Small Cap Value Index: 550%
- S&P 500: 182%
Percentage of periods where returns were negative (there are 966 periods):
- Dimensional Small Cap Value Index: 1%
- S&P 500: 0.2%
Here is the value + small premium over large + blend:
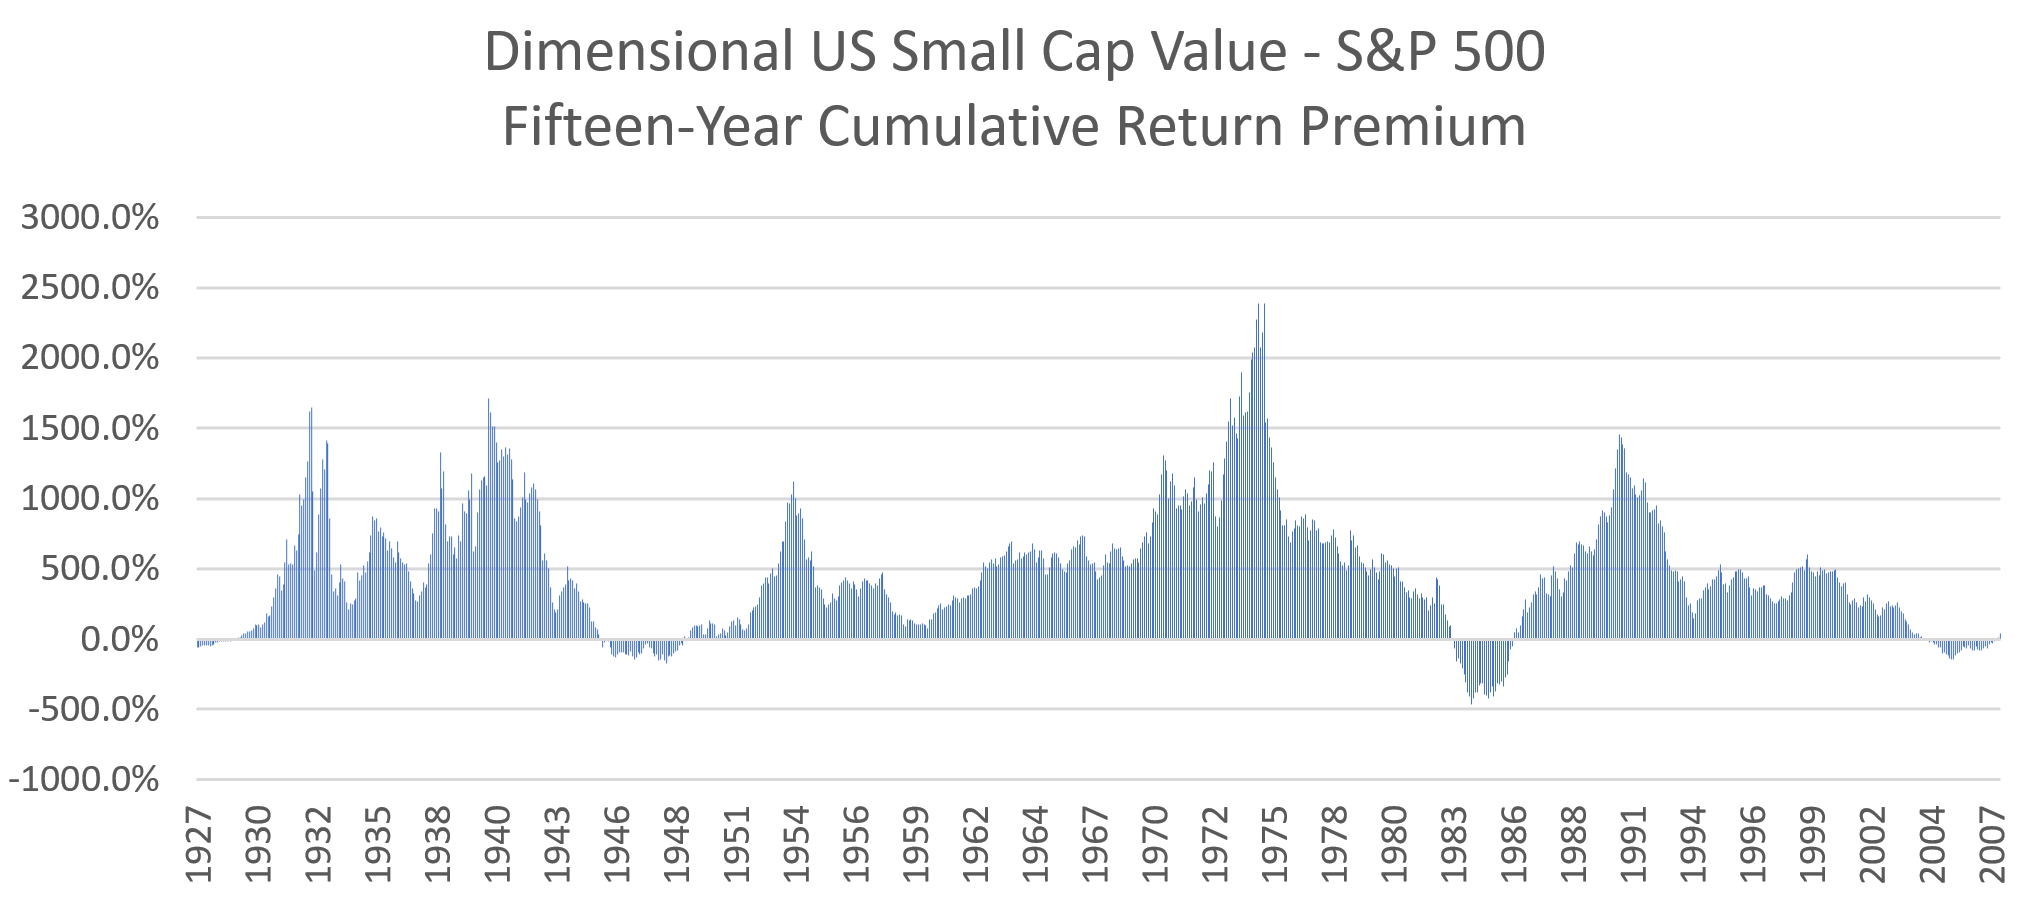
The median premium of small-cap value over S&P 500 is 428%.
Twenty-Years Rolling Return from Jun 1927 to Jan 2023
There are 906 fifteen-year periods we can extract return data.
The 25th percentile twenty-year cumulative return:
- Dimensional Small Cap Value Index: 1258%
- S&P 500: 368%
Percentage of periods where returns were negative (there are 906 periods):
- Dimensional Small Cap Value Index: 0%
- S&P 500: 0%
Here is the value + small premium over large + blend:
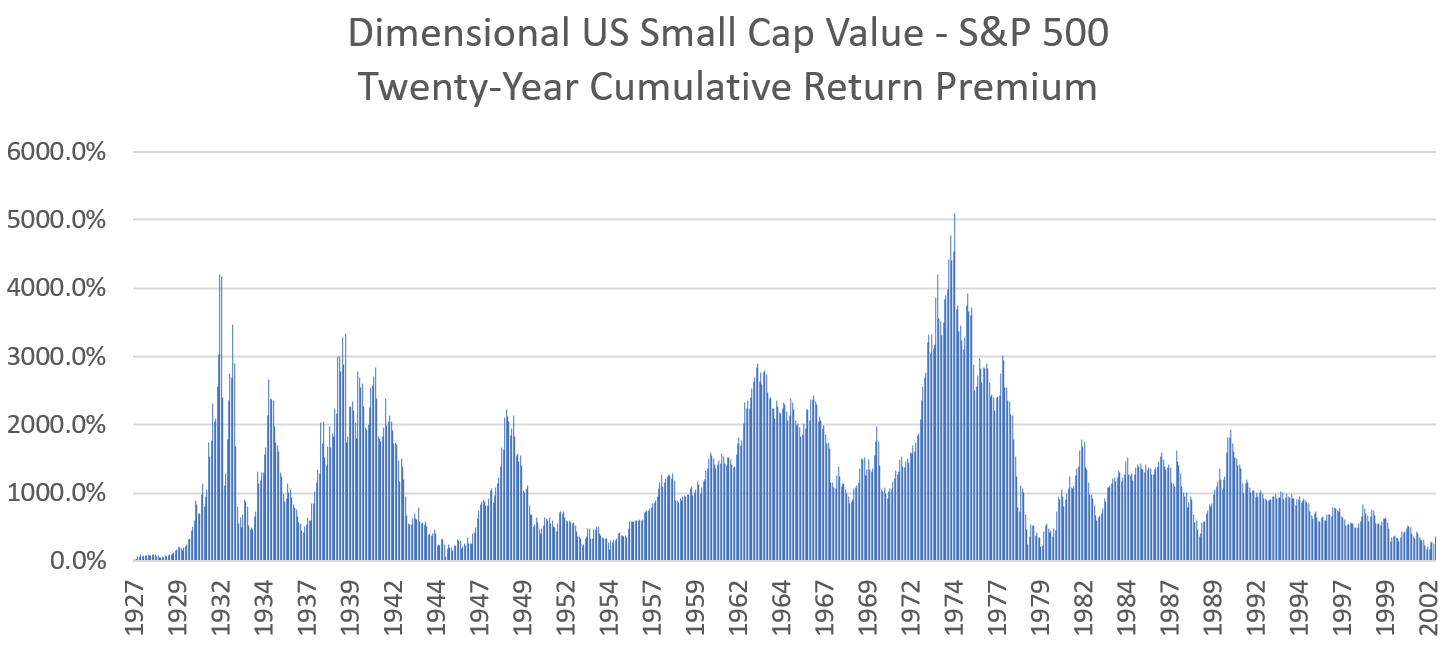
The median premium of small-cap value over S&P 500 is 1000%.
The more I look at the data, the more I agree equities are more like a twenty-year duration “bond”. This means that if you buy-and-hold shorter than twenty years, you may be unlucky to be negative. This is just like holding twenty-year treasury bill and then interest rate rise from 0.5% to 4% and you have a large unrealized loss.
If you hold the twenty-year treasury bill for 20-year, you should be ok.
The interesting thing is…. as returns of both S&P 500 and Dimensional Small Cap Value Index are all positive, EVERY TWENTY YEAR PERIOD, the Small Cap Value did better than all S&P 500 index.
Here are some other good articles on index investing.
I do have a few other data-driven Index ETF articles. These are suitable if you are interested in constructing a low-cost, well-diversified, passive portfolio.
You can check them out here:
- IWDA vs VWRA – Are Significant Performance Differences Between the Two Low-Cost ETFs?
- The Beauty of High Yield Bond Funds – What the Data Tells Us
- Searching for Higher Yield in Emerging Market Bonds
- The performance of investing in stocks that can Grow their Dividends for 7/10 years
- Should We Add MSCI World Small-Cap ETF (WSML) to Our Passive Portfolio?
- Review of the LionGlobal Infinity Global – A MSCI World Unit Trust Available for CPF OA Investment
- 222 Years of 60/40 Portfolio Shows Us Balanced Portfolio Corrections are Pretty Mild
- Actively managed funds versus Passive Peers Over the Longer Run – Data
- International Stocks vs the USA before 2010 – Data
- S&P 500 Index vs MSCI World Index Performance Differences Over One and Ten Year Periods – Data
Here are some supplements to sharpen your edge on low-cost, passive ETF investing:
Those who wish to set up their portfolio to capture better returns believe that certain factors such as value, size, quality, momentum and low volatility would do well over time and are willing to harvest these factors through ETFs and funds over time, here are some articles to get you started on factor investing passively:
- Introduction to factor investing / Smart Beta investing.
- IFSW – The iShares MSCI World Multi-factor ETF
- IWMO – The iShares MSCI World Momentum ETF
- GGRA – The WisdomTree Global Quality Dividend Growth UCITS ETF
- Investing in companies with strong economic moats through MOAT and GOAT.
- Robeco’s research into 151 years of Low Volatility Factor – Market returns with lower volatility that did well in different market regimes
- JPGL vs IFSW vs Dimensional Global Core vs SWDA – 22 years of 5-year and 10-year Rolling Returns Performance Comparison
- 98 Years of Data Shows the US Small Cap Value Premium over S&P 500
- 42 Years of data shows that Europe Small Cap Value premium over MSCI Europe
If you want to trade these stocks I mentioned, you can open an account with Interactive Brokers. Interactive Brokers is the leading low-cost and efficient broker I use and trust to invest & trade my holdings in Singapore, the United States, London Stock Exchange and Hong Kong Stock Exchange. They allow you to trade stocks, ETFs, options, futures, forex, bonds and funds worldwide from a single integrated account.
You can read more about my thoughts about Interactive Brokers in this Interactive Brokers Deep Dive Series, starting with how to create & fund your Interactive Brokers account easily.
Kyith is the Owner and Sole Writer behind Investment Moats. Readers tune in to Investment Moats to learn and build stronger, firmer wealth foundations, how to have a Passive investment strategy, know more about investing in REITs and the nuts and bolts of Active Investing.
Readers also follow Kyith to learn how to plan well for Financial Security and Financial Independence.
Kyith worked as an IT operations engineer from 2004 to 2019. Currently, he works as a Senior Solutions Specialist in Insurance Start-up Havend. All opinions on Investment Moats are his own and does not represent the views of Providend.
You can view Kyith's current portfolio here, which uses his Free Google Stock Portfolio Tracker.
His investment broker of choice is Interactive Brokers, which allows him to invest in securities from different exchanges all over the world, at very low commission rates, without custodian fees, near spot currency rates.
You can read more about Kyith here.
- My Dividend Experience Investing in UCITS iShares iBond Maturing in 2028. - April 23, 2024
- We Invest into Popular Funds When They Are Popular, Exactly When They Started Turning to Shxt. - April 22, 2024
- Meal Prep 2.0 – Cooking Your “Go-to” Meal that You Look Forward to Eating Everyday. - April 21, 2024
Simon Says
Saturday 1st of July 2023
Hi, Kyith.
Do you mind running the same analysis but using a monthly dollar-cost-averaging approach as opposed to the lump sum investing approach in this article?
I am curious to see if there would be any material differences in the results. My bet is the premium of small-cap value over S&P500 will be even higher across all timeframes, given how much more volatile the small-caps are than the S&P500!
Kyith
Sunday 2nd of July 2023
HI Simon Says, that will be difficult unless I coded that in!
Revhappy
Thursday 30th of March 2023
Another data point https://mobile.twitter.com/TimmerFidelity/status/1641134625593651200
Thanks for your analysis. So over long term small cap value does well, I guess some tilt to SCV is good. I know Larry Swedroe is big fan of this strategy.
In the end the biggest determinant of our portfolio performance is how much patience we are going to have sticking to our allocation in down markets. 15 years sound like a lifetime.
Kyith
Sunday 2nd of April 2023
The biggest premium is still taking risk with equities over risk free bonds. And for small cap it is very behavioural. the volatility can be high.
Sinkie
Tuesday 28th of March 2023
Seems the moral of the story is expect crappy returns from small value within 10 years especially if there's a bear market or crash within that timeframe.
The outperformance only really shows up after 15 yrs of holding.
Kyith
Tuesday 28th of March 2023
how do you derive the crap returns within 10 years. does it show like it coincides current period?
Revhappy
Tuesday 28th of March 2023
Hi Kyith,
I never meant to rub it in. Apologies if it came across that way. I watched the compound podcast and Josh and Michael share some ratio charts about QQQ outperforming value stocks.