Yesterday, I presented some of the data research I carried out on the small-cap value premium for the US market.
Today, here is the data behind the premium over in Europe.
We compute the rolling cumulative returns of the Dimensional Small Value index over the MSCI Europe index to determine the premium of small plus value over a large blend in Europe.
The data in Europe only starts around 1981, which means we have 42 years of data. There is fewer data over the US but nevertheless, we can see if there exist a premium consistently.
I like to look at Europe for two reasons. One, it is not the US, and we can see the performance of a region that is likely less popular than the US. Secondly, Europe is so hated. If small + value are style factors, they should be pervasive and persistent in Europe as well.
Five-Years Rolling Return from Jun 1981 to Jan 2023
There are 445 five-year periods we can extract return data.
I will give you the 25th percentile five-year cumulative return because the 25th percentile is a pessimistic/unlucky investor return. The 50th percentile is the median.
- Dimensional Europe Small Cap Value Index: 34.1%
- MSCI Europe Index: 12.4%
Percentage of periods where returns were negative (there are 445 periods):
- Dimensional Europe Small Cap Value Index: 7.4%
- MSCI Europe Index: 11.9%
Here is the value + small premium over large + blend
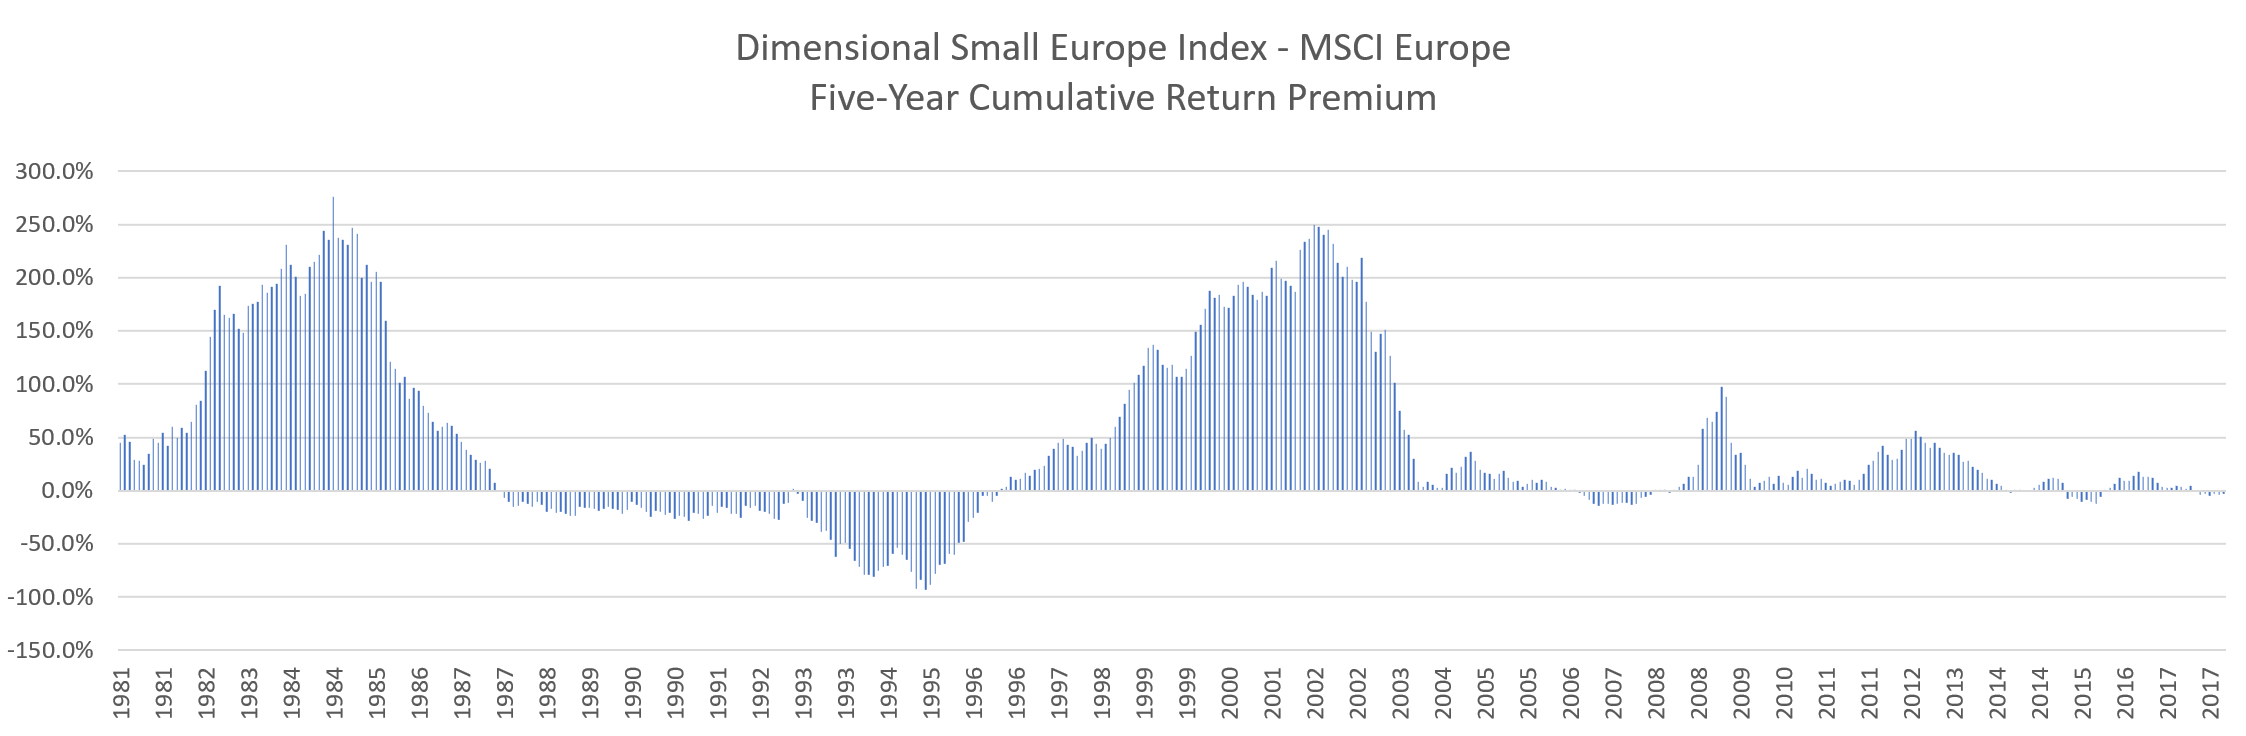
The median premium of small-cap value over MSCI Europe is 12.8%.
Somehow, you notice that the premium are skewed by two periods where the premiums are very high, which brings up the average. The negative premiums in the 1980s and 1990s is big. In this current period, there is a premium but it is very small.
Ten-Years Rolling Return from Jun 1981 to Jan 2023
There are 385 five-year periods we can extract return data.
The 25th percentile ten-year cumulative return:
- Dimensional Europe Small Cap Value Index: 130%
- MSCI Europe Index: 64%
Percentage of periods where returns were negative (there are 385 periods):
- Dimensional Europe Small Cap Value Index: 0%
- MSCI Europe Index: 0.8%
Here is the value + small premium over large + blend
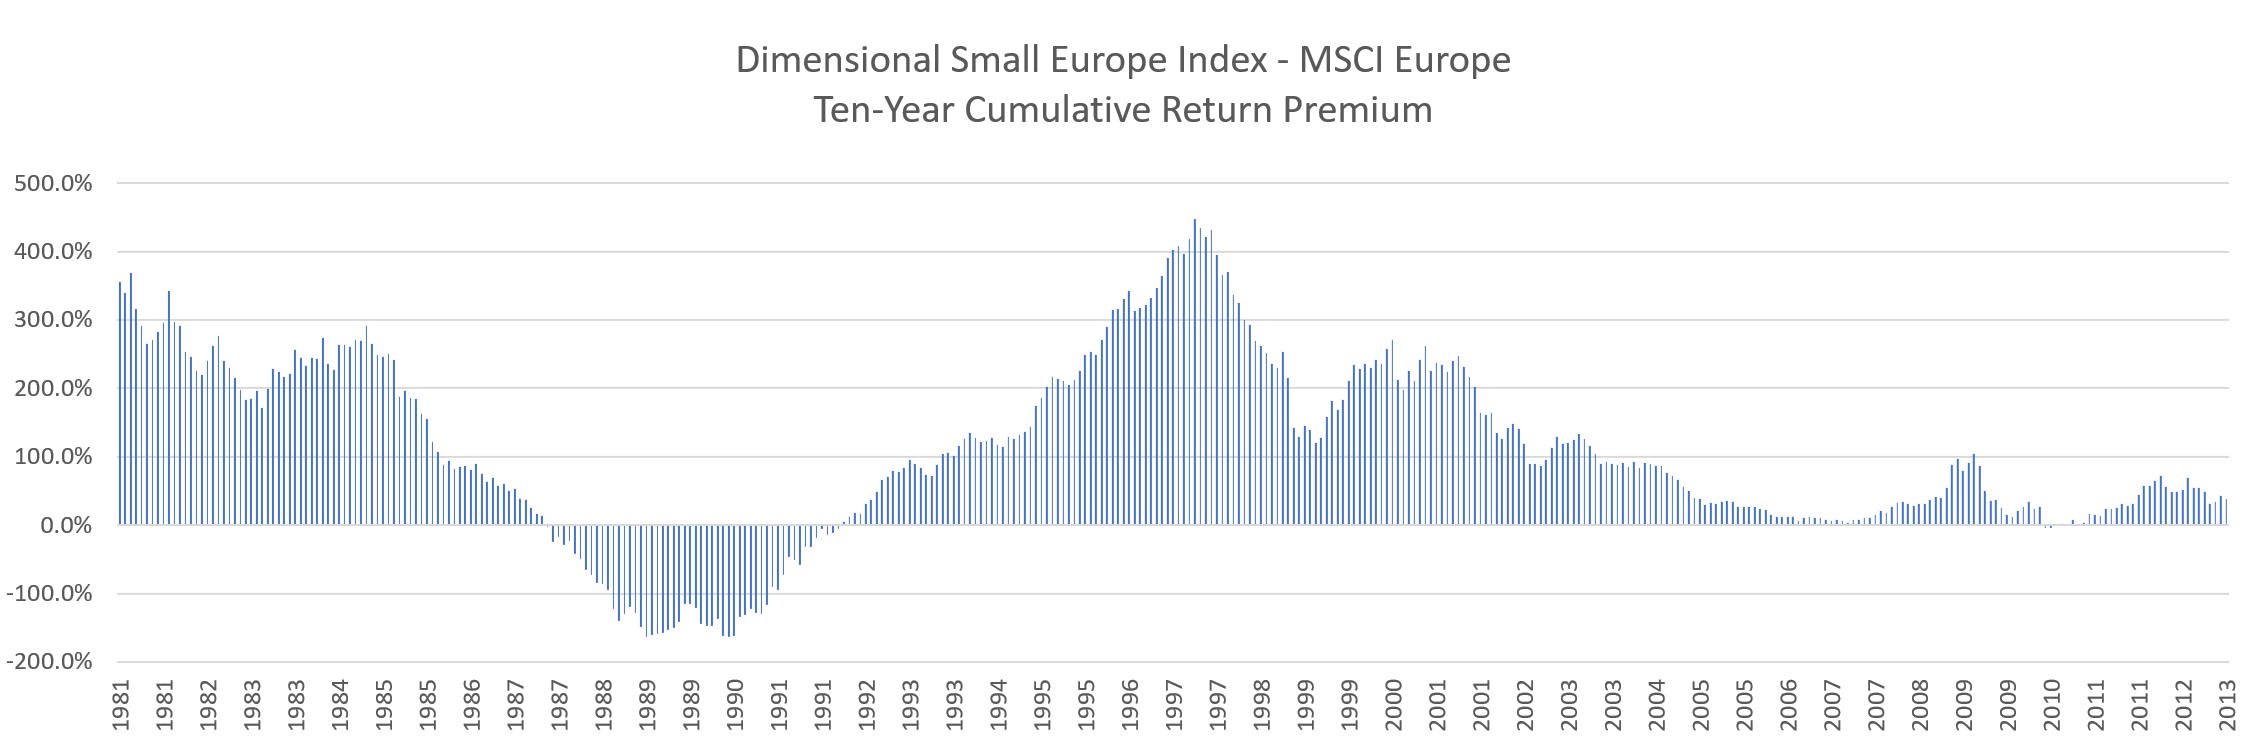
The median premium of small-cap value over MSCI Europe is 88.6%.
The number of periods where returns are negative is close to zero.
Fifteen-Years Rolling Return from Jun 1981 to Jan 2023
There are 325 five-year periods we can extract return data.
The 25th percentile fifteen-year cumulative return:
- Dimensional Europe Small Cap Value Index: 341%
- MSCI Europe Index: 101%
Percentage of periods where returns were negative (there are 325 periods):
- Dimensional Europe Small Cap Value Index: 0%
- MSCI Europe Index: 0%
Here is the value + small premium over large + blend
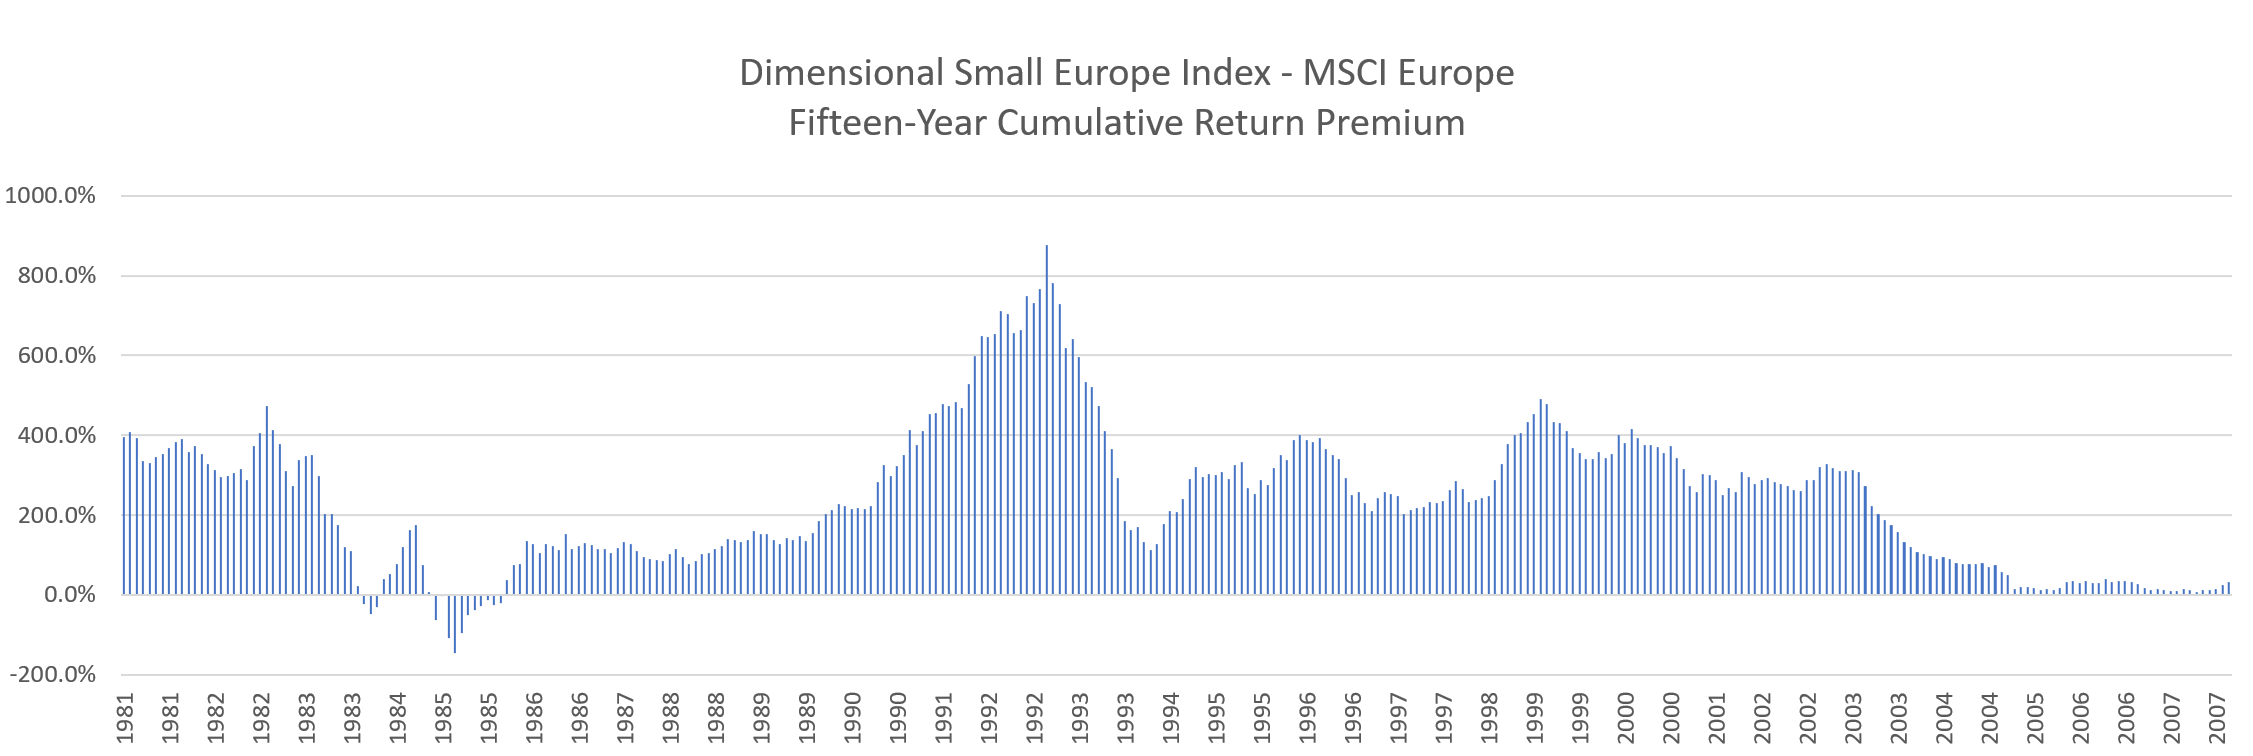
The median premium of small-cap value over MSCI Europe is 243%.
Twenty-Years Rolling Return from Jun 1981 to Jan 2023
There are 265 five-year periods we can extract return data.
The 25th percentile twenty-year cumulative return:
- Dimensional Europe Small Cap Value Index: 646%
- MSCI Europe Index: 214%
Percentage of periods where returns were negative (there are 265 periods):
- Dimensional Europe Small Cap Value Index: 0%
- MSCI Europe Index: 0%
Here is the value + small premium over large + blend
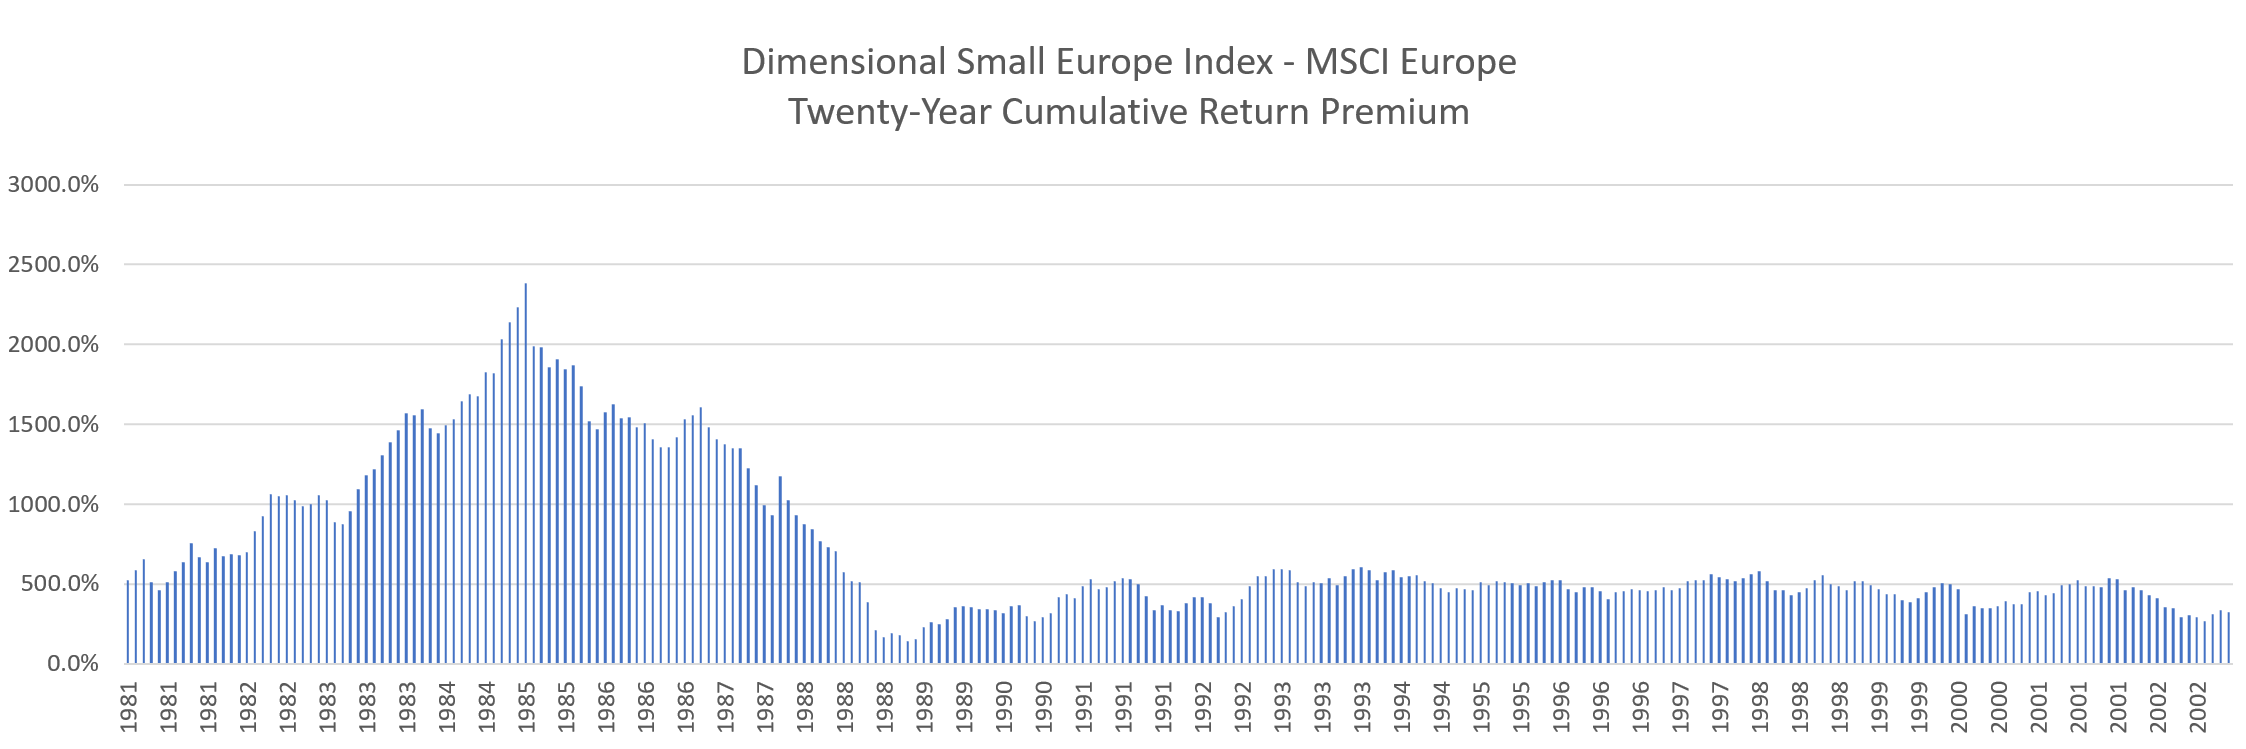
The median premium of small-cap value over MSCI Europe is 512%.
I do have a few other data-driven Index ETF articles. These are suitable if you are interested in constructing a low-cost, well-diversified, passive portfolio.
You can check them out here:
- IWDA vs VWRA – Are Significant Performance Differences Between the Two Low-Cost ETFs?
- The Beauty of High Yield Bond Funds – What the Data Tells Us
- Searching for Higher Yield in Emerging Market Bonds
- The performance of investing in stocks that can Grow their Dividends for 7/10 years
- Should We Add MSCI World Small-Cap ETF (WSML) to Our Passive Portfolio?
- Review of the LionGlobal Infinity Global – A MSCI World Unit Trust Available for CPF OA Investment
- 222 Years of 60/40 Portfolio Shows Us Balanced Portfolio Corrections are Pretty Mild
- Actively managed funds versus Passive Peers Over the Longer Run – Data
- International Stocks vs the USA before 2010 – Data
- S&P 500 Index vs MSCI World Index Performance Differences Over One and Ten Year Periods – Data
Here are some supplements to sharpen your edge on low-cost, passive ETF investing:
Those who wish to set up their portfolio to capture better returns believe that certain factors such as value, size, quality, momentum and low volatility would do well over time and are willing to harvest these factors through ETFs and funds over time, here are some articles to get you started on factor investing passively:
- Introduction to factor investing / Smart Beta investing.
- IFSW – The iShares MSCI World Multi-factor ETF
- IWMO – The iShares MSCI World Momentum ETF
- GGRA – The WisdomTree Global Quality Dividend Growth UCITS ETF
- Investing in companies with strong economic moats through MOAT and GOAT.
- Robeco’s research into 151 years of Low Volatility Factor – Market returns with lower volatility that did well in different market regimes
- JPGL vs IFSW vs Dimensional Global Core vs SWDA – 22 years of 5-year and 10-year Rolling Returns Performance Comparison
- 98 Years of Data Shows the US Small Cap Value Premium over S&P 500
- 42 Years of data shows that Europe Small Cap Value premium over MSCI Europe
If you want to trade these stocks I mentioned, you can open an account with Interactive Brokers. Interactive Brokers is the leading low-cost and efficient broker I use and trust to invest & trade my holdings in Singapore, the United States, London Stock Exchange and Hong Kong Stock Exchange. They allow you to trade stocks, ETFs, options, futures, forex, bonds and funds worldwide from a single integrated account.
You can read more about my thoughts about Interactive Brokers in this Interactive Brokers Deep Dive Series, starting with how to create & fund your Interactive Brokers account easily.
Kyith is the Owner and Sole Writer behind Investment Moats. Readers tune in to Investment Moats to learn and build stronger, firmer wealth foundations, how to have a Passive investment strategy, know more about investing in REITs and the nuts and bolts of Active Investing.
Readers also follow Kyith to learn how to plan well for Financial Security and Financial Independence.
Kyith worked as an IT operations engineer from 2004 to 2019. Currently, he works as a Senior Solutions Specialist in Insurance Start-up Havend. All opinions on Investment Moats are his own and does not represent the views of Providend.
You can view Kyith's current portfolio here, which uses his Free Google Stock Portfolio Tracker.
His investment broker of choice is Interactive Brokers, which allows him to invest in securities from different exchanges all over the world, at very low commission rates, without custodian fees, near spot currency rates.
You can read more about Kyith here.
- My Dividend Experience Investing in UCITS iShares iBond Maturing in 2028. - April 23, 2024
- We Invest into Popular Funds When They Are Popular, Exactly When They Started Turning to Shxt. - April 22, 2024
- Meal Prep 2.0 – Cooking Your “Go-to” Meal that You Look Forward to Eating Everyday. - April 21, 2024