In a recent research article, Dutch research-focused asset manager Robeco showed why they prefer to lean towards conservative factor strategies.
There are some interesting data presented.
Robeco helped to construct its dataset of US historical market returns, dividend yields and market capitalisations from 1866 to 1926. This dataset extends the current data from 1926 to the present day. You can read more about how the dataset is constructed here.
Conservative factor strategies are interesting to you because:
- The methodology periodically screens a basket of more resilient stocks during market downturns.
- The basket of stocks also participates in capturing enough upside.
We may then achieve a portfolio with lower volatility while fulfilling more risk-averse investor’s objectives.
We may see whether these conservative screenings work over different periods with this wider dataset.
The Methodology Used
Robeco adopted a rather multifactor strategy.
Here is what they did:
- From the 1,000 largest stocks, select the 500 with the lowest volatility
- From the subset in #1, choose the 100 stocks with the best net dividend payout yield and price momentum
- Rebalance the portfolio every quarter
Low volatility is an anomaly. Based on traditional finance theories, if the risk of a security is higher, the security needs a higher return to compensate for it and vice-versa. But low volatility kinda shows this is not the case.
Recently, I leaned toward the idea that eventually, what matters the most is how cheap things are and the momentum.
Screening for low volatile companies tends to lead us to consumer staples, which can be expensive. By layering dividend yield, we would select the low volatile stocks that are cheaper (dividend yield, in this case, is used as a valuation metric).
Lower-risk stocks have higher returns.
Other than using the conservative formula explained in the previous section, the team split the returns of stocks into ten different buckets based on their three-year volatility. The lowest number is the least risky basket of stocks:
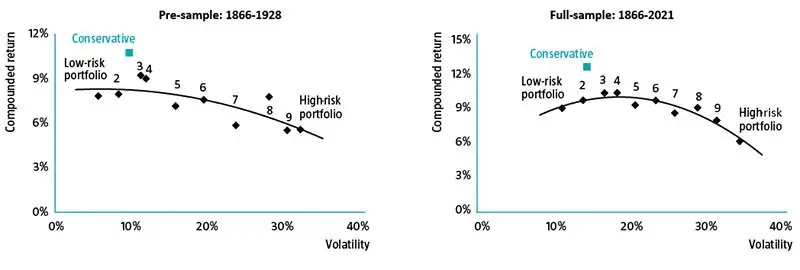
The team shows the results for both pre-1928 data and the full period to see if there is a difference.
The relationship between risk and return was negative over the 1866-1928 period as higher-risk portfolios underperformed their lower-risk counterparts. This means that taking additional risks on the stock market was not rewarded. The picture is broadly similar over the full sample period, albeit returns initially increase along with risk before trending down again as the volatility increases. This informs us that taking on more risk is not necessarily rewarded in the long run.
We can observe the light blue Conservative box in both charts. This shows that the conservative strategy produces a portfolio with higher risk-adjusted returns.
Conservative and Speculative Stocks During Different Decades
The team then pit the conservative strategy against a portfolio of the opposite ( high volatility, low net dividend payout, low momentum) and views the performance over individual decades:
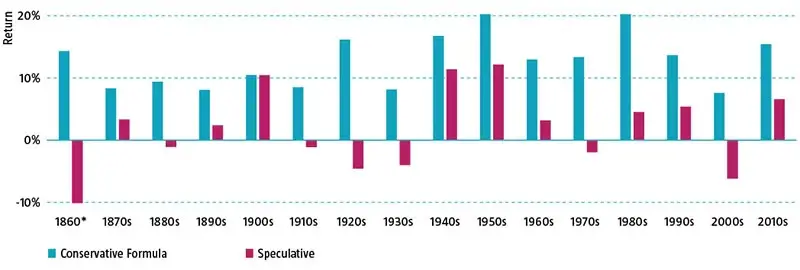
The returns of the conservative strategy are damn consistent.
This is either data-mining at its finest, or we found the holy grail.
I would also be interested to find out how well a portfolio of low volatility stocks would do without additional value screens.
Conservative Strategy Win by Losing Less
The conservative strategy works like trying to win in an amateur tennis game. We win not by being better but by making fewer errors.
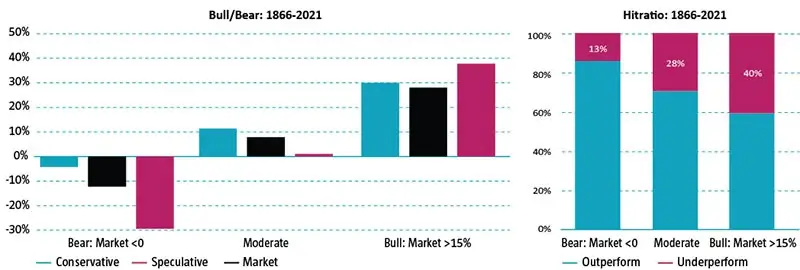
The diagram above shows the performance of the strategies when market returns are less than zero and more than 15%.
This may make the investing experience more livable.
However, we will also need to note that this is not always the case. Although 87% of the time, the conservative strategy outperforms in a bear market, 13% of the time, there is underperformance.
Conservative Strategy Did Well Across Various Regimes
Finally, the team tries to find out how the strategy did during various market regimes:

Equities do well over various market regimes except for deflation and recession. The Robeco conservative strategy did well during different regimes with higher uncertainty.
Looks pretty good but again, it will be interesting to see if how much of this is helped by adopting a more multifactor approach than plainly buying a low volatile portfolio.
I do have a few other data-driven Index ETF articles. These are suitable if you are interested in constructing a low-cost, well-diversified, passive portfolio.
You can check them out here:
- IWDA vs VWRA – Are Significant Performance Differences Between the Two Low-Cost ETFs?
- The Beauty of High Yield Bond Funds – What the Data Tells Us
- Searching for Higher Yield in Emerging Market Bonds
- The performance of investing in stocks that can Grow their Dividends for 7/10 years
- Should We Add MSCI World Small-Cap ETF (WSML) to Our Passive Portfolio?
- Review of the LionGlobal Infinity Global – A MSCI World Unit Trust Available for CPF OA Investment
- 222 Years of 60/40 Portfolio Shows Us Balanced Portfolio Corrections are Pretty Mild
- Actively managed funds versus Passive Peers Over the Longer Run – Data
- International Stocks vs the USA before 2010 – Data
- S&P 500 Index vs MSCI World Index Performance Differences Over One and Ten Year Periods – Data
Here are some supplements to sharpen your edge on low-cost, passive ETF investing:
Those who wish to set up their portfolio to capture better returns believe that certain factors such as value, size, quality, momentum and low volatility would do well over time and are willing to harvest these factors through ETFs and funds over time, here are some articles to get you started on factor investing passively:
- Introduction to factor investing / Smart Beta investing.
- IFSW – The iShares MSCI World Multi-factor ETF
- IWMO – The iShares MSCI World Momentum ETF
- GGRA – The WisdomTree Global Quality Dividend Growth UCITS ETF
- Investing in companies with strong economic moats through MOAT and GOAT.
- Robeco’s research into 151 years of Low Volatility Factor – Market returns with lower volatility that did well in different market regimes
- JPGL vs IFSW vs Dimensional Global Core vs SWDA – 22 years of 5-year and 10-year Rolling Returns Performance Comparison
- 98 Years of Data Shows the US Small Cap Value Premium over S&P 500
- 42 Years of data shows that Europe Small Cap Value premium over MSCI Europe
I invested in a diversified portfolio of exchange-traded funds (ETF) and stocks listed in the US, Hong Kong and London.
My preferred broker to trade and custodize my investments is Interactive Brokers. Interactive Brokers allow you to trade in the US, UK, Europe, Singapore, Hong Kong and many other markets. Options as well. There are no minimum monthly charges, very low forex fees for currency exchange, very low commissions for various markets.
To find out more visit Interactive Brokers today.
Join the Investment Moats Telegram channel here. I will share the materials, research, investment data, deals that I come across that enable me to run Investment Moats.


Do Like Me on Facebook. I share some tidbits that are not on the blog post there often. You can also choose to subscribe to my content via the email below.
I break down my resources according to these topics:
- Building Your Wealth Foundation – If you know and apply these simple financial concepts, your long term wealth should be pretty well managed. Find out what they are
- Active Investing – For active stock investors. My deeper thoughts from my stock investing experience
- Learning about REITs – My Free “Course” on REIT Investing for Beginners and Seasoned Investors
- Dividend Stock Tracker – Track all the common 4-10% yielding dividend stocks in SG
- Free Stock Portfolio Tracking Google Sheets that many love
- Retirement Planning, Financial Independence and Spending down money – My deep dive into how much you need to achieve these, and the different ways you can be financially free
- Providend – Where I used to work doing research. Fee-Only Advisory. No Commissions. Financial Independence Advisers and Retirement Specialists. No charge for the first meeting to understand how it works
- Havend – Where I currently work. We wish to deliver commission-based insurance advice in a better way.
Kyith is the Owner and Sole Writer behind Investment Moats. Readers tune in to Investment Moats to learn and build stronger, firmer wealth foundations, how to have a Passive investment strategy, know more about investing in REITs and the nuts and bolts of Active Investing.
Readers also follow Kyith to learn how to plan well for Financial Security and Financial Independence.
Kyith worked as an IT operations engineer from 2004 to 2019. Currently, he works as a Senior Solutions Specialist in Insurance Start-up Havend. All opinions on Investment Moats are his own and does not represent the views of Providend.
You can view Kyith's current portfolio here, which uses his Free Google Stock Portfolio Tracker.
His investment broker of choice is Interactive Brokers, which allows him to invest in securities from different exchanges all over the world, at very low commission rates, without custodian fees, near spot currency rates.
You can read more about Kyith here.
- My Dividend Experience Investing in UCITS iShares iBond Maturing in 2028. - April 23, 2024
- We Invest into Popular Funds When They Are Popular, Exactly When They Started Turning to Shxt. - April 22, 2024
- Meal Prep 2.0 – Cooking Your “Go-to” Meal that You Look Forward to Eating Everyday. - April 21, 2024
Sinkie
Sunday 24th of July 2022
Most multi-factor funds underperform, perhaps due to fees>outperformance, according to a recent research: https://www.msn.com/en-us/news/markets/multi-factor-etfs-are-missing-this-one-big-factor/ar-AAZPQmV
Link to the research paper in the above short article.
You may want to open the paper to find out which are the funds that outperformed LOL.
Only 1 for the US market, a bit more for non-US markets.
Revhappy
Tuesday 26th of July 2022
@Kyith,
I just feel fussing over the strategies and fees etc is a bit of missing forest for the trees. Most of the returns is based on investor behaviour, whether the investor is able to hold on to an asset allocation for long duration and keep saving and investing over their 30 year career, they will do well regardless.
Sinkie
Monday 25th of July 2022
It works like active investing ... you just need to find your secret sauce. Or the 5% to 15% institutional investors who can do it consistently over 40+ years.
Kyith
Monday 25th of July 2022
So do you think that it doesn't work?