Recently, I had to do some profiling of local unit trusts to identify whether there are some funds with good long term performances.
If we are able to spot them, we can then do a deeper dive to understand their investment philosophy better.
Sadly the exercise left me disappointed personally. I thought there would be some gems but unfortunately, there were only a handful of funds that were able to do well in the category we evaluate them in.
Ben Johnson from Morningstar recently updated us on the results from their annual Morningstar Active/Passive Barometer report that active funds notice the same thing.
This isn’t new.
I am quite sure that there are rare funds that will outperform the index over the 20-year period but the tough thing is to be able to identify them before that 20-year period. If your friend refers a great fund that did well over the very long run, it is very likely that the fund is being measured against the wrong barometer.
There are some folks out there who, in an effort to show that they are great investment fund pickers, compare their selection against an absolutely different fund category. That is probably the wrong way the evaluate active fund performance.
In today’s article, I will list out some of the bigger takeaways from the 2021 Morningstar Active/Passive Barometer report.
What is the Morningstar Active/Passive Barometer?
The Morningstar Active/Passive Barometer is a report that measures the performance of U.S. active managers against their passive peers within their respective categories.
It measures the active managers’ success relative to the actual, net-of-fee performance of passive funds (rather than the index).
What the report serves to answer:
If an investor were to select an actively managed fund at random from a category, what are the odds that the fund will survive and outperform its passive peers in any given time period?
Success is Relative to Comparable Passive Alternatives
Too often, people make comparisons using the oddest metrics.
Morningstar measures the active managers’ success against investable passive alternatives in the same category.
This means that if you manage an active fund that is in the U.S Mid-Cap Blend space, they will compare your fund to a mid-cap blend passive ETF.
In this way, we are able to see if you, as the active manager added alpha compared to something similar.
This is much better than comparing everything against the SPY or the SPDR S&P 500 ETF Trust.
Why Compare Against Passive Index Funds Rather Than Compare Against Index?
Morningstar believes that measuring against index funds is better because you cannot invest in the actual index.
The index also does not account for the real cost but passive index funds do.
There are known costs for packaging and distributing indexes in investable format and if you compare against the index, these are not accounted for.
In this way, Morningstar accounts for the frictions but also mitigate the effects that might stem from cherry-picking a single index as a performance benchmark.
How Many Funds Are Measured?
The data source is from Morningstar’s US open-ed and exchange-traded funds database.
To be included the mutual fund or ETF needs to have asset data for at least one share class in the month prior to the start of the sample period (beginning of trailing 1, 3, 5, 10, 15, 20 year period) to facilitate calculation.
There are about 4,000 funds in the database that fit the criteria, which in total account for about $18.7 trillion in investor assets or about 67% of the US fund market. This sounds like the majority of the funds out there are still actively managed.
How Success Rate In this Report is Calculated
Success rate indicates the percentage of funds that start that went on to survive and generate a return in excess of the equal-weighted average passive fund over the period.
Success Rate = Ratio of the number of active funds that both survive and outperformed the average of the passive peers to the number of funds at the start of the period (which includes the funds that didn’t survive)
Not every fund that peopld invest will survive
New fund investors may only be aware later that not all the funds you invest in will survive. The performance may be poor, or the fund size dwindle or did not grow. Usually, they will either close down or be rolled and combined into another fund.
What this means is that many funds can start but not finish off.
So Morningstar includes the funds that don’t survive at the end in the success rate calculation. So if a category starts off with 1000 funds but at the end of the period, only 700 funds are left, that 300 funds factor into the failure rate.
Why Asset-Weighted Average Performance is Used
Asset-Weighted Return is calculated using each share class’ monthly assets and returns. When a fund becomes obsolete, its historical data remains in the sample.
Asset-Weighted Return will weigh the return based on the amount invested.
So you can imagine that for a fund like ARK Innovation, where most of the money comes piling in after Cathie Woods are in the news, the performance after the fund assets size balloon, which is poorer, will be weighted more heavily than when the fund asset size is smaller during the early days when they were not so in the news.
Using Asset-Weighted Average Performance factors in the behavioural part of many of us who only get invested after seeing good performances.
A fund is truly good if its performance is still great even when the fund size increases.
How Ranking is Done
Morningstar then ranks these composite fund returns from highest to lowest and count the number of funds whose returns exceed the equal-weighted average of the passive funds in the category.
So here are some of the data.
Active Funds Have Low Success Rates In Beating or Surviving Against Passive Peers

This table summarizes the success rates of the active funds in each category, in different time frames. Morningstar also breaks down between those that are the most costly and least costly.
The first thing you will notice is that as the number of years progresses the success rate of active funds beating passive peers or surviving goes down.
On a 1-year timeframe, it is a bit like if you have 3 funds, 1 of them would beat their passive peers in a 1-year timeframe. 3-year & 5-year is about the same. Beyond 10-years the success rates start going down.
There are some categories where the odds of lending on a fund that outperforms is still high. These are:
- US Mid Growth
- US Small Growth
- Foreigh Large Blend, Large Value, Small-Mid Blend
- Diversified Emerging Markets
- Europe Stock
- US Real Estate
- Global Real Estate
- High-Yield Bond
Generally, the lowest cost fund has higher success rates than the highest cost ones, with the exception of US Mid Value, US Small Growth and Global Real Estate.
Cost is definitely an important return performance measure.
Investors Were Able to Select Above Average Funds Well
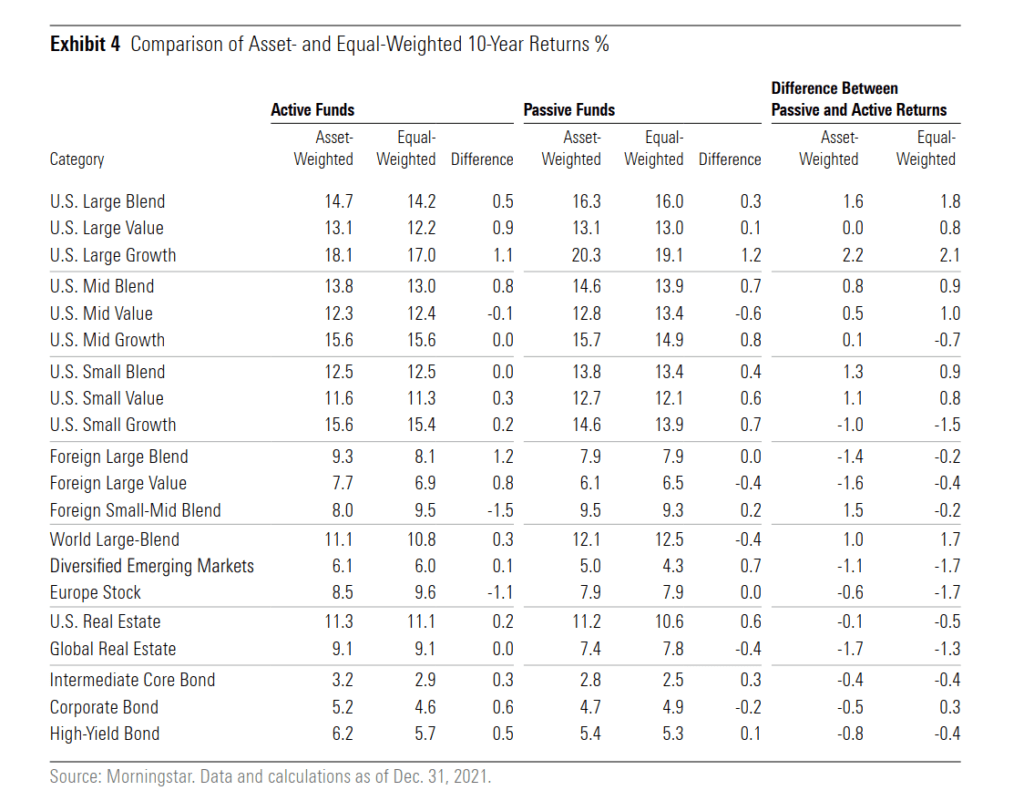
If you compare the asset-weighted returns to the equal-weighted returns for the active funds, you would be able to observe as a cohort, whether the investors are putting their money in the right active funds, and getting good results out of it.
If the asset-weighted returns are higher than the equal-weighted returns, then the investors have done well.
Generally, the difference is positive for most except for US Mid Value, Foreign Small-Mid Blend and Europe Stock.
This data is surprising because I would have expected the asset-weighted returns to be worse due to our behavioural tendency to invest at the wrong time.
Generally, Active funds returns are lower than Passive Funds. This is regardless of whether we are comparing equal or asset-weighted.
There are exceptions. The following categories show better active fund returns than their passive peers:
- Foreign Large Blend
- Foreign Large Value
- Diversified Emerging Markets
- Europe Stock
- US Real Estate
- Global Real Estate
- All the bond categories
This does show that the US is a more efficient market and that it is kind of tough to do better than passive. Beyond that, some active managers can add value.
In real estate and bond funds, active managers can add value.
But perhaps the more important observation:
As a cohort, when measured against the right benchmark, the active returns are not too far off from the passive returns. The main difference in returns depends on your exposure to different geographical regions, size-class of stocks, bonds or equities. This may mean that instead of spending time thinking about whether it is active versus passive, we should think about what kind of portfolio we wish to structure first.
Diving into US Large Blend Fund Cohort
The report profiled a lot of different fund category types but I would just pick out a few that I am more interested in (or that you are likely more interested in)
US large caps have been performing well and many who invest in the S&P 500 will be interested to see how they perform versus the active funds.
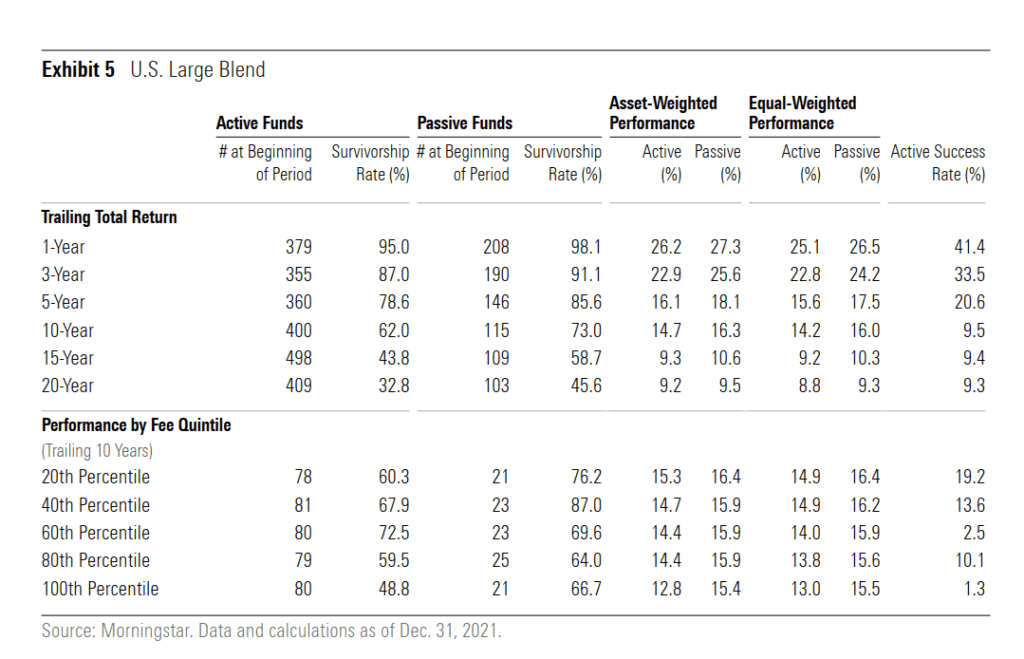
The first half of this factsheet shows you the number of active funds at the beginning of each time period and the number of funds that survive.
You can observe that both passive and active funds have attribution. The longer time period has lower survivorship.
for example, if you held the fund at the start of 2001, there is a 2 in 3 chance your fund will close down. It is that drastic. I guess this is the nature of the business that passive funds will close down as well.
The funds with higher fees tend to have lower survivorship. The percentage is higher for passive funds.
The returns of funds active or passive are pretty close.
Funds with higher fees tend to underperform their passive peers more.
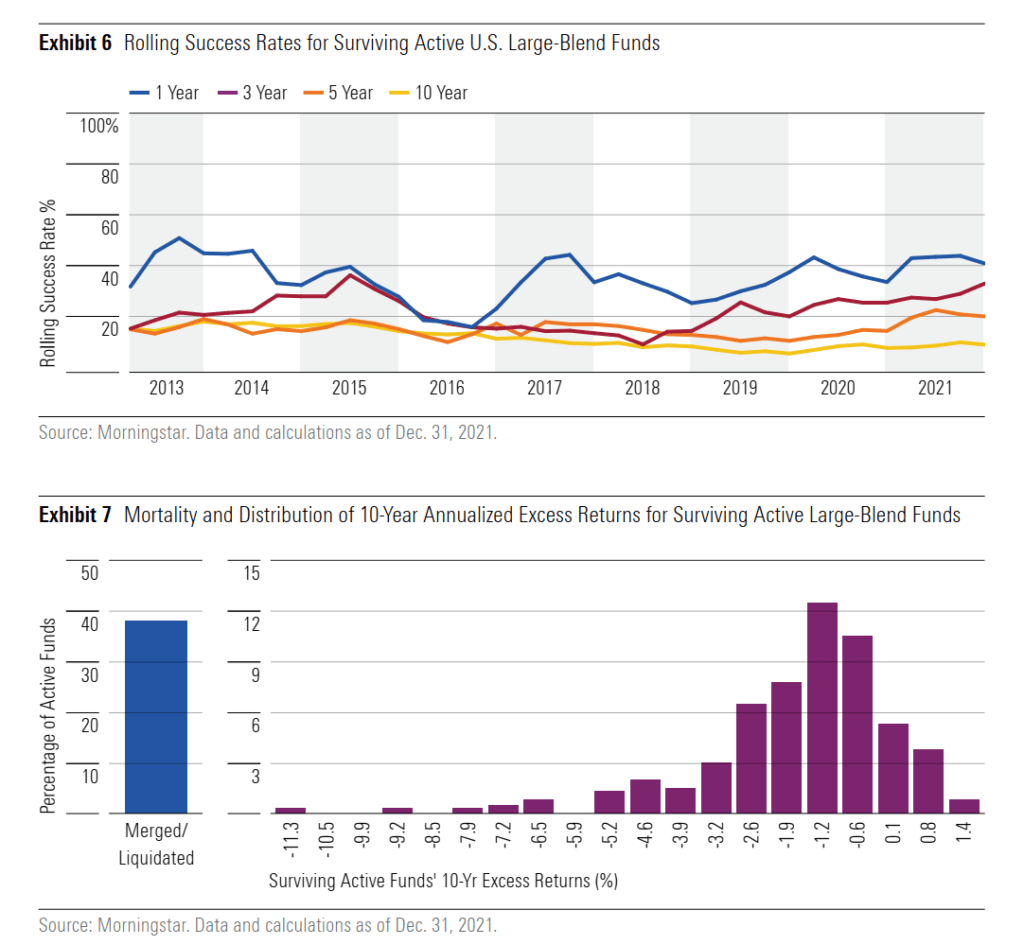
The top part (exhibit 6) shows the rolling success rates for the active US large blend funds. In certain time periods, the success rates may be higher. But for US large blend, the success rate is pretty consistent. Over 10-year periods the success rate of outperformance is very low!
Exhibit 7 shows the distribution of 10-year excess returns for those active large blend funds that managed to survive. It gives you a breakdown of the alpha of the surviving funds. The highest bar, which tends to be the median number of funds, is a negative -1.2%.
This shows that the majority of the active funds did worse than their passive peers on a 10-year basis.
Diving into World Large Blend Fund Cohort
This should match up to the MSCI World, which is what many would be interested in.
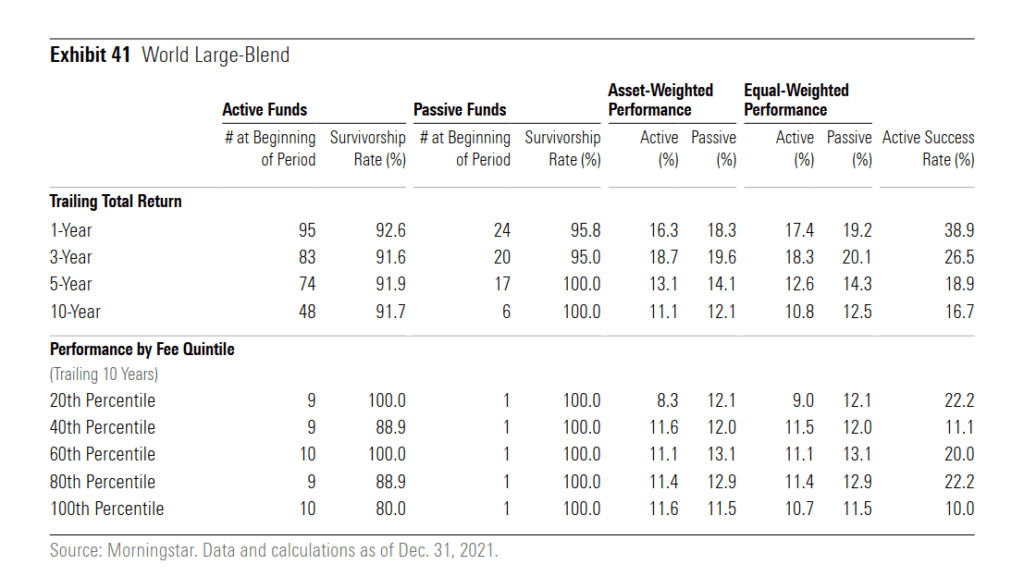
To be honest, there isn’t a lot of funds here.
The survivorship of the active funds is very high, unlike the rest!
In terms of return, passive funds return higher but the difference is not a lot.
Costlier active or passive funds do not show greater underperformance.
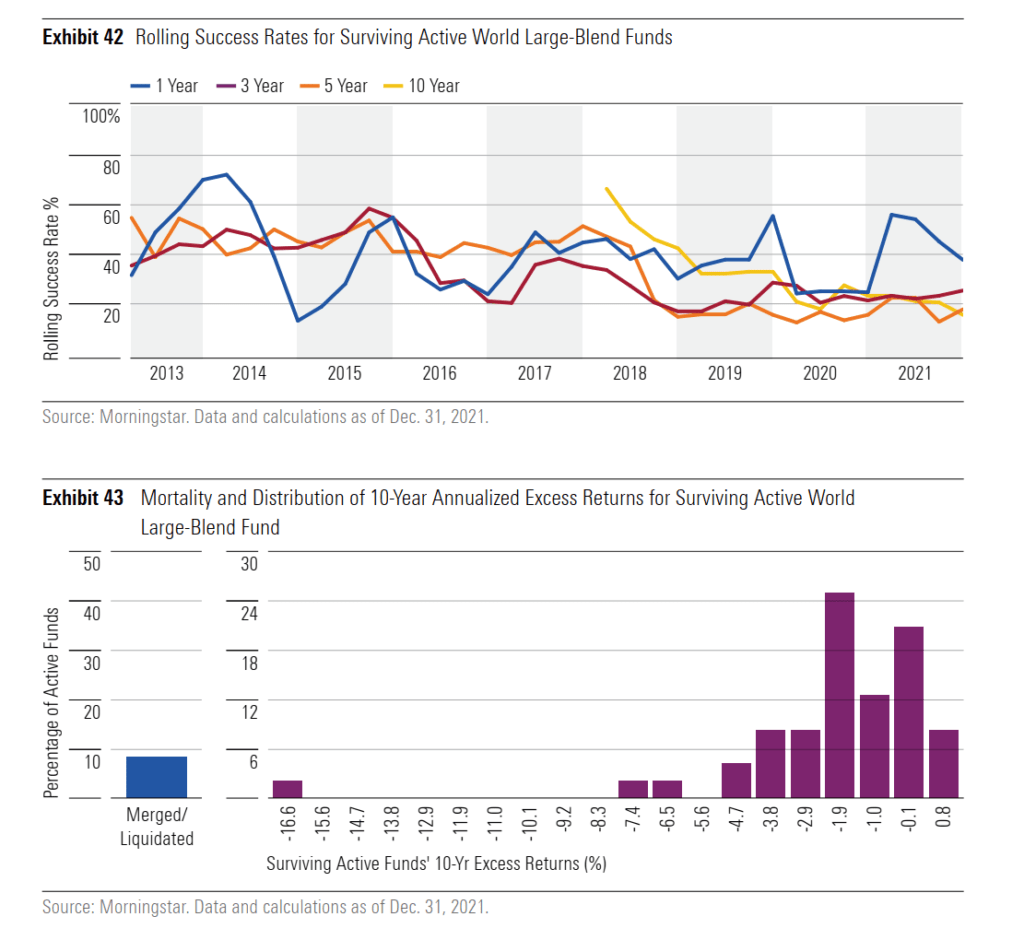
Exhibit 42 shows that from 2013 to 2015, you would have greater success rates than today.
Exhibit 43 shows that if you are very unlucky, your active funds may have a -16.6% 10-year annualized excess returns. In general, the median annual excess return is negative.
Diving into Diversified Emerging Markets Fund Cohort
This will match up to MSCI Emerging Markets.
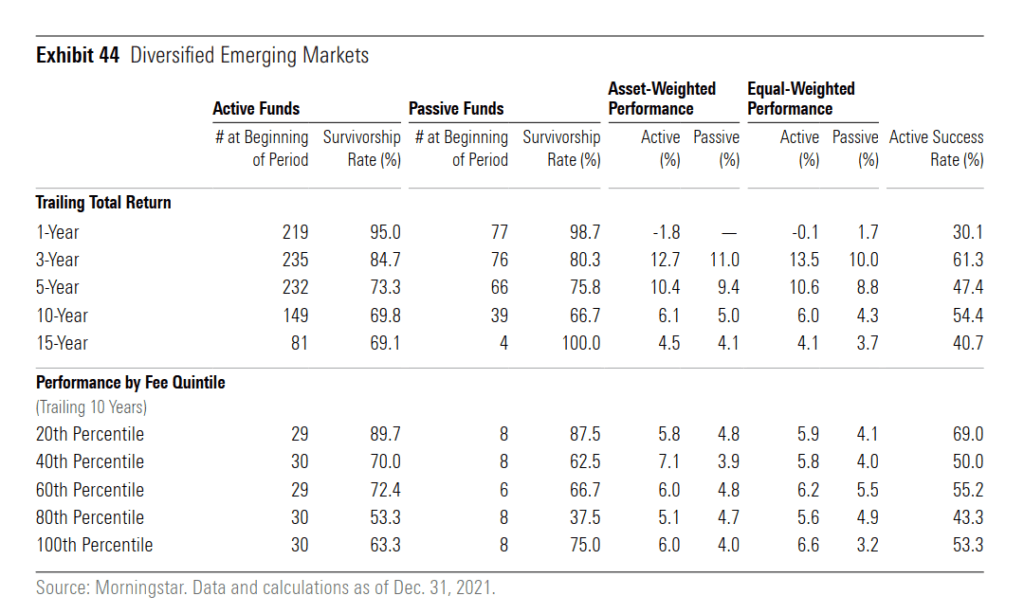
The survivorship of the active funds is generally better than US Large Blend.
You can get alpha through active funds if you invest in the emerging markets, but if we look at asset-weighted performance, it is not a lot.
More expensive funds do not mean lower returns. The most expensive active fund did 6% 10-year returns versus 4% for passive!
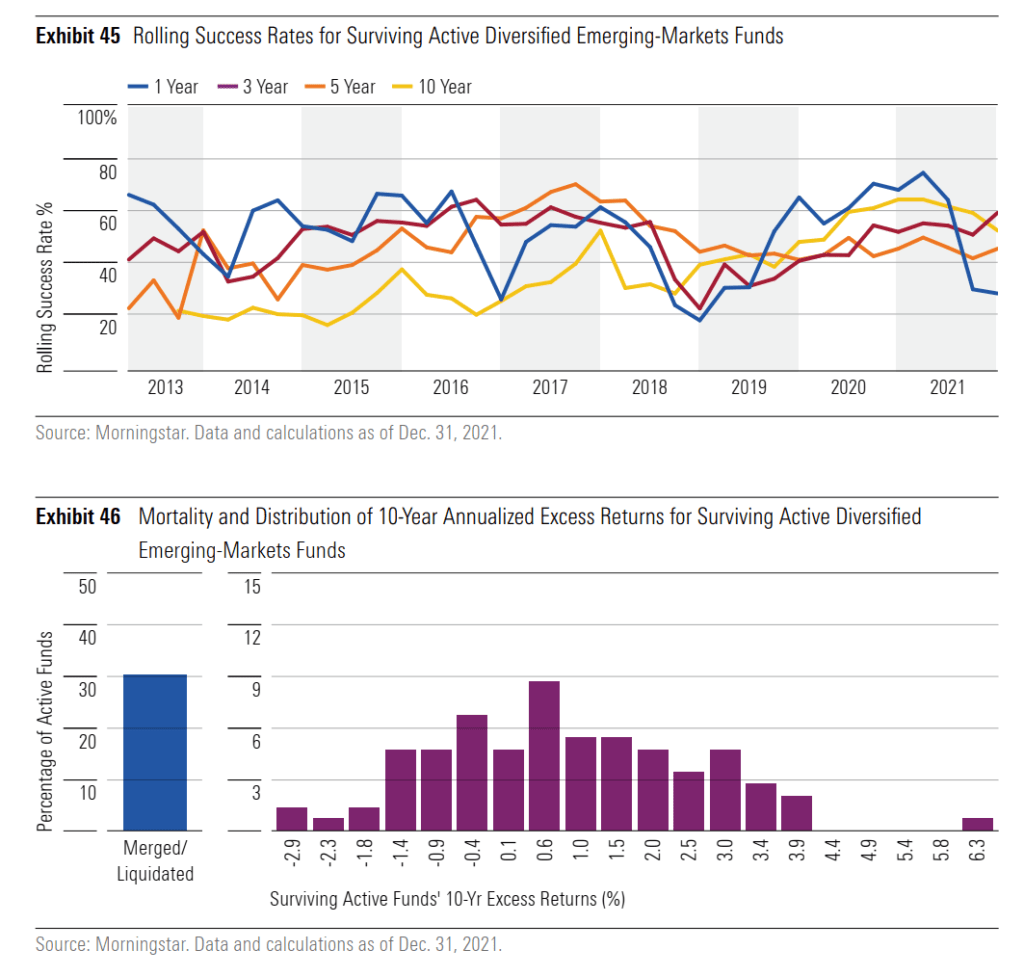
The 10-year rolling success rate is generally higher for emerging markets. In 2021, you have a 60% success rate of picking an active fund that survive and added excess returns.
The emerging market is the uncommon market where the median funds added excess returns.
Notice that odd fund that managed to do 6.3% excess 10-year annualized returns in the far corner of exhibit 46.
Diving into Global Real Estate Fund Cohort
Singaporeans always have an eye over real estate and they may be wondering if there is an easier method of investing in real estate without so much hassle. Investing through a managed fund in a unit trust or ETF structure would allow them to do that.
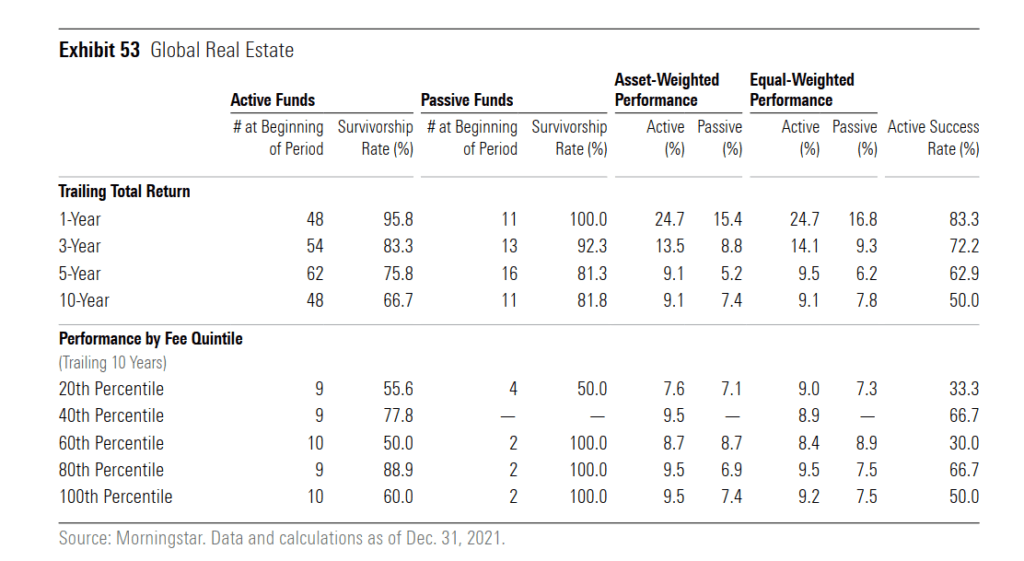
The survivorship of active funds has dropped over time.
What we notice is that the performance of actively managed global real estate funds is remarkably better than passive. The annualized return for active funds is 9.1% versus 7.4% for passive funds.
Global real estate may be the rare category where active management works.
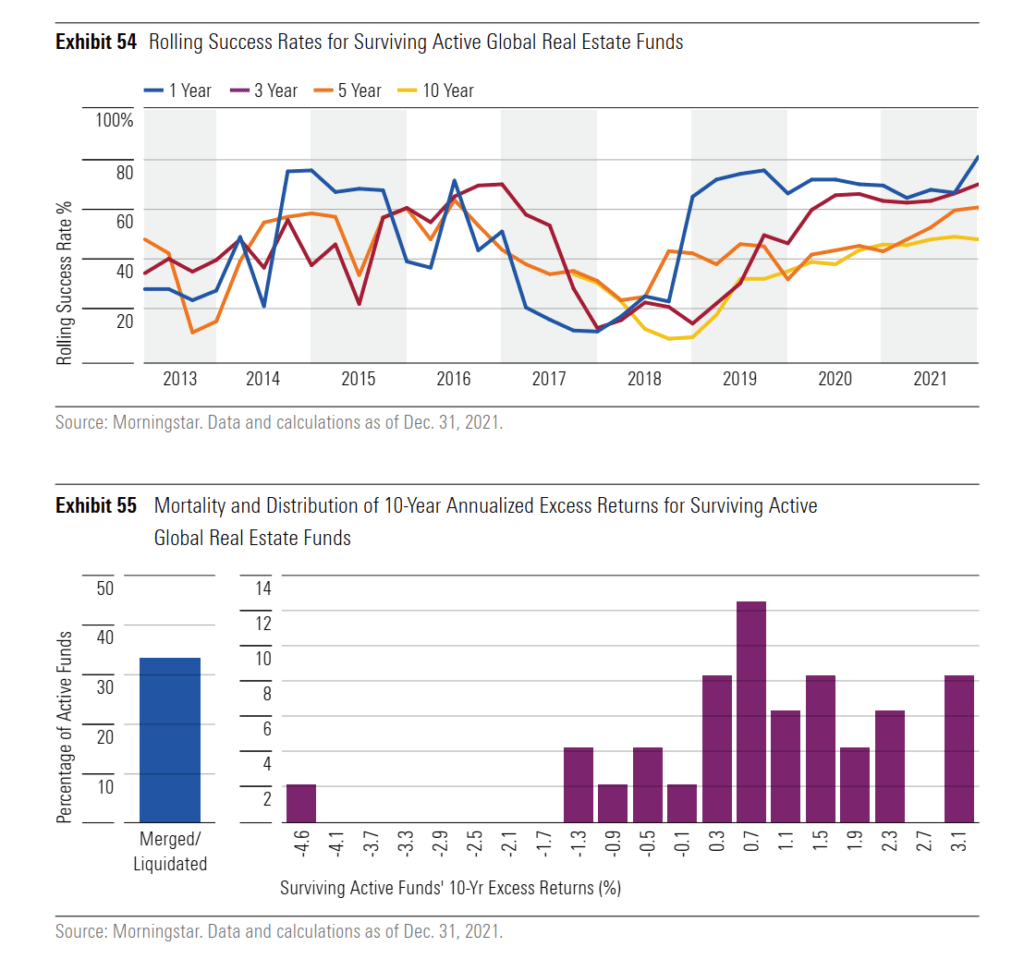
If we observe exhibit 54, 5-year and 10year rolling returns show at least 50% success rate over different rolling periods. Exhibit 55 shows that the median funds are able to get positive 10-year excess returns. At least 8 funds were able to garner a 3.1% 10-year excess returns.
Diving into Corporate Bond Fund Cohort
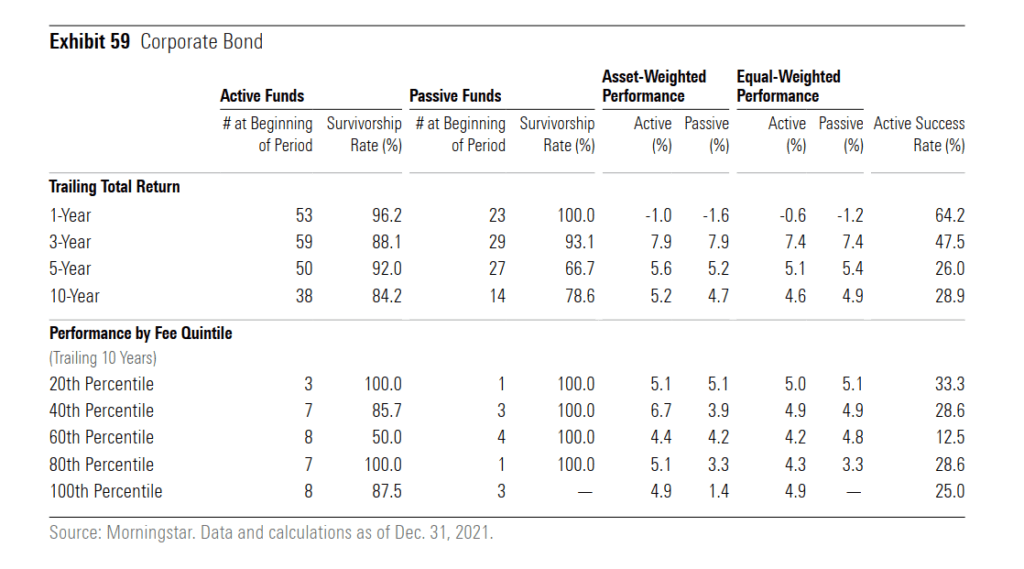
Actively managed bond funds showed relatively high survivorship rates. Asset-weighted active funds show better performance than passive peers. However, when equal-weighted, the results are less conclusive.
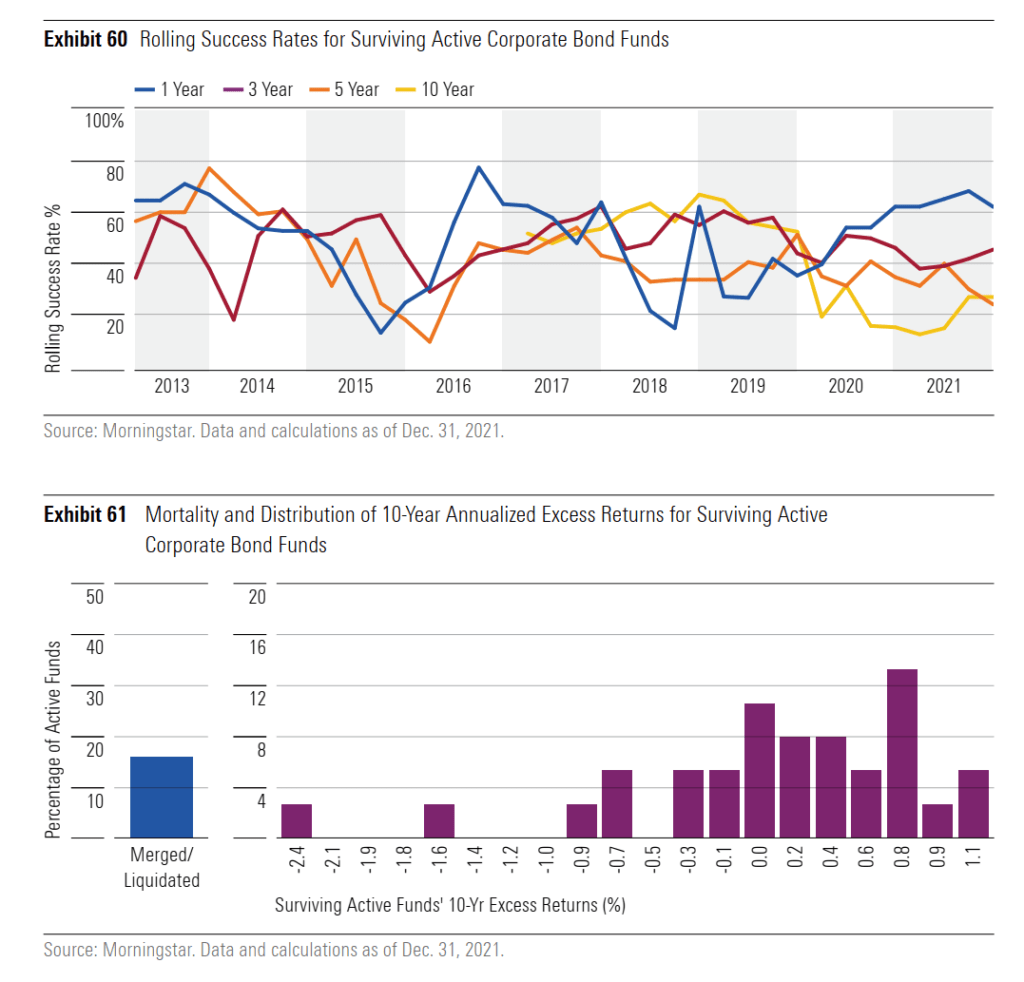
In the past, the 5-year success rate was higher and in recent years, the rolling 5-year success rates have come down.
Generally, the funds lean towards earning excess returns. The excess returns is not a lot, but given that corporate bonds have lower expected returns, it seems to show that in the bond domain, active fund managers may be able to add value.
Conclusion
You can read the article Actively Managed Funds Continue to Underperform here.
If we are able to view the funds as a cohort, you would realize that the returns of active funds are not too far off from passive funds.
A good conclusion is that there is not really a clear sign that investing in active funds, would allow you to earn excess returns over the long run (10-year and above).
We can make an argument that active funds investing in non-US stocks, bonds and real estate is able to deliver excess returns but what may not be shown in this data is whether those funds that performed well for 10 years will remain top tier performers.
The clearest segment that showed excess returns over different time periods is global real estate. Even then, we are not sure if the data sample is large enough for us to make that conclusion.
It seems to show that investors know when they should pile into global real estate funds and that the active managers are able to outperform.
Beyond that, debating which active funds to use may not be very productive. Your time may be better spent thinking about how you should structure your portfolio strategically (or for some tactically).
I do have a few other data-driven Index ETF articles. These are suitable if you are interested in constructing a low-cost, well-diversified, passive portfolio.
You can check them out here:
- IWDA vs VWRA – Are Significant Performance Differences Between the Two Low-Cost ETFs?
- The Beauty of High Yield Bond Funds – What the Data Tells Us
- Searching for Higher Yield in Emerging Market Bonds
- The performance of investing in stocks that can Grow their Dividends for 7/10 years
- Should We Add MSCI World Small-Cap ETF (WSML) to Our Passive Portfolio?
- Review of the LionGlobal Infinity Global – A MSCI World Unit Trust Available for CPF OA Investment
- 222 Years of 60/40 Portfolio Shows Us Balanced Portfolio Corrections are Pretty Mild
- Actively managed funds versus Passive Peers Over the Longer Run – Data
- International Stocks vs the USA before 2010 – Data
- S&P 500 Index vs MSCI World Index Performance Differences Over One and Ten Year Periods – Data
Here are some supplements to sharpen your edge on low-cost, passive ETF investing:
Those who wish to set up their portfolio to capture better returns believe that certain factors such as value, size, quality, momentum and low volatility would do well over time and are willing to harvest these factors through ETFs and funds over time, here are some articles to get you started on factor investing passively:
- Introduction to factor investing / Smart Beta investing.
- IFSW – The iShares MSCI World Multi-factor ETF
- IWMO – The iShares MSCI World Momentum ETF
- GGRA – The WisdomTree Global Quality Dividend Growth UCITS ETF
- Investing in companies with strong economic moats through MOAT and GOAT.
- Robeco’s research into 151 years of Low Volatility Factor – Market returns with lower volatility that did well in different market regimes
- JPGL vs IFSW vs Dimensional Global Core vs SWDA – 22 years of 5-year and 10-year Rolling Returns Performance Comparison
- 98 Years of Data Shows the US Small Cap Value Premium over S&P 500
- 42 Years of data shows that Europe Small Cap Value premium over MSCI Europe
I invested in a diversified portfolio of exchange-traded funds (ETF) and stocks listed in the US, Hong Kong and London.
My preferred broker to trade and custodize my investments is Interactive Brokers. Interactive Brokers allow you to trade in the US, UK, Europe, Singapore, Hong Kong and many other markets. Options as well. There are no minimum monthly charges, very low forex fees for currency exchange, very low commissions for various markets.
To find out more visit Interactive Brokers today.
Join the Investment Moats Telegram channel here. I will share the materials, research, investment data, deals that I come across that enable me to run Investment Moats.
Do Like Me on Facebook. I share some tidbits that are not on the blog post there often. You can also choose to subscribe to my content via the email below.
I break down my resources according to these topics:
- Building Your Wealth Foundation – If you know and apply these simple financial concepts, your long term wealth should be pretty well managed. Find out what they are
- Active Investing – For active stock investors. My deeper thoughts from my stock investing experience
- Learning about REITs – My Free “Course” on REIT Investing for Beginners and Seasoned Investors
- Dividend Stock Tracker – Track all the common 4-10% yielding dividend stocks in SG
- Free Stock Portfolio Tracking Google Sheets that many love
- Retirement Planning, Financial Independence and Spending down money – My deep dive into how much you need to achieve these, and the different ways you can be financially free
- Providend – Where I used to work doing research. Fee-Only Advisory. No Commissions. Financial Independence Advisers and Retirement Specialists. No charge for the first meeting to understand how it works
- Havend – Where I currently work. We wish to deliver commission-based insurance advice in a better way.
- New 6-Month Singapore T-Bill Yield in Late-April 2024 to Drop to 3.70% (for the Singaporean Savers) - April 18, 2024
- Golden Nuggets from JPMorgan Guide to Retirement 2024. - April 16, 2024
- Be Less Reliant on Banks and Build Stronger Capital Markets by Pushing for Better Shareholder Dividend and Buyback Yield - April 14, 2024

