I got into more research on the returns data surrounding a portfolio of small-cap value stocks recently. Specifically, how would your returns look if you are a near retiree, have a lump sum, and decide to invest most of the money in a portfolio of small-cap value periodically re-selected?
There is a side question which I got curious about. I wonder whether the market’s valuation when you decide to invest will affect your future investment outcome.
The most comprehensive data on small-cap value returns happens to be in the US. Fama/French and Dimensional have researched indexes on the small-cap value from Jun 1927 until today.
The problem is where to get US small-cap price earnings data going back so long. I cannot find a good source of data, but Professor Robert Shiller did publish historical S&P price and earnings data so that we can form historical price-earnings going back to 1871.
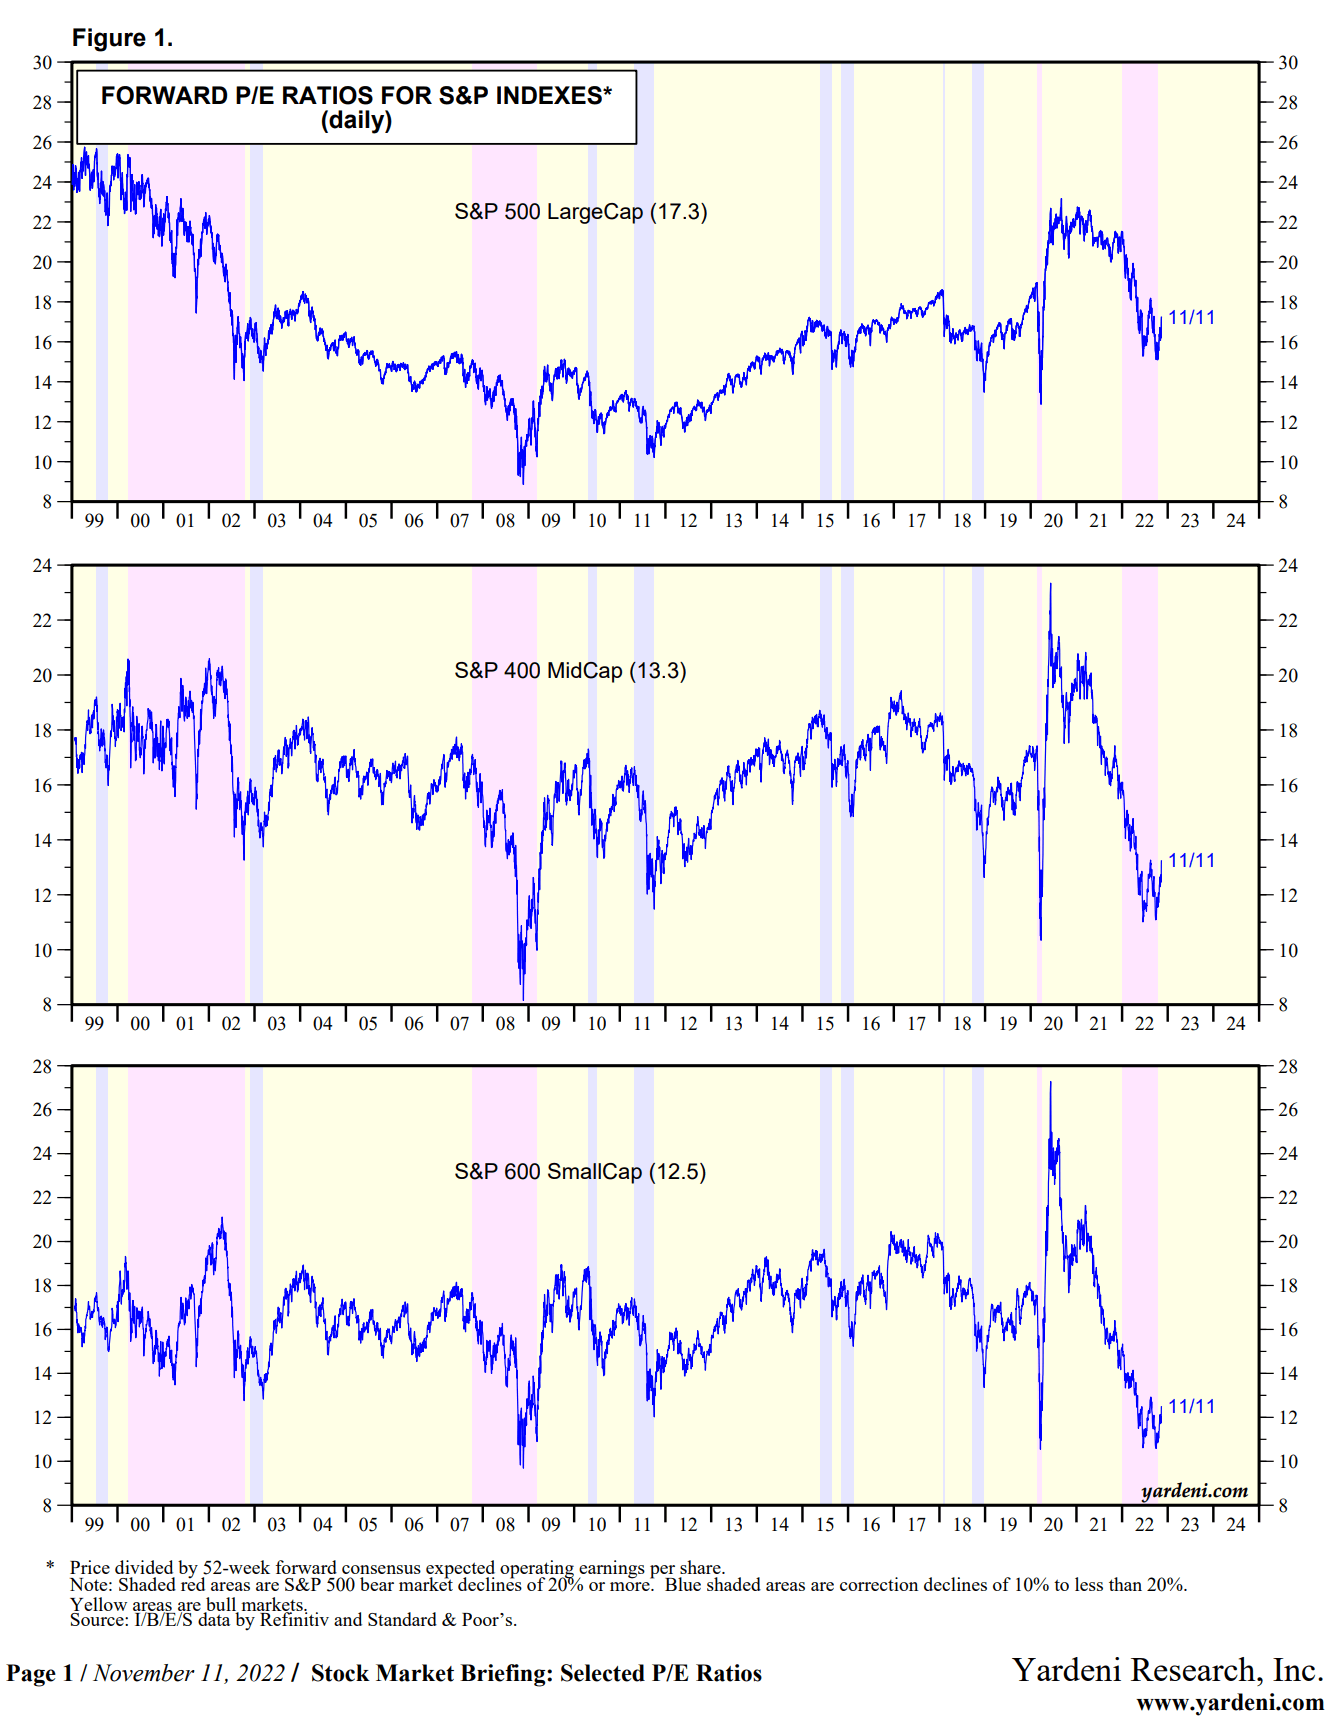
Yardeni Research lined up the S&P large, mid and small-cap data together, and through that, we observed that the price-earnings of the small-cap ebb and flow pretty similar to the S&P 500 and so we can roughly use S&P 500’s P.E as a proxy to see if we invest a lot of our net wealth when markets are relatively expensive is a bad idea.
There Doesn’t Seem to Be a Link Between Market Valuation and Small Cap Value Performance
The chart below shows the historical price-earnings of the S&P 500 on the red line and the subsequent 5-year compounded returns of a Dimensional US Small Cap Value research index:
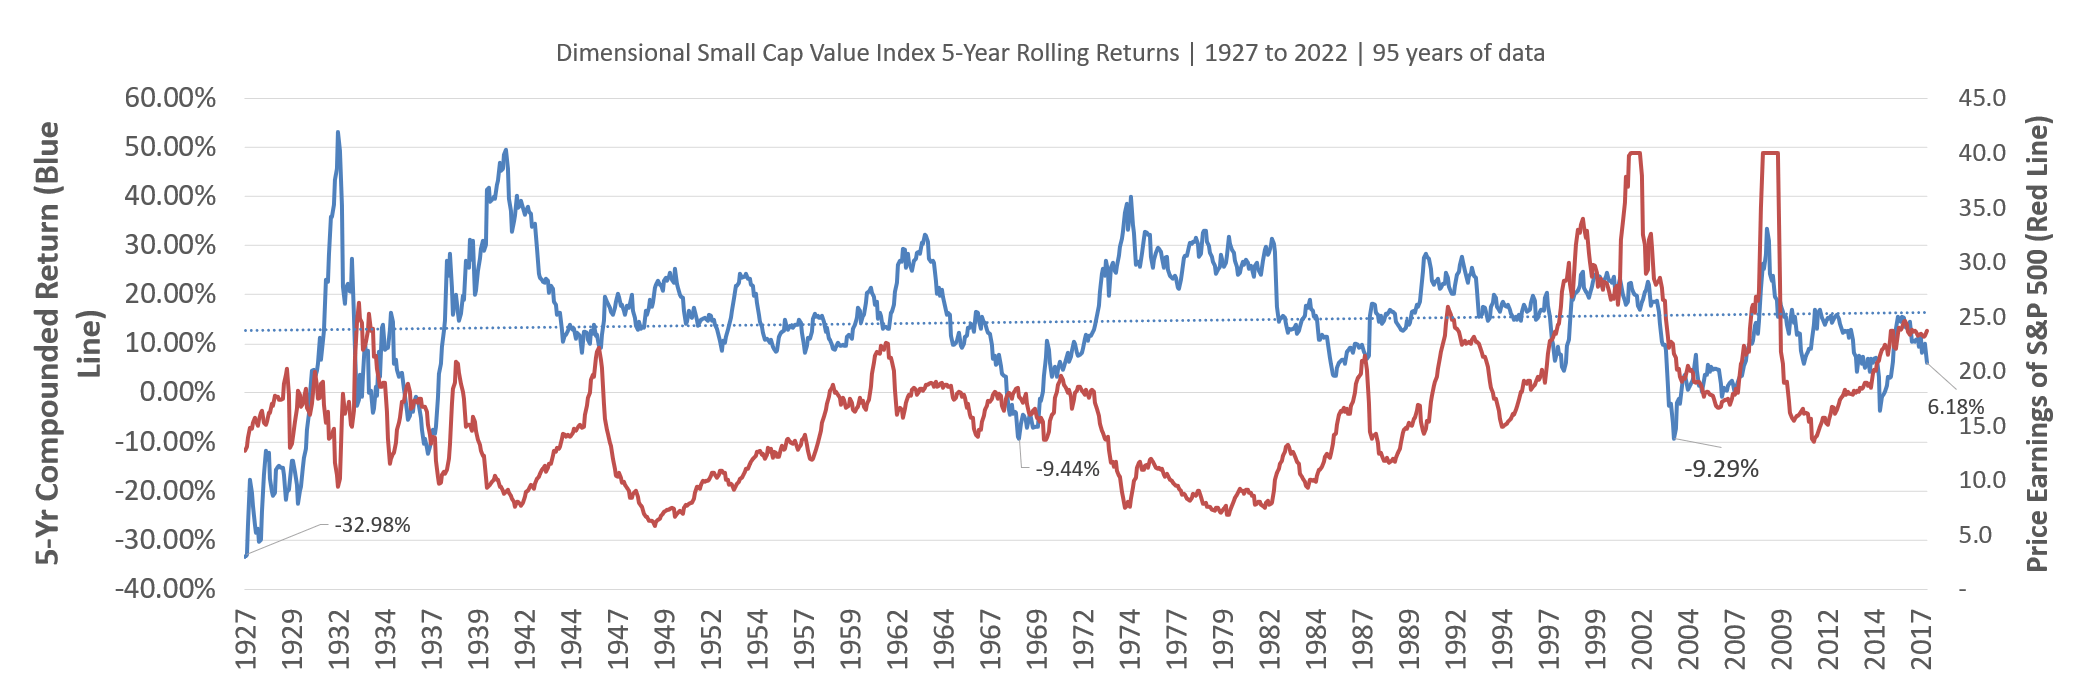
Each point on the chart will show you the relative price-earnings and the compound returns for the next five years.
For example, a point near 1946 will show that the PE be near 23 times, and for the next 5 years, the compound growth is 10% a year.
We first notice that there are roughly five periods where you will still be negative even after five years. That will be the 1927 to 1932, 1936 to 1938, 1969, 2003 and 2014.
Here is the range of returns:
- 90th percentile: 28.2% a year
- 75th percentile: 22.3% a year
- Median: 15.2% a year
- 25th percentile: 9.0% a year
- 10th percentile: 0.0% a year
Even in a less pessimistic case (25th percentile), the return from US small-cap value is a bit crazy. And in very pessimistic periods, you might break even.
I am convinced there are periods where nothing will alleviate country-specific risks. The worst 5-year CAGR happens to be at the start of Jun 1927. The PE of the S&P 500 is about 12 times, and the subsequent five-year annual return is -33% a year.
Your portfolio puked away 86% of its value. $1 mil is left with $140k. This might be like the current Russia situation. Data analysis only tells us that country-specific risk is real.
I don’t find any clear pattern between the market valuation and performance. We have periods like the 2004 where the PE came down from the highs of the dot com period to a reasonable 17 times but subsequent US small cap value returned 0% a year. Then you have periods near 1962 where the PE climbed from less than 10 times to 17 times, and subsequently, the small-cap value returned near 30% a year for five years.
The portfolio has a self-rejuvenating, reconstitution capability of buying and selling relatively cheap. It takes on a life of its own.
There might have other closer relationships that might help us figure out the best time to invest, but it seems that investing nearly all your retirement funds based on valuation is not too useful.
The Longer Term U.S Small Cap Value Performance is Quite the Monster
Perhaps the take-away is that US small cap value just did well in the past.
The following chart shows the ten-year rolling returns instead of five-year:

The first conclusion again is, the great depression is really challenging to deal with. A -10% a year growth compounded for ten years is equivalent to -65% of your $1 million portfolio.
Here is the range of returns:
- 90th percentile: 22.3% a year
- 75th percentile: 19.0% a year
- Median: 15.4% a year
- 25th percentile: 11.7% a year
- 10th percentile: 8.1% a year
In some very pessimistic periods, the return is 8% a year. Beyond the late 1920s, you don’t find a ten-year period where returns were poor.
The chart below shows the 15-year rolling returns instead of the 10-year rolling returns:
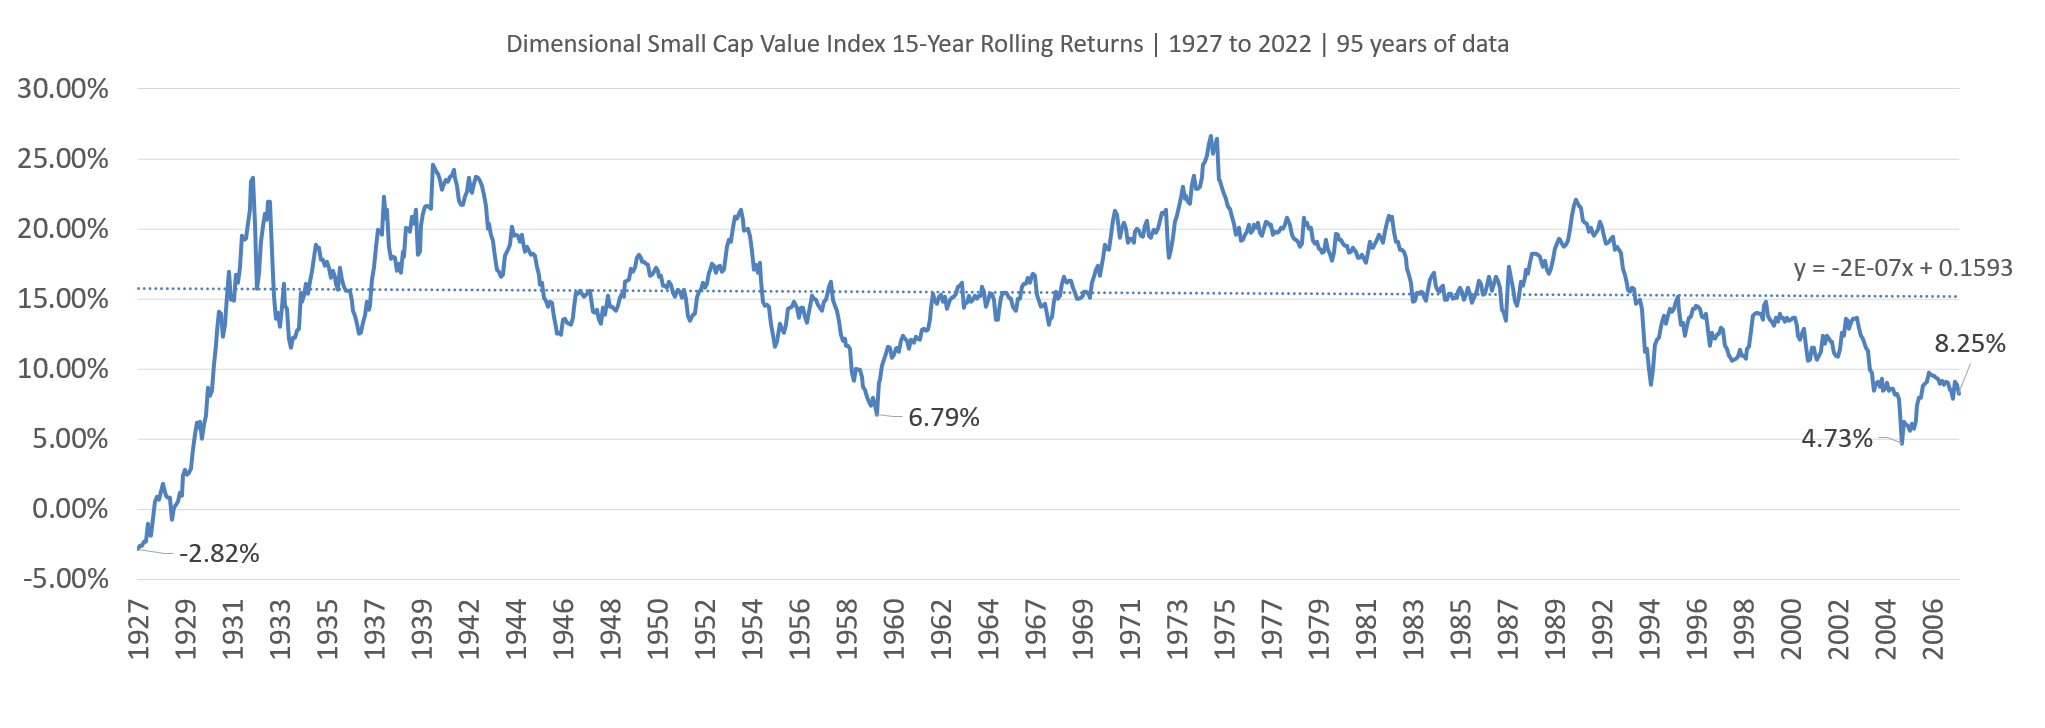
Again, even after 15 years, if you invest most of your net wealth during 1927, you will still be negative.
I did the math, and you will only break even after 17.3 years.
If we look at equities as a bond with a certain duration, the minimum duration for maturity is probably about 18 years.
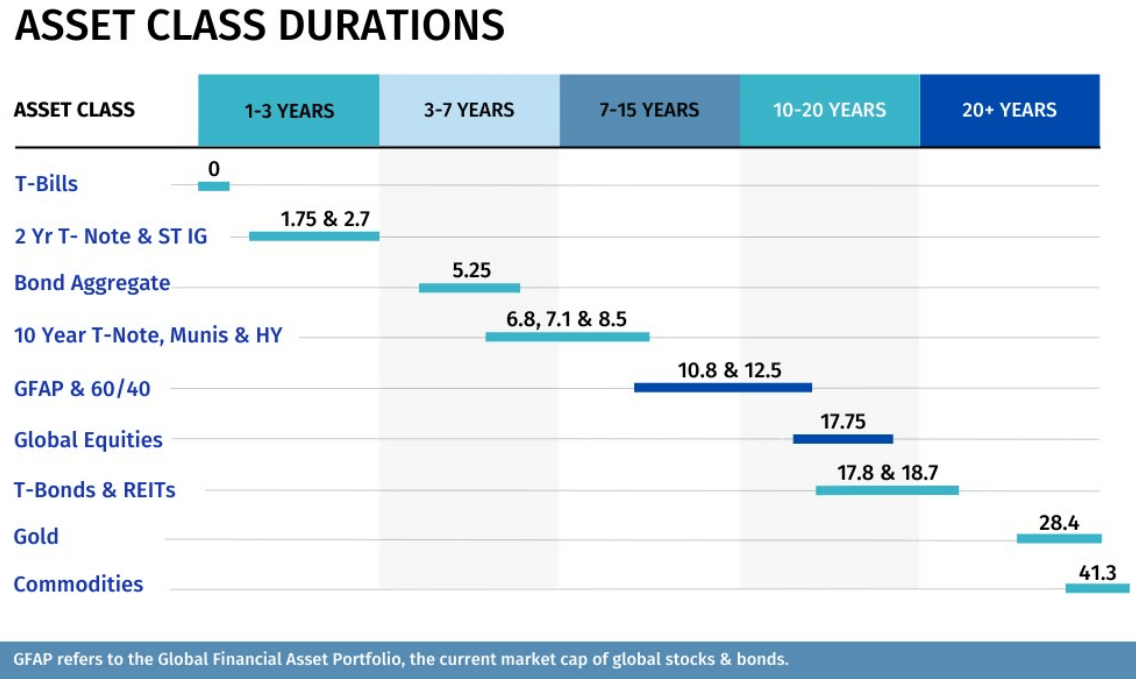
In his recent research paper on the minimum duration of different asset classes, Cullen Roche put the minimum period for equities to be 18 years.
Here is the range of returns:
- 90th percentile: 20.7% a year
- 75th percentile: 18.9% a year
- Median: 15.5% a year
- 25th percentile: 13.3% a year
- 10th percentile: 9.6% a year
With this kind of historical return, this should satisfy many accumulators. Recent US small-cap value returns are lower, but 8% a year for 15 years is pretty decent for a rejuvenating fund.
If you want to invest, Endowus should carry Dimensional Global Targeted Value, which is not a US small-cap value but a global small-cap value. A very popular ETF listed on the US stock exchange is the Avantis US Small Cap Value ETF (AVUV), and if you wish for a Dimensional one, there is Dimensional U S Targeted Value ETF (DFAT).
If you wish for a more estate tax-efficient UCITS small-cap value ETF, you can invest in the SPDR® MSCI USA Small Cap Value Weighted UCITS ETF (USSC). All three ETFs (AVUV, DFAT and USSC) implement value differently.
The cost-efficient and reliable broker to consider is Interactive Brokers, which allows you to trade both in the US and London Stock Exchange at very low commissions.
I do have a few other data-driven Index ETF articles. These are suitable if you are interested in constructing a low-cost, well-diversified, passive portfolio.
You can check them out here:
- IWDA vs VWRA – Are Significant Performance Differences Between the Two Low-Cost ETFs?
- The Beauty of High Yield Bond Funds – What the Data Tells Us
- Searching for Higher Yield in Emerging Market Bonds
- The performance of investing in stocks that can Grow their Dividends for 7/10 years
- Should We Add MSCI World Small-Cap ETF (WSML) to Our Passive Portfolio?
- Review of the LionGlobal Infinity Global – A MSCI World Unit Trust Available for CPF OA Investment
- 222 Years of 60/40 Portfolio Shows Us Balanced Portfolio Corrections are Pretty Mild
- Actively managed funds versus Passive Peers Over the Longer Run – Data
- International Stocks vs the USA before 2010 – Data
- S&P 500 Index vs MSCI World Index Performance Differences Over One and Ten Year Periods – Data
Here are some supplements to sharpen your edge on low-cost, passive ETF investing:
Those who wish to set up their portfolio to capture better returns believe that certain factors such as value, size, quality, momentum and low volatility would do well over time and are willing to harvest these factors through ETFs and funds over time, here are some articles to get you started on factor investing passively:
- Introduction to factor investing / Smart Beta investing.
- IFSW – The iShares MSCI World Multi-factor ETF
- IWMO – The iShares MSCI World Momentum ETF
- GGRA – The WisdomTree Global Quality Dividend Growth UCITS ETF
- Investing in companies with strong economic moats through MOAT and GOAT.
- Robeco’s research into 151 years of Low Volatility Factor – Market returns with lower volatility that did well in different market regimes
- JPGL vs IFSW vs Dimensional Global Core vs SWDA – 22 years of 5-year and 10-year Rolling Returns Performance Comparison
- 98 Years of Data Shows the US Small Cap Value Premium over S&P 500
- 42 Years of data shows that Europe Small Cap Value premium over MSCI Europe
If you want to trade these stocks I mentioned, you can open an account with Interactive Brokers. Interactive Brokers is the leading low-cost and efficient broker I use and trust to invest & trade my holdings in Singapore, the United States, London Stock Exchange and Hong Kong Stock Exchange. They allow you to trade stocks, ETFs, options, futures, forex, bonds and funds worldwide from a single integrated account.
You can read more about my thoughts about Interactive Brokers in this Interactive Brokers Deep Dive Series, starting with how to create & fund your Interactive Brokers account easily.
Kyith is the Owner and Sole Writer behind Investment Moats. Readers tune in to Investment Moats to learn and build stronger, firmer wealth foundations, how to have a Passive investment strategy, know more about investing in REITs and the nuts and bolts of Active Investing.
Readers also follow Kyith to learn how to plan well for Financial Security and Financial Independence.
Kyith worked as an IT operations engineer from 2004 to 2019. Currently, he works as a Senior Solutions Specialist in Insurance Start-up Havend. All opinions on Investment Moats are his own and does not represent the views of Providend.
You can view Kyith's current portfolio here, which uses his Free Google Stock Portfolio Tracker.
His investment broker of choice is Interactive Brokers, which allows him to invest in securities from different exchanges all over the world, at very low commission rates, without custodian fees, near spot currency rates.
You can read more about Kyith here.
- My Dividend Experience Investing in UCITS iShares iBond Maturing in 2028. - April 23, 2024
- We Invest into Popular Funds When They Are Popular, Exactly When They Started Turning to Shxt. - April 22, 2024
- Meal Prep 2.0 – Cooking Your “Go-to” Meal that You Look Forward to Eating Everyday. - April 21, 2024
Revhappy
Tuesday 15th of November 2022
Hi Kyith,
I follow your stock portfolio tracker and I noticed interesting accounting. You reduce the cost of you investments, how/why do you do that? Do you take money out for expenses and then reduce it from both the cost and the total value?