I stopped writing part of my notes section for a while because there was some stuff that I should get through before writing about my income portfolio implementation.
One of them is a post about my mental model and how I look at returns.
Why is that important?
If you don’t understand that well, you will have a lot of questions.
So, I decided to write this post. This post is about 4,500 words, but if you don’t want to read so much, the short version is that my view is returns are driven by different forms of systematic risk and systematic errors made by various groups of people.
I am not sure what kind of returns I will get in the future, but with historical returns data, I can get a good sense of whether the risks that I take will be well compensated.
So I own a portfolio make up of risky stuff like such an illustration:

The portfolio is volatile but likely it averts the kind of risks that I don’t wish to take on such as if I bet on a sector like A.I and I am wrong, my income or wealth building is impeded severely.
I try my best to diversify the type of risk exposure because there are times when returns from some risk factor show up while another is not work. Being diversified enough smooth things out behavorially.
The rest of the article is the long version.
Here is the header point form for me to focus on:
- Why do we need to think about returns?
- What is expected returns? How do we get positive expected returns?
- What drives returns in our investments? Taking risks.
- Risks can be dangerous despite the high potential returns, how do we prevent the risk of ruin? Diversification.
- Owning the risks of a market segment. The Index Portfolio.
- The emergence of computers and data collection enables us to change how we view the drivers of returns.
- Other than market-beta, are there other risks with evidence that they compensate us for risk-taking?
Many of us are quite enamored with generating returns but why is return important to us?
That will be a good place to start.
Why Do We Need to Think and Generate a Return?
The main reason is that we have a financial goal and to achieve that goal, we need some return.
Your financial goal might be to reach retirement or financial independence like a Karen below:
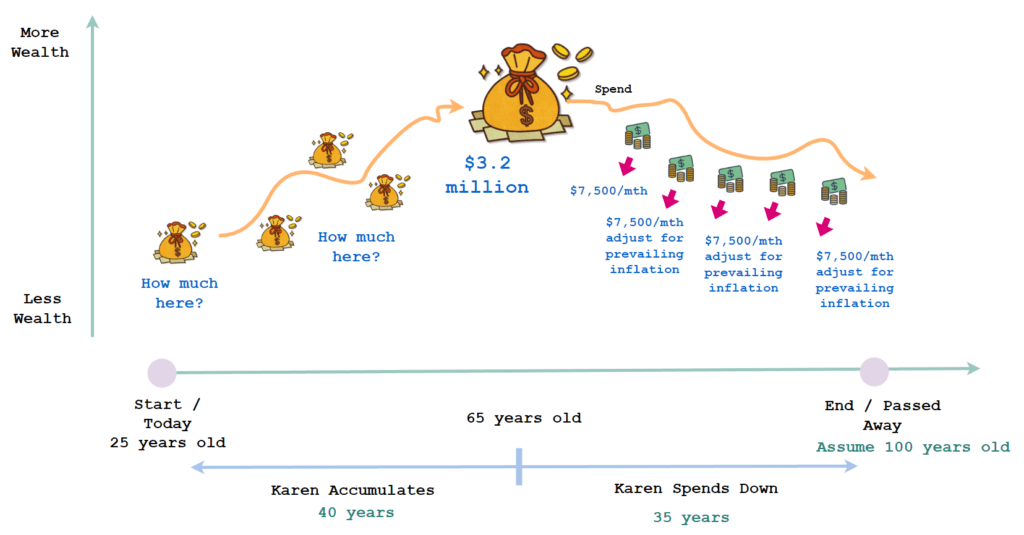
We calculated that to have an inflation-adjusted income of $7,500 monthly, Karen needs $3.2 million.
To achieve that, Karen needs to put in some capital, which depends on whether she has but also a certain rate of return she use in her plan.
If Karen achieves 20% a year actually then she will reach this goal earlier but if she achieves 2% a year, then her goal might have to be pushed back.
But What is the Right Rate of Return to Use?
This is a good question.
We don’t have a crystal ball to see into the future to tell what will earn good return and what will earn poor returns in the future so we often look at what worked well in the past to decide:
- What can help us to build wealth?
- How much is the rate of return we could get, if we invest in that strategy or security today?
Good planners try to use a reasonable rate of return based on the evidence of the past that leans slightly more conservative (but what we see out there is a lot of planning returns based on very optimistic sequences).
Rate of Return Assist Us to Identify the Suitable Investment Instrument and Strategy
With a rate of return of say 4.5% yearly as an example, Karen can figure out how much in lump sum she needs to put in and on a recurring basis.
Or if Karen prefers to commit more capital because F.I. is an important goal for her, the financial math can help her figure out what is the minimum rate of return she needs to achieve.
And that will let us know what are the suitable investment instruments or strategy Karen need to allocate her capital into.
The rate of return guides to tell us whether we are likely to reach our goals and this is why it is important.
Rate of Return Makes a Difference in the Success Odds in Income Planning During Spending Down.
Regular readers of Investment Moats would know that I do not consider the rate of return in our investments within our income strategy to be the most important criteria that determine overall success (the income-to-capital ratio or safe withdrawal rate ‘SWR’ is)
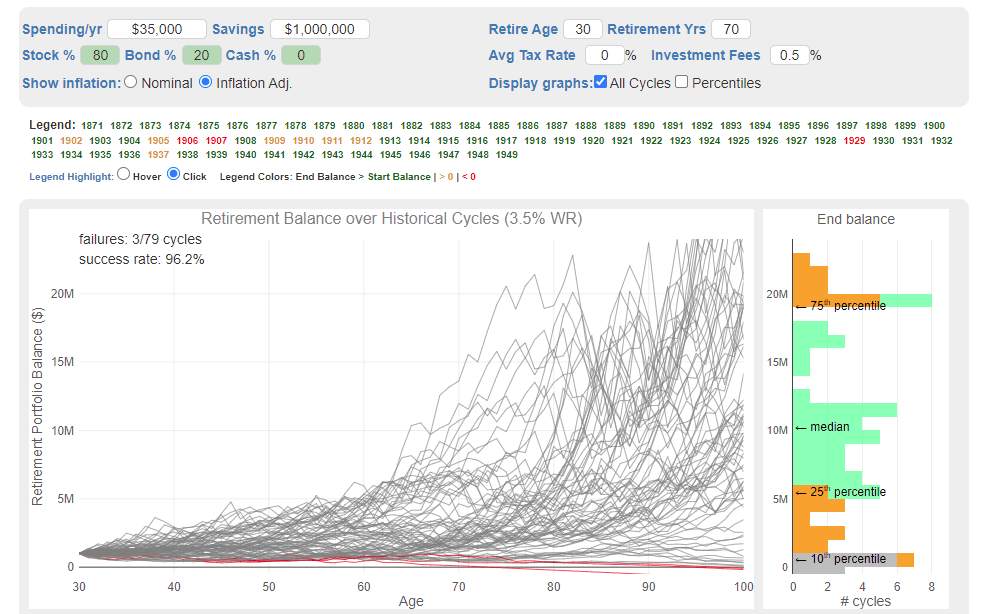
The chart above shows that if we can go back in history from 1871 to today, and we imagine us living through all the possible 70-year retirement periods, will we enjoy retirement success or run out of money. In this case, out of 79 unique 70-year periods, the retiree ran out of money in three of them. I won’t go into the detail because that is not the point.
Each of those 79 unique 70-year periods have a unique rate of return. These are represented by the 79 lines in that chart. Some are very high, some high, some low, some very low.
While returns matter, inflation and how much you spend matter as well.
It is important for us to respect the degree of returns in overall success rates.
What is Expected Return?
So, we need to achieve our financial goals, and returns are an important part.
You may be curious about what your return looks like in the future.
You may be wondering about your expected return.
The expected return is the return you expect. Now some of you might want to murder me for stating the obvious but for each kind of investment strategy, asset class, security, packaged product, you would expect a return so that this strategy or investment asset can help you reach your financial goal.
What expected returns mean is:
- You will need to buy the product at a specific price.
- Somewhere in the future, you have to sell it.
- The difference will be your gain.
All this will take place in the future.
If we calculate the returns on an investment that has been sold, against the price we buy at, that is realized return. Usually, we measure our returns by dividing the returns over the yearly timeframe we invest in what we call annualization. This is so that we can relate to the return.
Some would challenge me that there are some investment assets that you will never sell as you passed on to the next generation.
Well… you do see at some cut off and it can be during estate transfer. You bought it for $20,000 but as you passed away, we value what you bought at $2.5 million before transfer and so the difference between $2.5 mil and $20k is your realized return if we reflect upon your ownership of that asset when you are alive.
Does your realized return match up to the returns you expect?
That is a good question.
You might not want to delve so much in the past but are more interested on what are the returns you can get in the future for a sum of money you wish to allocate.
It is important to note that most of us wish for an expected return that matches our financial goal (refer to the previous section).
We have a bias that the price we sold the investment asset at is much higher than the price we paid for the investment asset. If I buy an exchange-traded fund (ETF) such as the VWRA or a REIT like Mapletree Industrial Trust at is $100,000, I want to make sure I sold VWRA or Mapletree Industrial Trust for a higher price. Most often not just higher, but so much higher that is equivalent to X% yearly for Y number of years so that I can reach my financial goals.
Can We Make Sure We Get a Positive Expected Return?
Most people are buying and selling but not everyone makes money from their buying and selling.
We want to increase the certainty in these trades that we do.
You and I can make “trades” over different frequencies:
- A day trader buys and sells within minutes or hours.
- An intermediate-term trader buy and hold securities and sell within a few weeks.
- A long term investor buy and sells after holding for years.
Trades can take place for buy-and-hold investors because you can always value your investment assets as if you sold them today at the current price.
What we learn often is that trading is hard but buying-and-holding strategy has greater success rate in earning a good expected return.
There are good traders who have mastered the behavioural aspects, found their edge and are discipline. That would work out as well, but we will often describe that investing over long term (or in this case very, very long term trading on very, very low trading frequency) is easier for the Average Retail Joe that has a day job like you and me to earn positive expected return that is adequate to reach our financial goal.
But what drives expected return?
Returns are Driven by Our Risk Taking. But Do You Get Compensated Well Enough for the Risks You Take?
What drives returns is taking risks.
There are many kind of risk such as potential deviation of market price outcome within a certain timeframe (volatility), interest rate risk, default risk, country risk, risk in illiquidity.
Many would say an investment have high returns and therefore the risk is high.
A more correct way is that the risks are high, and therefore we HOPE the returns are high to compensate for the risk we take on.
This means that if we want high returns, we have to take on high risks.
But we might not get the high returns:
- If we eventually get the high returns: Our risk-taking is said to be compensated. There is a positive risk premium.
- If we eventually don’t get returns but lose money: Our risk-taking is said to be uncompensated. This is a negative risk premium.
- Time frames do matter.
So hence we often say premium is compensation for risk taking.
Aren’t the Risks on Some Investment Very Low But They have High Returns?
The risks in some seemingly high returns, low risk investments are hidden.
More sophisticated investors may know of the risk compare to you. Or all of us failed to recognize the risk before hand.
A good example is CPF SA that is very liquid, yet very high at 4% p.a. We see recently in the government policy shift that it gets taken away. You can still earn the 4% by transferring to your CPF RA account, but you take on illiquidity risks, not having access to your money.
Some would say investing in the S&P 500 is very low risk.
But going by this theory, if everyone thinks that the blue chip US companies are so low risk. and are willing to pay a higher price for the group of companies, the theory would mean that investing in US blue chips should yield a lower future expected returns.
Investments that have Low Risk and Correspondingly Lower Returns
The fixed income securities issued by Amazon or Microsoft have very low yield-to-maturity.
This is because they have so much cash on their balanced sheet, their business produce a ton of free cash flow, and basically they don’t need the money.
The risk of lending money to these companies look low, and the potential returns look to reflect that.
Now, compare that to the fixed income issue by a company like Carvana. The yield-to-maturity is north of 10%.
Not All Your Risk Taking is Eventually Compensated with Returns.
Some of you have started businesses at some point in your life or work in young business.
How is that experience for you?
The truthful ones will admit that not all business venture work out. Some are lucky to get back their principal but many lost their principal and treat this as a good lesson that things are not as easy as we think.
But the Towkay that succeed earns much better than many.
This is why we phrase things as take risk and hope we get compensated.
The Presence of Visible and Invisible Risks May Be What Drives Returns in Aggregate.
I have collated a few charts and illustrations to show you the risks that you may not know of investing in individual companies:
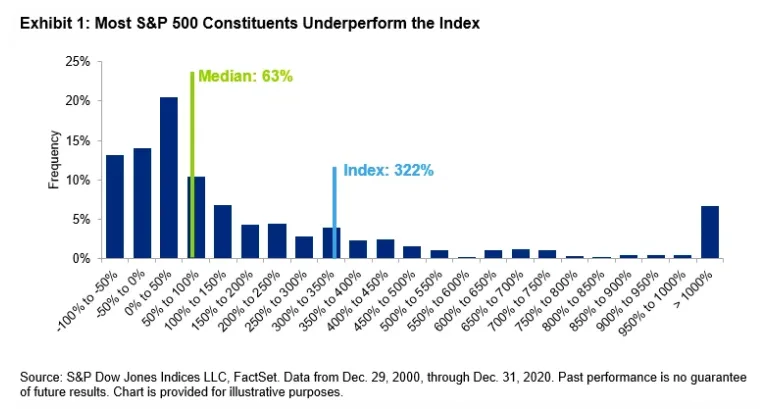
The chart above shows that if we measure the cumulative returns of individual stocks in the S&P 500 not all of them make money despite us investing for the long term. About 20-25% is below 0%.
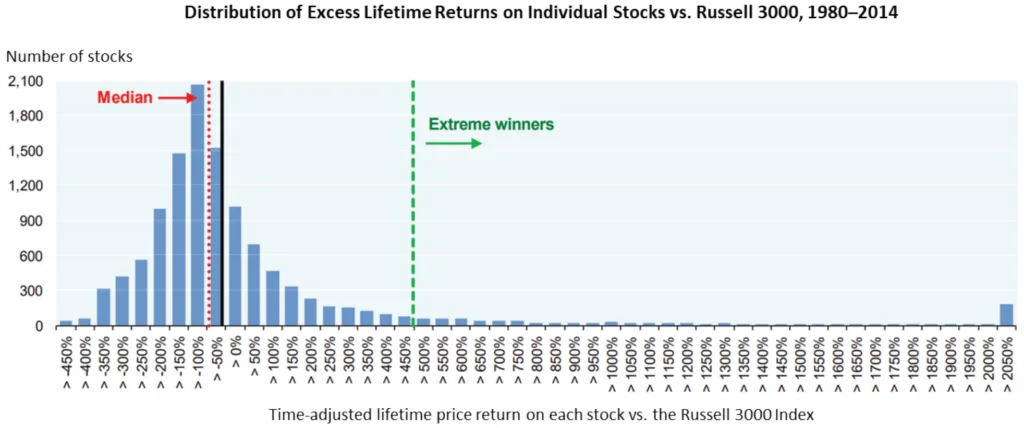
If we measure the excess lifetime returns or the returns above the average of the index, the median and below number of stocks doesn’t earn excess lifetime returns. The index performance is skewed by a small number of stocks or companies with outsized returns.
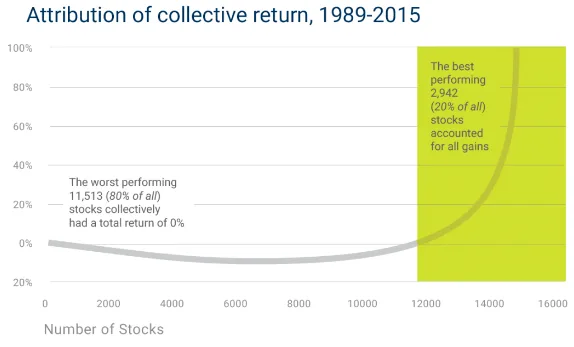
In a detailed analysis of 14,000 publically traded stocks in the US over the past 30 years, it is found that 20% of publicly traded US stocks have accounted for virtually all the S&P 500 gains since 1989.
These data tell us that there are risks of your capital being very impaired, if you invest in a certain way, or owning a group of stocks.
And these risks may be visible or invisible to you.
But it is this risks that may give the presence of potentially higher returns.
Wait… I thought Returns were Driven Mainly by the Cash Flows of the Underlying Asset?
Well, yes and no.
Some would say that they own real businesses.
For example, if I own a REIT such as Manulife US REIT, the REIT owns office buildings and there is rental cash flows, then that is the important thing?
In the same case, if I own a fixed income bond issued by Capitaland that pays me a semi-annual coupon of 2% over 5 years, there is a contractual obligation to pay me the money and that drives returns isn’t it?
In both cases, we need to ask again:
- What is the price we buy at?
- What is the price we sell, or check its valuation at?
The dominant force in play here is that we could pay a high price for a cash flow that is much lesser, or getting lesser and lesser.
This is the price chart of a local-listed REIT Manulife US REIT:
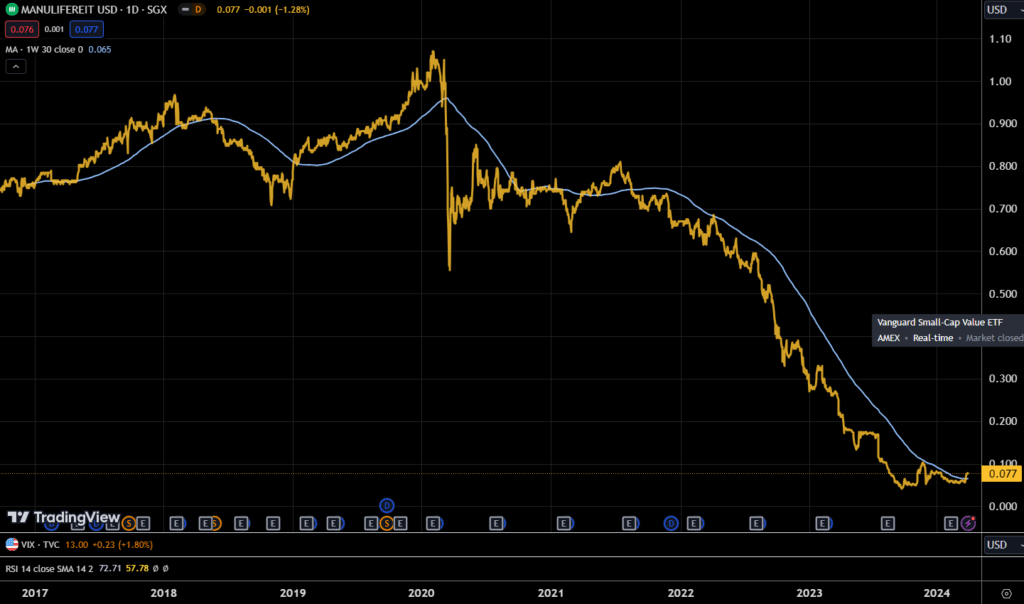
I don’t like to use this example because some of us might have PTSD from our ownership of it, but I guess this is an example. When we own it at $1.00 or so, the valuation is baked in the expectation of future cash flows that substantiate that $1.00 or so valuation.
Those are real cash flows generated by real properties.
In hindsight, the fundamentals in short term change and the market revalues the REIT because the market feels our cash flow expectations when we buy at $1.00 or so is wildly optimistic and future cash flows would be substantially lower.
In this example, real cash flow but our realised returns does not meet up with our expected return when we purchase it at $1.00.
Hindsight, it is likely we overpaid for our investments, which drives home the point that expected returns is how much we buy at and how much we sell at.
The cash flows matter more fundamental-wise to substantiate the price we pay for but it is also how much we paid for it eventually.
Another good example is PayPal here:
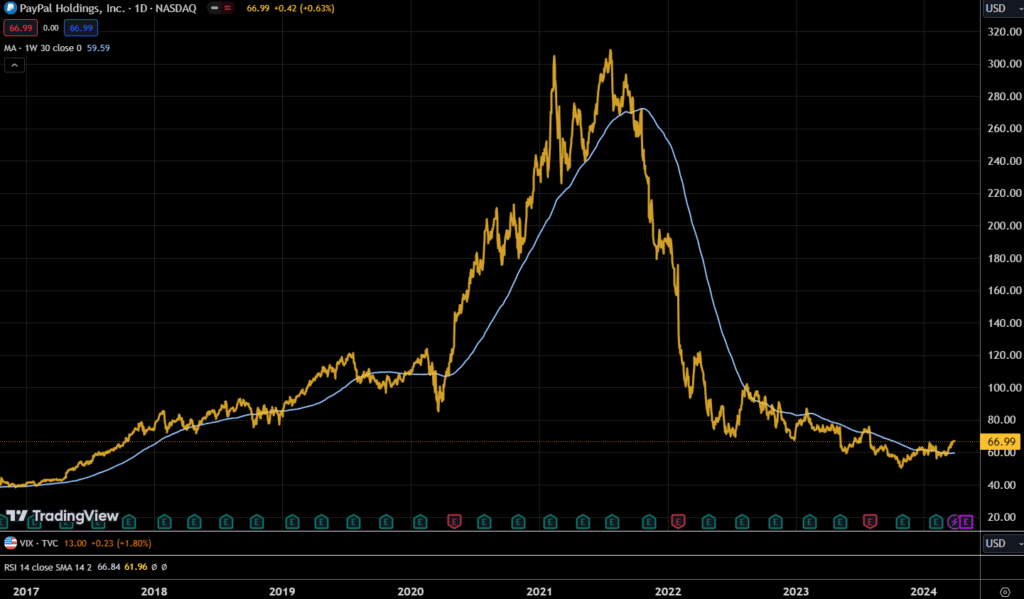
Some investors were optimistic about the future cash flows, and in their minds, the expected return is higher but if we sold off our shares today, our realized returns is very different.
The price we pay becomes important.
What about the Dividend Cash Flow that We Earn, Kyith? How should I look at that in the Context of Expected Return?
A stock that distributes dividends is the same. In fact, dividends are paid out of earnings and we just discussed earnings and cash flow.
So dividends is less of a discussion.
If Risks drive Returns, and We Might Lose All Our Money if Risks are Not Compensated, Then How Do We Invest?
We can invest, but we have to be diversified enough!
Being diversified enough prevents us from taking on certain risks that are not sensible.
I would often ask ourselves two questions:
- What are the risks that if you take on, but don’t work out, you will not forgive yourself?
- What are the risks that if you don’t take on, you might not forgive yourself if it works out?
These questions do not result in binary outcome. There are risk you take on that didn’t work out but it will not affect your life and there are risks that you don’t take on but you are okay despite a good eventual outcome.
If you answer these questions truthfully, the answer is a diversified portfolio.
Diversification also has another advantage that may don’t realize: They allow you to capture the returns of investments that performed well.
The chart below shows the performance of the global stock market:
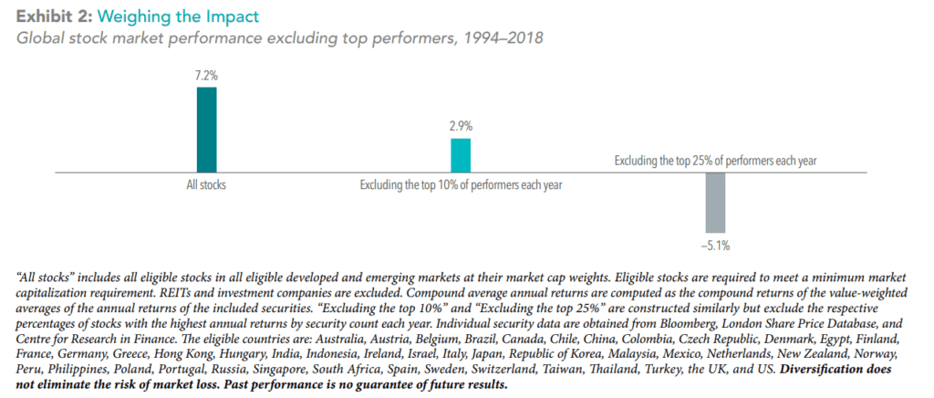
If we view the performance of all the stocks considered, the return is 7.2% p.a.
But if we exclude the top 10% of the market performers each year, the returns drop from 7.2% to 2.9% p.a.! If we exclude the top 25% of the performers, our returns become -5.1% p.a.
What this shows is that diversification is powerful not just to mitigate downside risks but also upside capture.
Remember the charts that the returns of the median stocks and below are poor relative to the top performers? Diversification is how you can make sure that your portfolio stands a good chance to capture the upside.
Investing in A Diversified Portfolio
When you invest in an ETF like VWRA, effectively, you are holding a diversified portfolio of developed and emerging market stocks. If you hold the CSPX, which is an ETF that tracks the US Large Caps. If you hold the EIMI, you invest in a basket of emerging market stocks. If you hold a REIT ETF, you own a basket of REITs.
This is the same for fixed income.
In finance, we say there are two kinds of risks:
- Non-Systematic Risks: The risks that is attributed to a specific fixed income or company.
- Systematic Risks: The risks that affect an overall market, or market segment.
When we diversify, we eliminate the non-systematic risks leaving us with the systematic risks.
We are still affected if there are events in the market that affect overall earnings growth, risks, margins such as inflation, geopolitical events.
But if you own three Singapore companies and an atomic bomb lands in Singapore, the impact will be far greater than owning a portfolio of well diversified equities.
Returns in a Diversified Portfolio is Driven by the Risks that the Portfolio is Exposed To
If we add all we learn together, that our goal is to own a portfolio made up of risks because a portfolio of risks:
- Reduce the chances of single blow-ups killing our capital.
- Earn enough returns for our financial goals.
So this is what a portfolio looks like:
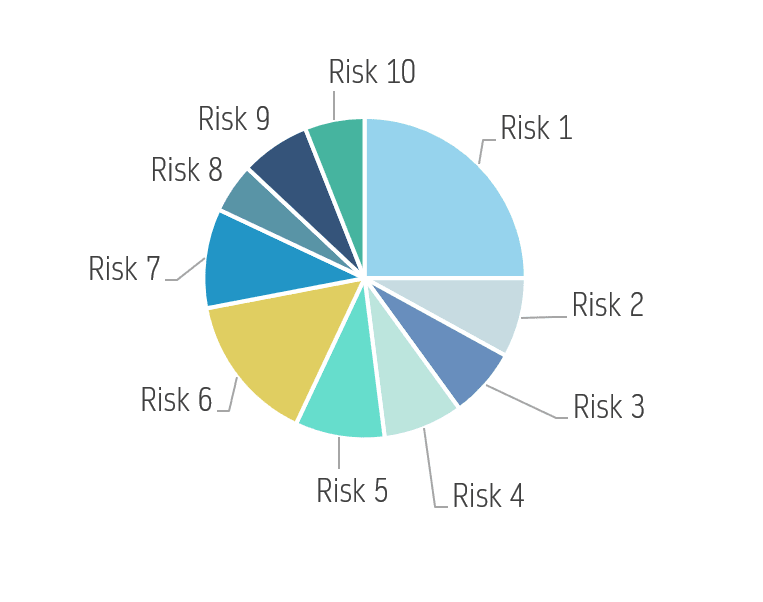
This will fxxk with people’s brains because usually, they will see a pie of different returns while I prefer to lead with risks.
Our future expected returns, will be determine by the returns for taking the 10 risks in this portfolio as an example.
But is there a way to know what kind of returns we will earn?
The Index Portfolio – A Portfolio that Owns the Market Risk of a Segment of the Market
What if we could own a basket of stocks that is investable around the world? What if we could own a basket of fixed-income instruments that is investable around the world?
This is the premise of the creation of index funds or index exchange-traded funds (ETFs).
In the early days of the actively-managed unit trust industry, managers wanted to have a way to measure that they could do very well so certain companies create these indexes that own different market segments such as US companies, German companies, US Treasury bills of 10-year tenor, Investment-grade bonds.
You might be familiar with indexes such as:
- MSCI World
- S&P 500
- FTSE-All World Index
- FTSE 100
- STI Index
Fund managers of actively-managed funds measure their performance against these indexes. Jack Bogle of Vanguard was among those early ones who wonder: Instead of investing in the active funds, why not just create a fund that tracks the index and own the index?
So that gave birth to the index funds or ETFs such as SWDA, CSPX, VWRA, ES3 (these are the ticker symbols to the ETFs).
When you own these ETFs, you gain the risk exposure equivalent to the basket of underling securities and therefore the eventual returns.
Usually, these indexes seeks to represent the performance of the market segment.
Thus, when we own these index ETFs or unit trusts, we take on the risk of investing in an entire market segment, or market risk.
The Emergence of Computers and Subsequently Market Return Data Gave Investors a Glimpse if We are Compensated Our Investment Risk Taking.
Perhaps one of the biggest innovation was the emergence of the computers in the 1960s and 1970s.
Due to that, the researchers in the past can codify and record down the returns of stocks and other financial instruments.
With that, the researchers is able to analyze the data and decipher different things.
For one, it allows us to see by taking risk and invest in equities, is there a market risk premium:

The chart above shows the US equity returns minus Treasury bills. The difference allow us to see whether investing in equities over risk-free bonds is compensated with a premium.

This is developed ex US.

This is the emerging markets.
With data it also allow us to gain confidence in whether we will be compensated if we invest long enough:
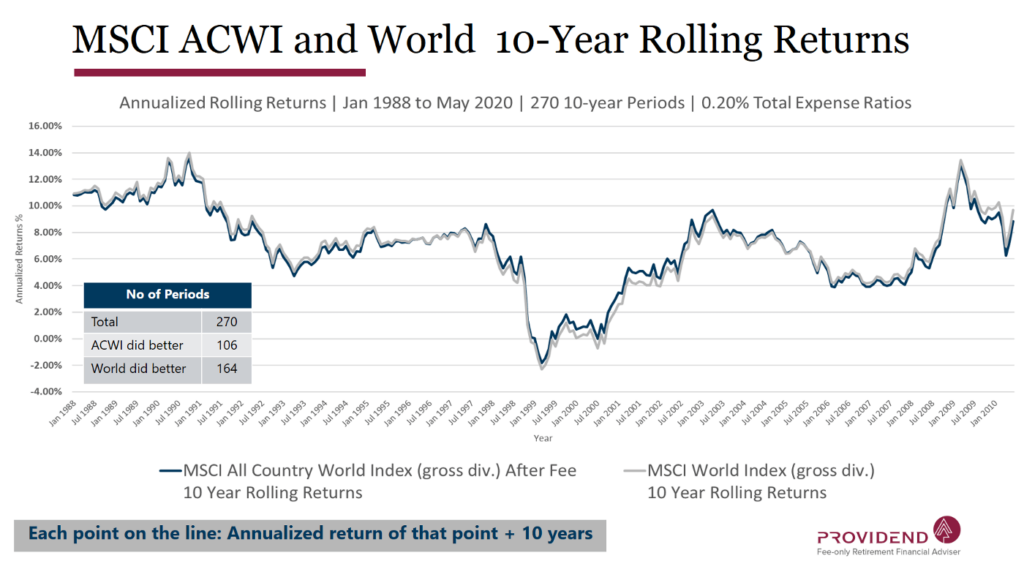
The above chart shows the ten year rolling returns of the MSCI All Country World Index (Developed + Emerging Markets) and MSCI World (Developed Markets). The data allow us to feel roughly what is the returns to be expected.
There is no fixed return and in certain 10 year periods, the returns can be negative.
This shows that there is risk of not working out, and this is the risk that allow the possibility of the higher return.
The future may not look similar to the past, but the past gives us the best glimpse of the return probabilities.
What We Want is to Craft a Portfolio of Compensated Risks
I drew the following illustration in my video Crafting an Ideal Passive Investment Portfolio for Your Life Goals:
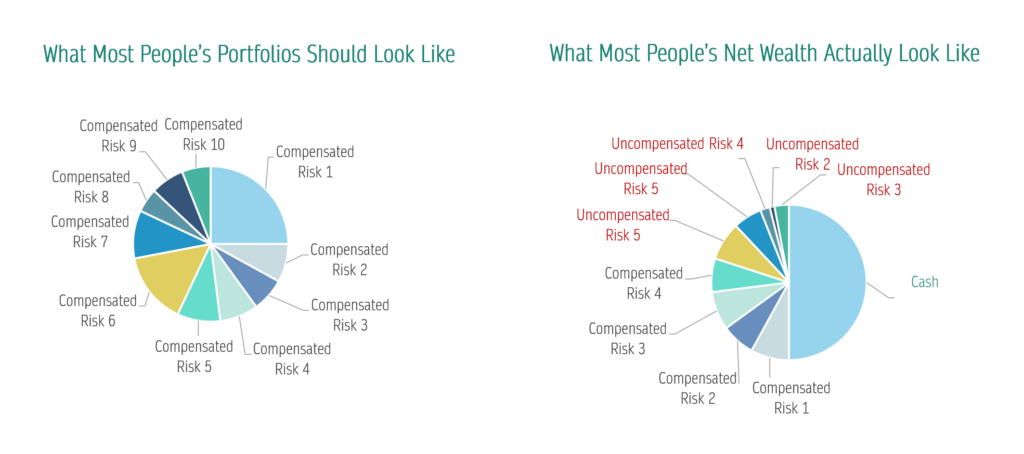
Most people will have a portfolio on the right because many parts of their portfolio is not too evidenced based. They end up with a portfolio they are disappointed with.
With the evidence of history (data), we want to craft a portfolio with
- A firmer foundation based around risks that we have a higher probability of getting compensated.
- Be diversified not around just one risk but more so that when one risk factor is correcting, other risk factors smooth out the returns.
Aside from Market Risks, Are There Other Unique Compensated Risks?
Market Beta – The Original Factor or Compensated Risk.
In the 1960s, the primary model to model returns and risk is the Capital Asset Pricing Model or CAPM for short. In William Sharpe’s 1964 paper Capital Asset Prices: A Theory Of Market Equilibrium Under Conditions Of Risk, he describes risk in the CAPM framework as the sensitivity of an asset or portfolio and the risk of the overall stock market.
A market-cap weighted equity index fund would have a market beta of 1. If we fill the portfolio with 50% cash instead of 100% equity, the beta of the portfolio will be 0.5. If a 100% equity portfolio go up by 10%, the portfolio with 50% cash will go up by only half or 5%. The market beta measures the sensitivity of the portfolio to market risk.
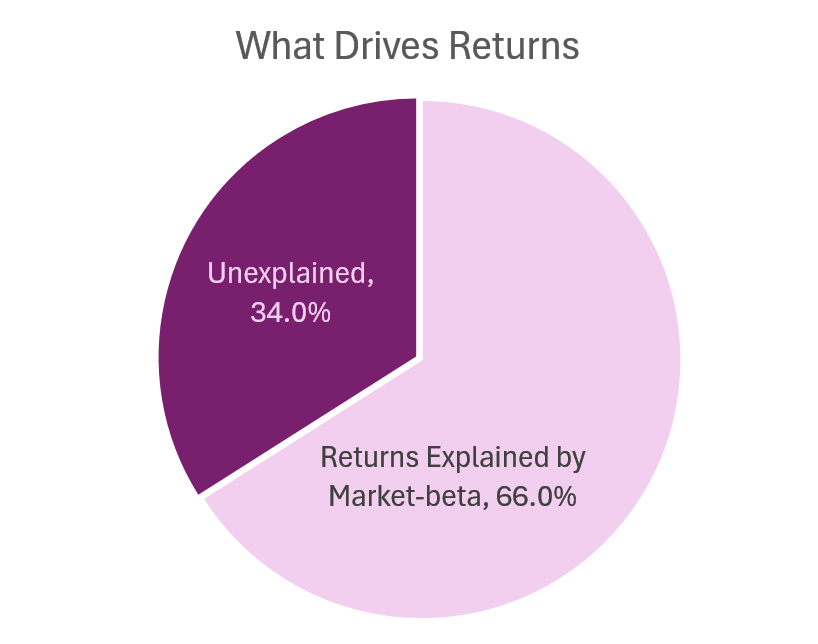
The CAPM says that 66% or 2/3 of the overall returns we will earn can be attributed to market beta.
What about the other 33%?
There is no easy way to explain and so we call that portfolio manager skill.
Back then, we can only compare two portfolios with market risk. If two portfolios have the same beta, the difference in return is attributed to the portfolio manager’s skill in stock selection. If a portfolio manager can deliver a higher return with the same beta, people would want such a manager. This manager is said to be able to deliver Alpha.
Overtime, the CAPM is shown to be flawed by a series of further research:
- 1981 – Rolf Banz – Small Stocks had consistently higher average returns that could not be explained by their market beta. In other words, viewed through the CAPM lens, small stocks are generating Alpha, which feels weird.
- 1985 – Value stocks have higher returns, which cannot be explain by market beta.
These research seem to explain that the market is not too efficient and therefore some portfolio manager can consistently earn Alpha.
Fama-French Formerly Identifies Other Compensated Risks in their 3 or 5-Factor Model Studies.
Eugene Fama and Kenneth French examined the data and proposed that the market is not inefficient but that other risks were unaccounted for.
These risks mean that the higher return has some cost and is not “free money.”
In their Fama-French Three Factor Model, the two proposed two more previously unidentified risks which help to explain the difference in returns together with market risks:
- Market Beta
- Small Size
- Value
When they added these two factors together with market beta, the Alpha seen in value and smaller stocks disappeared.
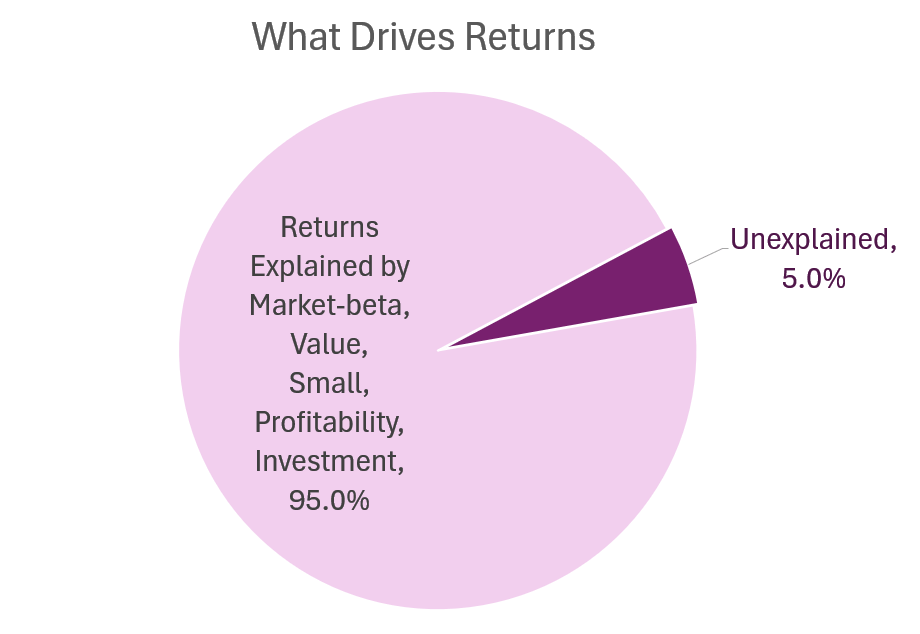
These three factors explain 90% of the return difference between diversified portfolios.
Fama and French eventually identified two more risks factors in their Fama-French Five Factor model:
- Market Beta
- Small
- Value
- Profitability / Quality
- Investment
These five factors explain 95% of the returns difference between diversified portfolios.
The Rise of ETFs and Unit Trusts that Give Us Exposure to These Factors.
Now we asked ourselves a question:
If you want a high probability of earning a high expected returns, and if returns, based on data show that majority of the returns can be due to these factors, what would you do?
One of the answer may be to craft a portfolio that has exposure to these risks areas.
This is how I designed my portfolio.
In the past, if you have a philosophy towards value, or momentum, or investing in high quality companies, you need to find a fund manager that has that philosophy and are exceptionally good at their job.
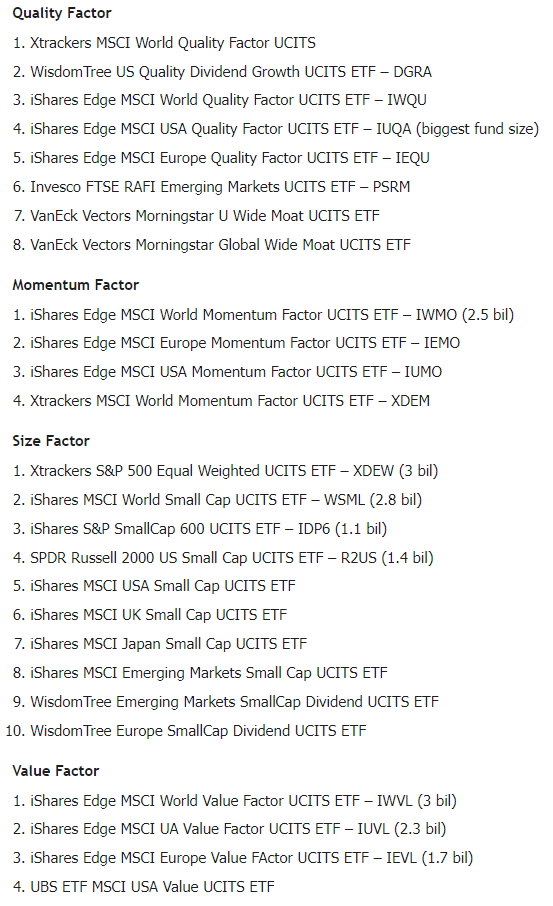
Now, you have these Smart Beta or factor funds that allow you to express these philosophy. I shared more in Intro to Smart Beta Passive Investing for Singaporeans.
Dimensional Fund Advisers is a name that is more familiar in this part of the world that has funds tilted towards some factors.
Here is a peek (non-exhaustive) at the other ETFs that is available on the London Stock Exchange:
Have We Surfaced All the Compensated Risks Identifiable?
I want to think we haven’t.
Researchers are motivated to find new factors that are homogenous and explain the difference in portfolio performance in an effort to win research awards to advance their own position. Finance industry are also motivated to find a new angle to sell to you.
In the past, we have seen a few research paper that comes out to explain these unique factors from small, to value, then momentum, then quality, with recently more on illiquidity.
I don’t think it is the end.
Aside from Risks that Drives Factor Returns, Are There Other Drivers of Factor Returns?
In an earlier section, I shared that what drives returns is whether we take risk and whether we are successfully compensated for the risk we take.
There are some who believe that another dominant force in play is the behavioural element.
As a collective, or different group of people have a tendency to be very optimistic, pessimistic about different securities at one time and this give rise to the presence of factors.
MSCI has one of the better framing for this in MSCI – Foundations of Factor Investing. (This is a good read for those interested).
They explain that this is a debate and the proponents usually fall into two camps:
- Systematic Risk-Based Theories: These theories assume that markets are efficient and that factors reflect “systematic” sources of risk. They also assume that investors are rational.
- Systematic Errors-Based Theories: Investors exhibit behavioural biases or are subject to different constraints (e.g., time horizons, ability to use leverage, etc.). These factors exist because investors systematically make “errors.”
There are numerous research that support both theories, and MSCI summarizes things in the following table:
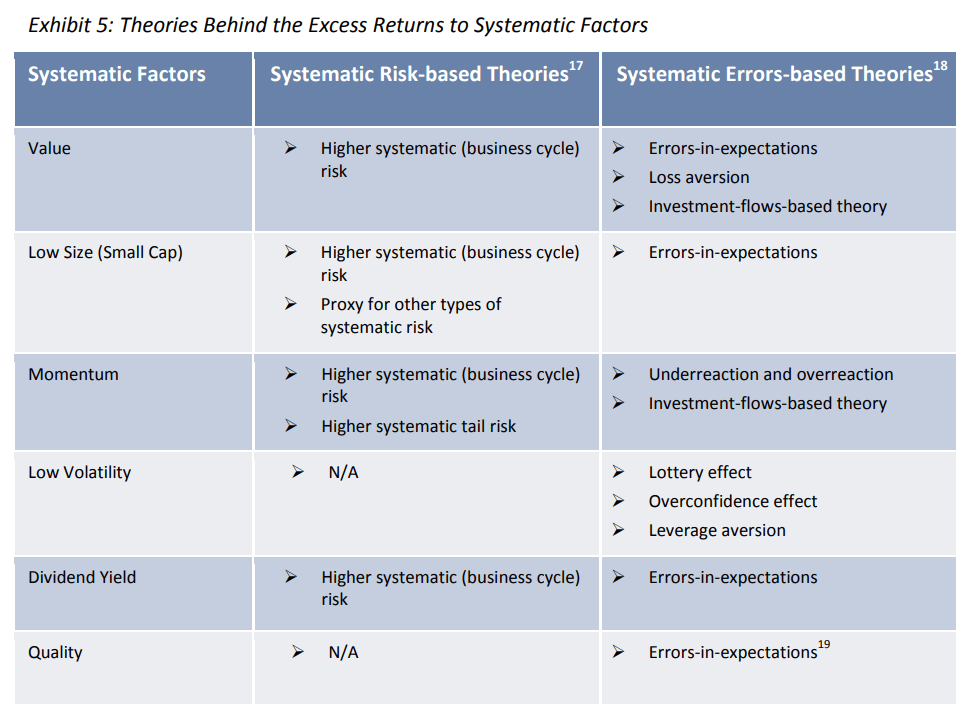
Risk-based have a better explanation for Value, Low Size, Momentum and Dividend Yield. Errors-based have a better explanation for almost all things.
Which one do I believe in?
I think as an aggregate the market is not entirely efficient, but evidence have shown that even if it is inefficient, not everyone of us can take advantage of that inefficiency. The market constantly tries to reprice things to reflect fair value and we should recognize that. Of course, there are markets that are less efficient such as the real estate market.
I do think that as an aggregate, human beings cannot shed certain behaviours. We grew overconfident that trends last longer, or too pessimistic that trends cannot turn. We are too pessimistic over stocks that exhibit real quality and too optimistic about other things.
What this section means is that there are genuine drivers of why we would get good (and poor) returns.
If in reality, the risks of investing in equities are lower today than in the past, returns are going to be lower. But that may balance off if human beings doesn’t change as we constantly makes errors.
Conclusion
And this is the extended version of what I think drives returns.
I wonder how many people look at things in a similar fashion. It took a couple of months of flipping parts of these returns stuff in my head before coming to this. Hopefully it is coherent enough.
What drives returns is important in that if what drives returns is not risks or behaviour but something else, then my entire portfolio may be setup wrongly.
So I felt compelled to put this out before the actual portfolio notes.
Which should be the next one.
I invested in a diversified portfolio of exchange-traded funds (ETF) and stocks listed in the US, Hong Kong and London.
My preferred broker to trade and custodize my investments is Interactive Brokers. Interactive Brokers allow you to trade in the US, UK, Europe, Singapore, Hong Kong and many other markets. Options as well. There are no minimum monthly charges, very low forex fees for currency exchange, very low commissions for various markets.
To find out more visit Interactive Brokers today.
Join the Investment Moats Telegram channel here. I will share the materials, research, investment data, deals that I come across that enable me to run Investment Moats.
Do Like Me on Facebook. I share some tidbits that are not on the blog post there often. You can also choose to subscribe to my content via the email below.
I break down my resources according to these topics:
- Building Your Wealth Foundation – If you know and apply these simple financial concepts, your long term wealth should be pretty well managed. Find out what they are
- Active Investing – For active stock investors. My deeper thoughts from my stock investing experience
- Learning about REITs – My Free “Course” on REIT Investing for Beginners and Seasoned Investors
- Dividend Stock Tracker – Track all the common 4-10% yielding dividend stocks in SG
- Free Stock Portfolio Tracking Google Sheets that many love
- Retirement Planning, Financial Independence and Spending down money – My deep dive into how much you need to achieve these, and the different ways you can be financially free
- Providend – Where I used to work doing research. Fee-Only Advisory. No Commissions. Financial Independence Advisers and Retirement Specialists. No charge for the first meeting to understand how it works
- Havend – Where I currently work. We wish to deliver commission-based insurance advice in a better way.
- The Cheapest Way to Extend Your Laptop to TWODisplay that I Can Find. - April 29, 2024
- My Quick Thoughts on the Net Cash, 4% Yielding Boustead. - April 28, 2024
- My Dividend Experience Investing in UCITS iShares iBond Maturing in 2028. - April 23, 2024

