Many readers have read past articles where I mention the safe withdrawal rate or specific articles that talk about the 4% Rule or safe withdrawal rate (SWR for short).
The articles would discuss whether the 4% Rule is still relevant or safe enough in this time and age.
Before writing this article, I did not formally explain the safe withdrawal rate to my readers really, but I think it will do readers an injustice if I don’t help explain this once and for fall.
There is just too much misunderstanding over the whole 4% Rule or safe withdrawal rate study, which has resulted in many articles leading retail investors to think in various ways.
Before we criticize something or say something is good enough, we must understand how the safe withdrawal rate is derived. Then we can start critiquing its robustness.
In this article, I will start from the very beginning and try to answer various questions about the safe withdrawal rate.
Here are some of the topics we will cover:
- Origins of the safe withdrawal rate
- Going through how it is constructed so that you can understand how robust the framework
- Does the income adjust for inflation?
- What is the assumed rate of return?
- Does recent volatility and change in the economic regime affect the SWR?
- What makes extracting income from our portfolio so challenging?
- What will make our income last longer
- What if I need the income to last more than 30 years?
- How does fee affect the retirement math?
- Good withdrawal rate numbers to keep in mind when you are planning for your financial independence
- Would be flexible in spending help?
- Can Smart Beta Portfolios or Multifactor Portfolios improve the SWR outcome?
- SWR versus Dividend Portfolio Strategy
- SWR versus Retirement Income Products
- SWR versus Annuities like CPF LIFE
- SWR versus Monte Carlo Simulation
- Free SWR Calculators that do not suck
- Nifty uses of the Safe Withdrawal Rate Framework
- How to implement a low-cost, passive portfolio wealth machine
Lots to get through, so let us get started.
What is the Safe Withdrawal Rate, and How did it Come About?
We can look upon the safe withdrawal rate more as a framework to derive a single number that explains a complex financial problem.
In 1994, a rather newly-minted financial adviser called Bill Bengen was plagued by a problem that you may be asking yourself today:
- How much do you need to accumulate for your retirement?
- How much can you safely spend in retirement, so you do not run out of money?
- What would the ideal asset allocation be in retirement?
These three questions are linked to one another. We cannot figure out one without answering another.
I am sure those planning for your retirement are also trying to find the answer to these three questions.
Bill Bengen did his research and deduced that if you spend less than 4% of your portfolio in the first year of your retirement, then adjust subsequent years by the prevailing inflation, your money will last 25 years. Back then, 25 years plus 65 would add up to 90 years old, which is a reasonable estimate with a margin of safety due to the longevity of the people.
Why is it called the withdrawal rate?
This is because you are trying to “withdraw” money from your portfolio. You can always replace it with spending or income rate, which they used last time.
So safe withdrawal means conservative spending.
Safe Withdrawal rate = [Your income/spending requirement] divided by [ Current portfolio value or total investable assets]
If you take your income requirement of $40,000 and divide it by your portfolio value at retirement of $1 million, you will get 4%. Alternatively, you could take $35,000 and a 4% safe withdrawal rate and figure out that you need $35,000/0.04 = $875,000 to generate that inflation-adjusted income.
Since then, a whole bunch of research by various groups of people have spawned from Bengen’s work.
You should read Bill Bengen’s original 1994 article. Here is the link to the PDF copy.
In my opinion, you should look at Bengen’s work and the subsequent work as a framework to determine:
- The amount of spending/income you can safely extract from your portfolio
- The different historical sequences of economic regimes, inflation and market returns are embedded in the framework
- This will help you assess the ideal setup for your retirement
Many things are embedded behind a number, such as 4%, and without understanding enough, you may feel less convicted about your financial independence plan, even if the number tells you you have enough to retire.
How is the Safe Withdrawal Rate Constructed?
Bengen basically starts with a very standard asset allocation that is ideal for most investors with reasonable risk tolerance:
- 50% invested in S&P 500 or equities
- 50% invested in long-term US government bonds
He has access to long-term total return data for both of these datasets.
His goal:
Find out the highest income/spending/withdrawal percentage that can be extracted from this portfolio that can last 25 years and not run out of money.
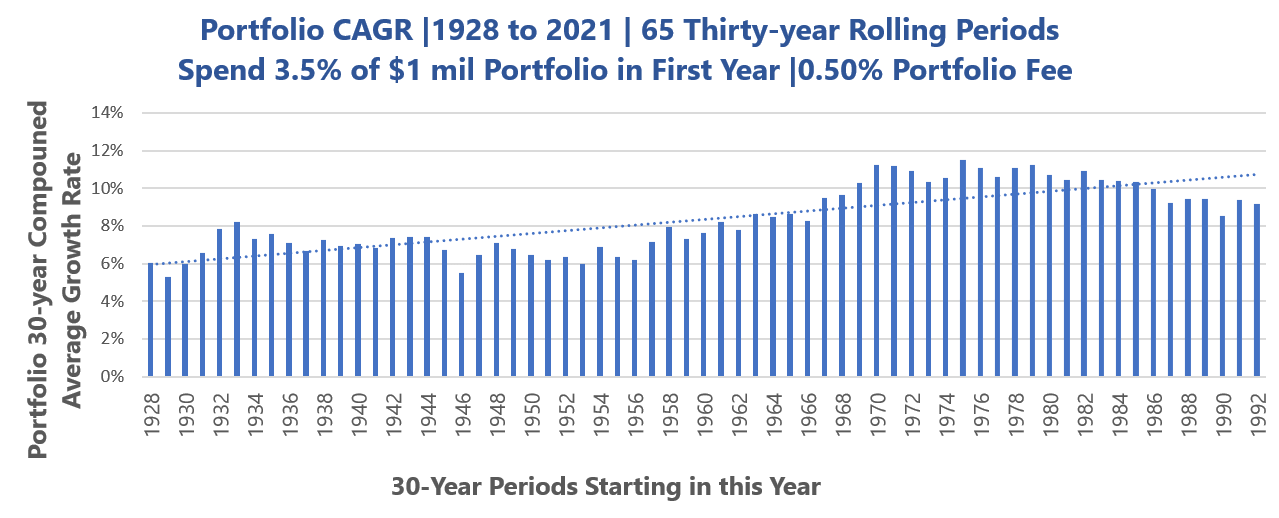
I will try to replicate his research in my own way. I have the data, but since today (2022), we have at least 30 years more data than him, we can have a richer analysis. My setup is slightly different, but I think you will have a good idea as well:
- 50% S&P 500 [Data from 1928 to 2021]
- 50% Long-term US government bonds [Data from 1928 to 2021]
- Embed an annual fee of 0.50%
- Rebalanced annually
- Roll by calendar years
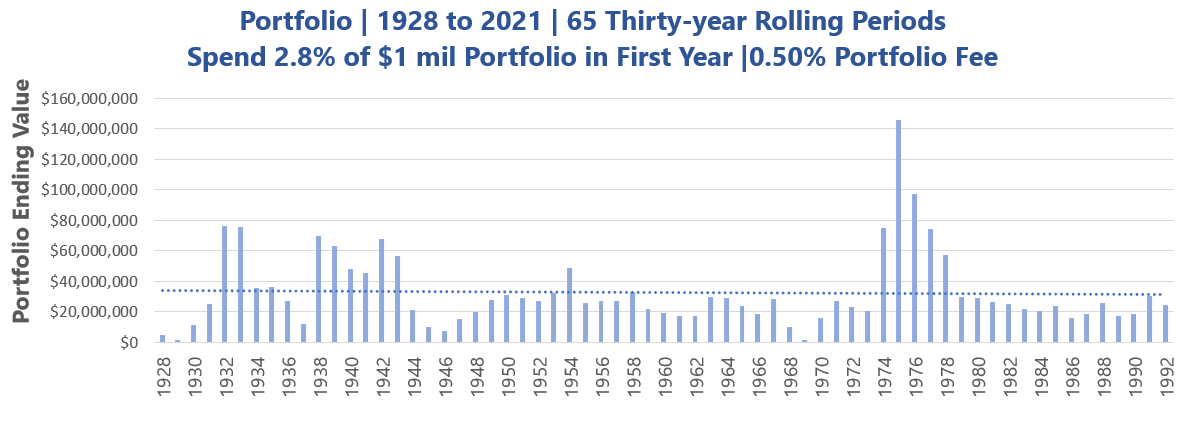
We start with the simplest: If we spend 1% of the portfolio in the first year, could all the 30-year periods from 1928 to 2021 last?
Here are the results:
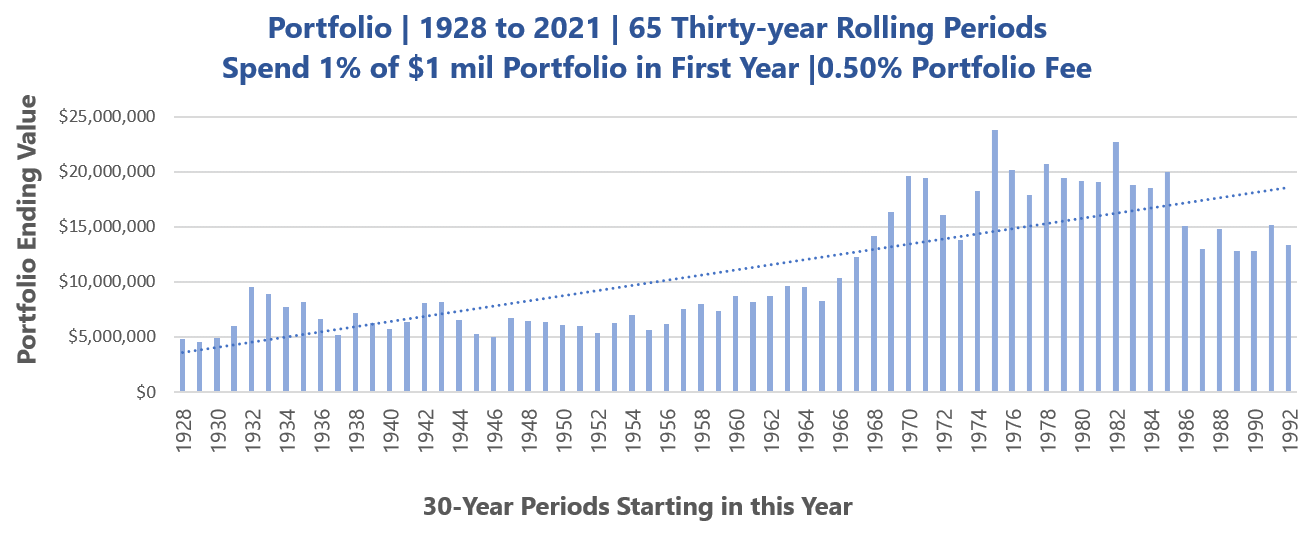
There are 65 thirty-year periods in this 1928-2021 timeframes. During this period, there were different economic, inflation and market regimes.
This table would show the ending portfolio value if you lived through one of these starting years.
You would notice that if you start with $10,000 a year in spending on a $1 million portfolio, you will not run out of money. In the worst sequence, you are left with close to $5 million; in the best sequence, you would be left with close to $24 million!
While this is safe, we can see that spending 1% is not very efficient.
On your deathbed, you would be left with so much money.
So this is why Bengen tries to find the highest income/spending rate so that you will not run out of money to maximize efficiency.
(On a separate note: If you calculate your annual expenses, and it is roughly 1% of your portfolio or investable assets, here is proof that most likely, you will not run out of money for a long time)
Digging Deeper: How is Each 30-Year Period Simulated?
Not many articles take you behind the scenes on how each year may be simulated.
Let me try to do that.
I think this is what caused the most confusion.
Here is a 30-year period starting in 1955 and ending at the end of 1984:

This is just one instance in the 65 thirty-year instances.
You would notice:
- The market returns reflect the performance of the portfolio from 1955 to 1984. While the compounded average growth (CAGR) is 6.63%, the actual returns are messy. In this period, the 30-year has been really good for a 50/50 equity/bond portfolio.
- The inflation rate can vary. The average inflation rate is 4.7% (rather high), but there are some years when inflation is 13.29% and some years when inflation is 0.97%.
- The income/spending/withdrawal does not stay constant at $10,000. It is inflation-adjusted based on the previous year’s inflation. This will help you simulate more realistically the spending. If the previous year the inflation was low, your adjustment is low. If inflation is high, the spending adjustment is high.
- By the end of the 30-year, we can observe that the income has gone up from $10k to $37.9k
- By the end of the 30-year, we can observe that the portfolio value has gone up to $5.6 mil despite the income extracted.
Every 65 thirty-year instance will be unique.
Hopefully, this will debunk some misconceptions.
Let us continue.
Increasing the Withdrawal Rate from 1% Upwards Until The Money Doesn’t Last Anymore
Since 1% lasts, let us slowly increase it to 1.1%.
If that last as well, let us increase it to 1.2%.
I could show this data, but it will bore you to tears. Let me show you what happens when we raise it to 2%:

If we spend an initial 2% of the portfolio, the money would still last, but we observe that the ending portfolio level is lower now. But still very high.
Let us increase the spending to 3%:
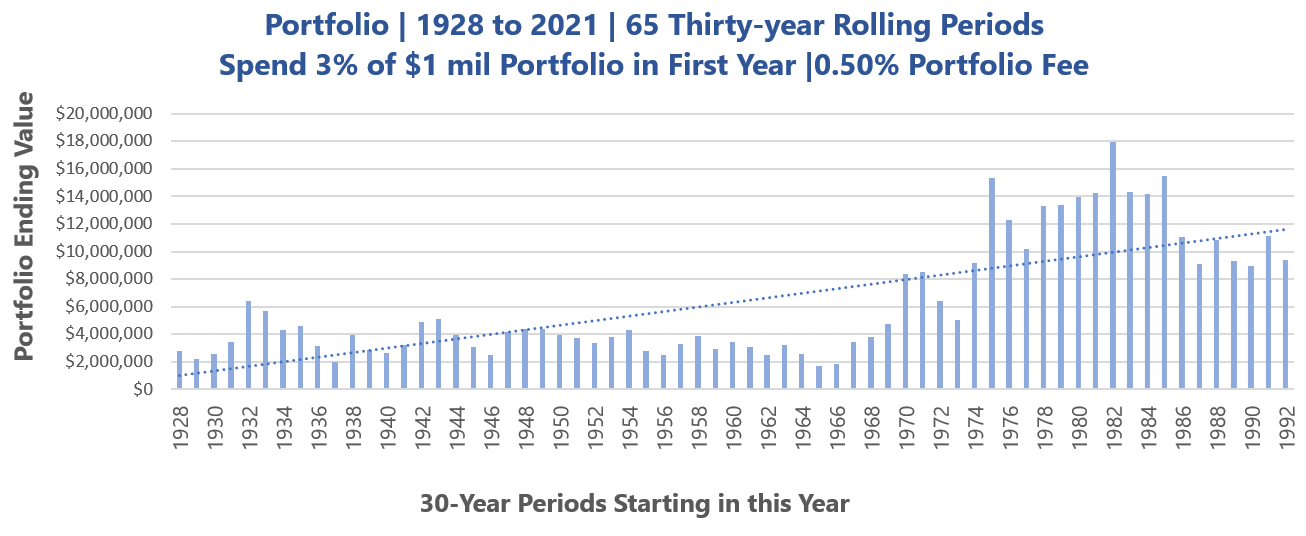
The ending portfolio value for the lowest is still above $1 million.
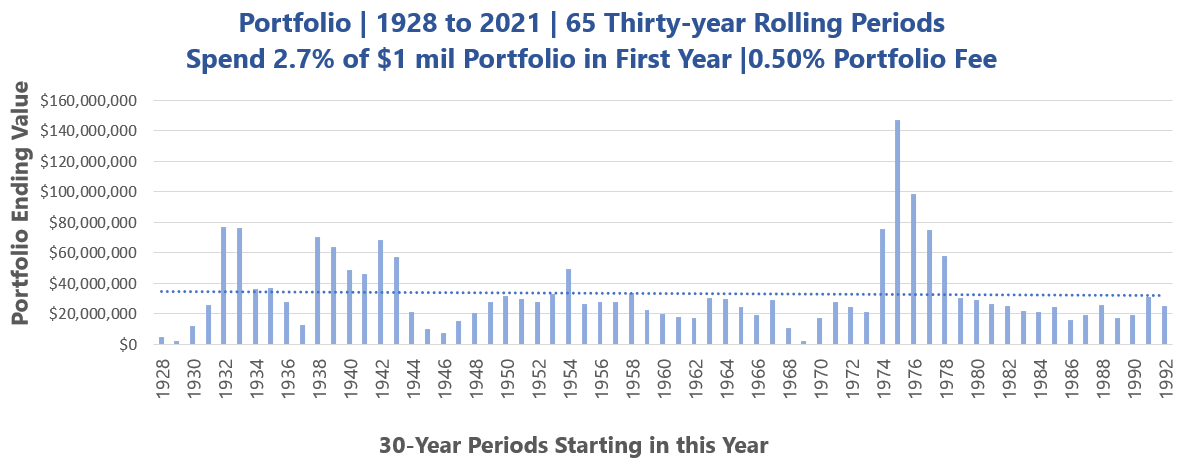
Let us increase the spending to 3.5%:
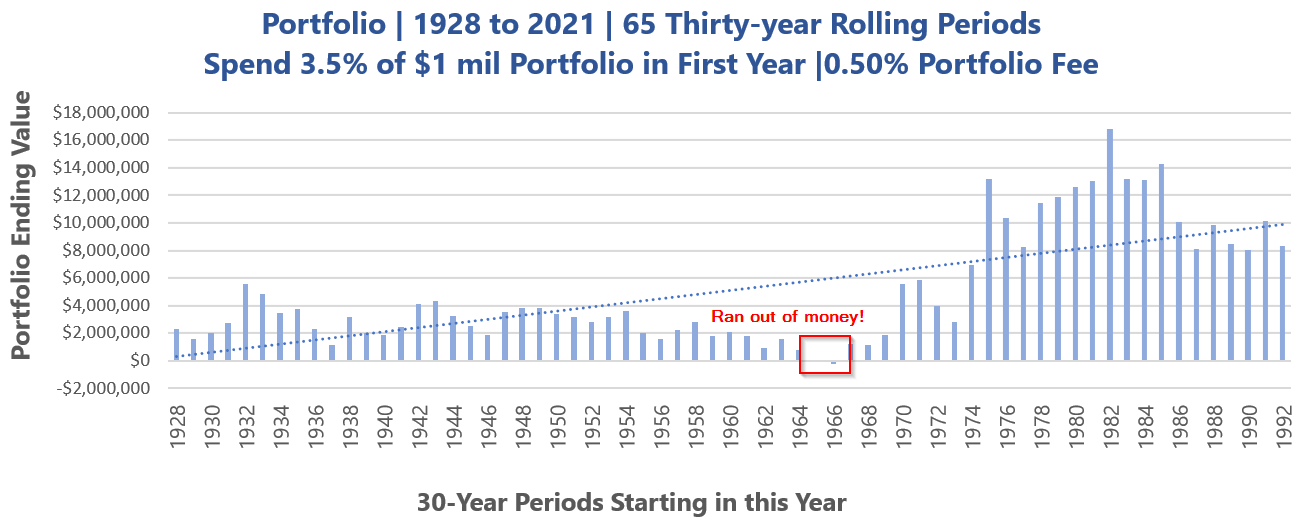
Now we see that the money does not last for some thirty years. Officially the safe withdrawal rate should be something close to 3.4% in this case.
Why is it so low versus 4%?
This is because:
- There are portfolio costs embedded in
- I use a thirty-year period instead of Bengen, who used a twenty-five-year period.
If the inputs are different, the safe withdrawal rate is different.
Hopefully, this gives you an idea of how the safe withdrawal rate framework derives and what the rate means.
Now let me try to answer some questions about the safe withdrawal rate.
The Safe Withdrawal Rate Framework Tries to Figure Out the Worst-Case Income/Spending for the Unluckiest Retiree
This is what the safe withdrawal rate means.
If we look at the last illustration, we have to admit that some people who retire will be very lucky (those in the 1980s), and some will be very unlucky (those retiring in the high inflation 1960s).
The safe withdrawal rate tries to be thorough enough and figure out the worst-case income and spending that you could afford to extract.
But it would mean for some lucky retiree, you would be left with too much money.
So will you be unlucky or lucky? We won’t know.
Should you plan based on whether you are unlucky or lucky? Bengen’s idea is to figure out what the most unlucky person needs.
I think Jim Otar provides the best example of trying to do structural construction for a tower:

If you are constructing a tower to be placed in a certain region, how would you go about doing it?
Is it wise to only construct the tower to withstand the wind speed of the last ten years? If not, what should you base the construction on? Should you use more critical thinking?
The Safe Withdrawal Rate looks excessive and thorough at times. But it is trying to be conservative.
It is interesting that right now… there are some who suddenly realize there is a possibility of living through the high inflation 1970s, which is a time period, unlike the past 20 years. If you have planned for it, your plan would be able to navigate that period better than a plan based on expected returns for the past 10 to 20 years.
Does the Safe Withdrawal Rate Factors in Inflation-adjusted Income?
Yes, it does.
Many retirement calculators try to come up with how much you need by assuming inflation to be 2%, 2%, 2%, 2%, 2% or 3%, 3%, 3%, 3%, 3%, and I wonder how realistic that is.
Does your inflation spending experience takes place like this? I don’t think so.
Here is a thirty-year sequence from 1966 to 1995 where your money won’t last if you use an initial withdrawal rate of 3.5%:
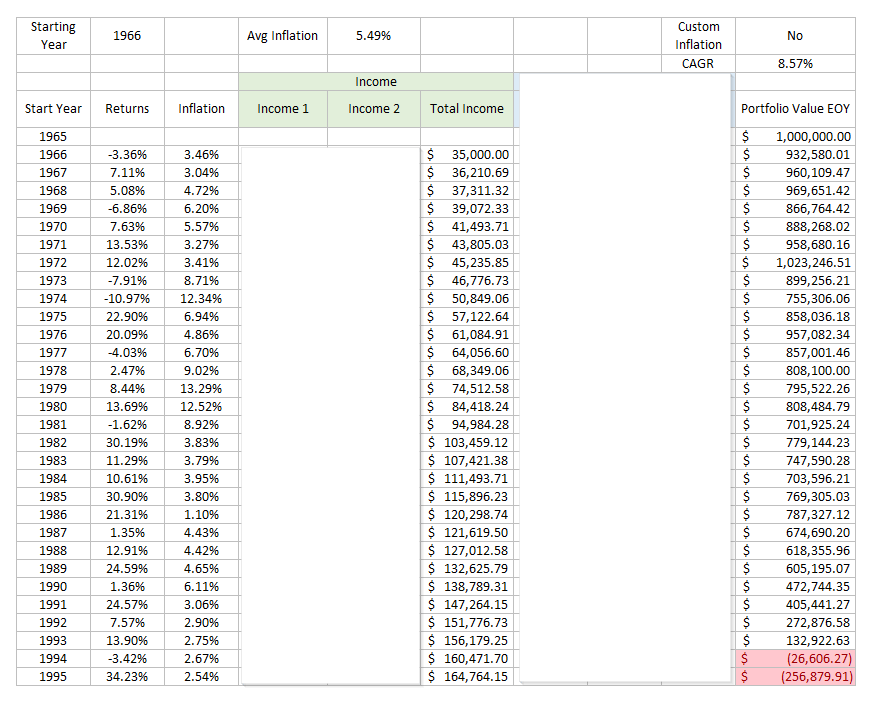
1966 to 1995 is one of the toughest thirty-year sequences (hint: If you want to test the robustness of your systems, try to go against this inflation sequence)
- Compounded average growth during this period: 8.57%
- Inflation during this period: 5.49%
The money gets exhausted at the end of 1993.
But look at the income that the safe withdrawal rate framework tries to extract:

The framework tries to extract some crazy income from the portfolio… due to the inflation rate during that period.
(On another note: as we write this in a rather high inflation tick, you might want to take some time to digest the inflation sequence during that period. Notice that inflation doesn’t go up in a straight line to create a catastrophic nightmare.)
Sometimes, I feel like banging my head on the wall when people ask me whether the 4% withdrawal rate factors in inflation or that they say it does not factor in inflation.
Given this kind of sequence, what other retirement planning software simulates this?
What Kind of Compounded Rate of Return Does the Safe Withdrawal Rate Assume?
This common question stems more from not knowing how the safe withdrawal rate framework works.
Here is the range of annualized compounded average growth rate (CAGR) for each of the thirty-year period from 1928 to 2021:
The average CAGR is 8.4%. All the years have a positive compounded growth. The lowest is about 5.3% a year. There is no such thing as a standard CAGR.
This is reality-based. The CAGR you enjoy will depend on how lucky you are.
This might unsettle some because 5.3% a year is considered decent for a 50% equity 50% bond portfolio.
Yet, this portfolio ran out of money in some sequences.
When you change the portfolio asset allocation, the CAGR changes.
What if We Lived Through a High Inflationary or a Period of Quantitative Easing? Would the Safe Withdrawal Rate still Work?
There is no such thing as whether it works well or doesn’t work.
The whole thing is a framework for figuring out income extraction in a certain manner.
Many of us lived in a present economic regime and would feel that new events that hit us are unprecedented.
But are things really that unprecedented?
How robust the safe withdrawal rate is will depend upon how broad is the dataset.
For example, this period of 1928 to 2021 factors in a lot of things:
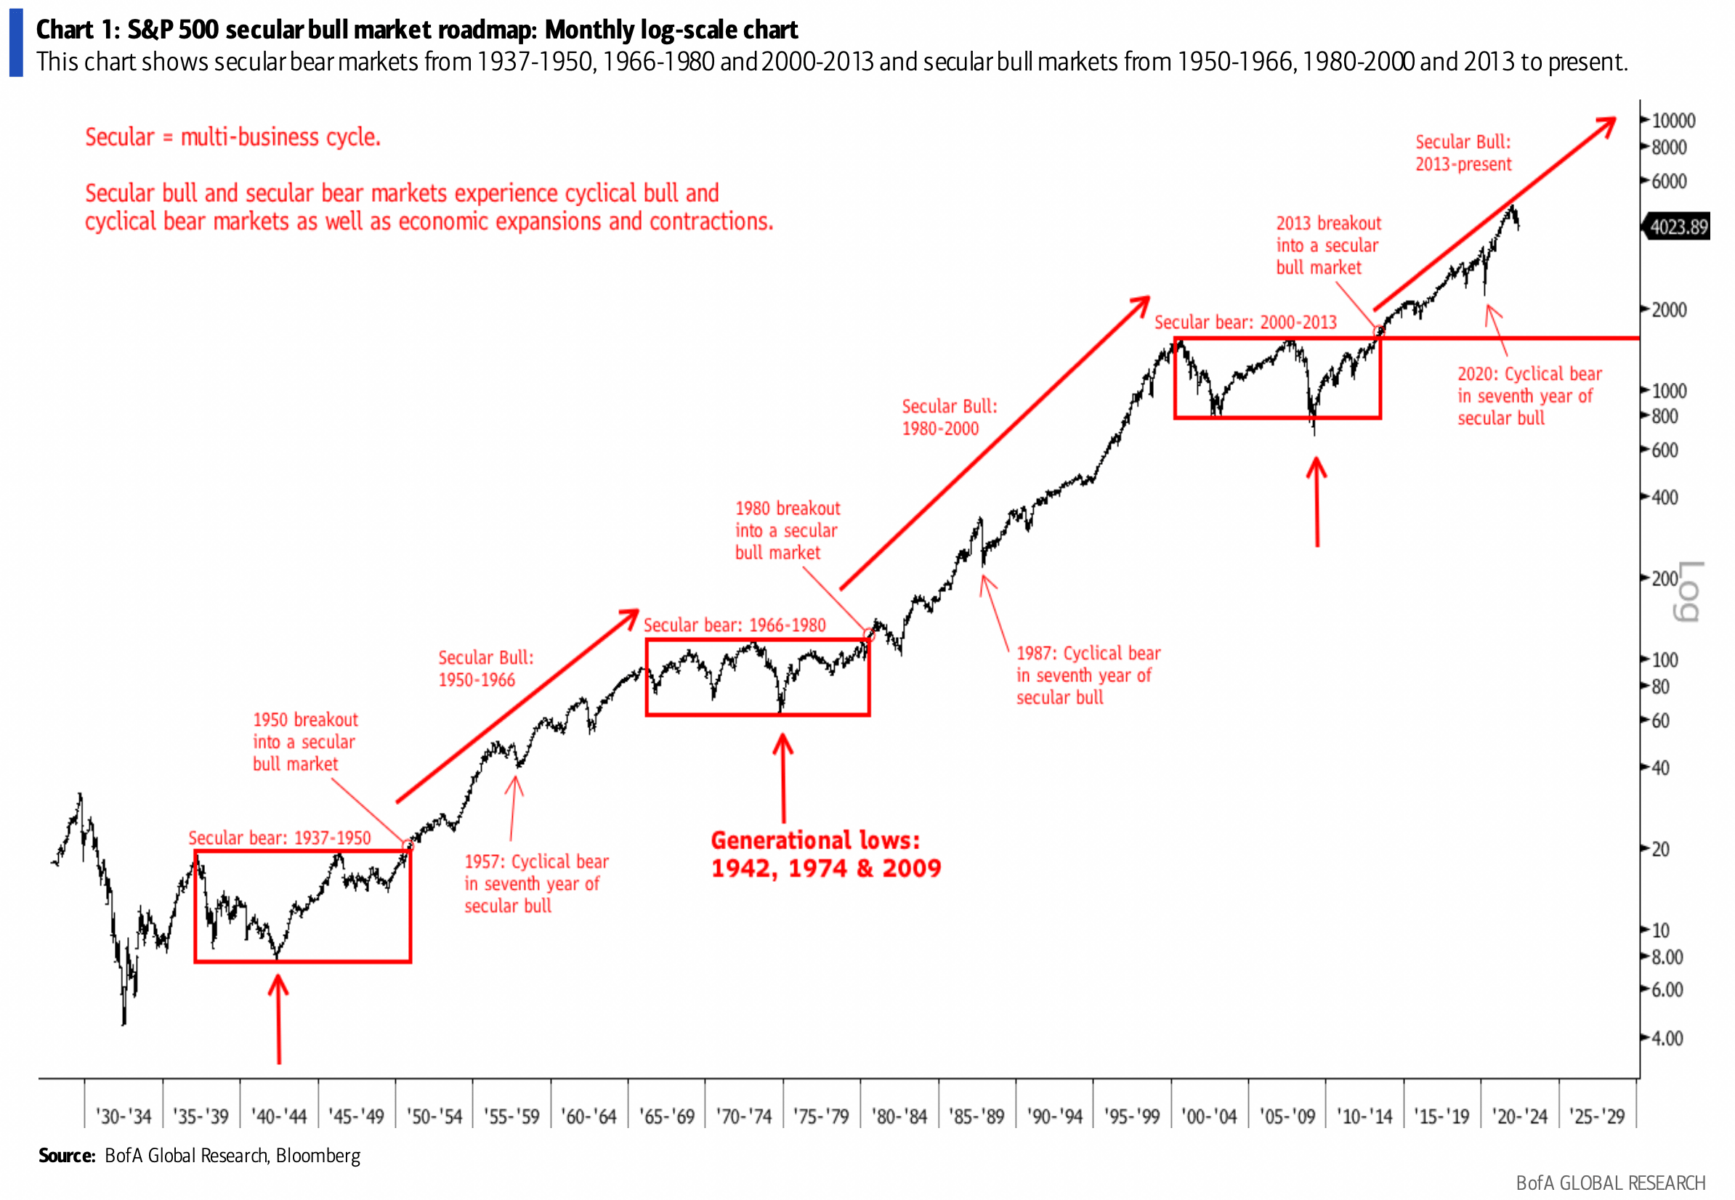
This time period probably factors in the secular bull and bear of different periods.
There are many bears of different magnitudes.
There were many major shock events.
Here is something to think about: How do people come up with asset allocation like this for different economic regimes?
Were they able to do it without the evidence of historical market and economic returns? They recommend this very much due to studying the evidence of history based on the market returns on the safe withdrawal rate.
The safe withdrawal study also studies how well this passive income wealth machine stands up against what history can throw at it.
After Bengen, many sought to expand the dataset, and the widest we see was a study from 1871 to the present day.
That would have factored in events such as World War 1 and the Spanish flu.
What Factors Make Spending down Your Portfolio So Challenging?
If I were to boil it down to key factors, they are:
- Sequence of return
- Uncertainty of inflation
- Volatility drag
Almost all three are interconnected, and you won’t be able to simulate them easily.
Many of us think of the negative return sequence as a period where the market is not doing well. Jim Otter relates the negative sequence to the volatility that is caused by changes in secular trends. Basically, when regimes shift, the different asset classes go into a funk.
Let us revisit this 1966 to 1995 thirty-year sequence where the money doesn’t last:
Notice that… the biggest drawdown during this calendar year was just -10% for the portfolio.
And this is one of the worst sequences out there.
For context, the average intra-year correction in the S&P 500 is about 14.8%.
What really killed was the high inflation-adjusted spending.
An intricate dance between market returns, inflation and volatility, makes it difficult to replicate in any other way.
High Returns Does Not Mean Your Portfolio Lasts!
There is a misconception that if my portfolio performs well, I will be able to extract more from the portfolio.
In the past, I wrote about volatility drag and why it is dangerous to look at things this way. (Read How Volatility Drags Your Income Portfolio in Financial Independence)
This is why the optimal equity portfolio allocation is between 40% to 80% equity allocation.
Just to be cheeky, let me replace the portfolio with a 100% US Small Cap index.
Here is a sequence of how the portfolio will die during the Great Depression:

Despite the depressive period, the portfolio grew at a compounded rate of 7.74% a year. This is very respectable.
In fact, the average CAGR of the portfolio in all 65 instances was 13.3% a year.
In the fourth year, the $1 million portfolio would be taken down to $134k despite the spending going down in a deflationary period. Even when the portfolio grew 110% in the fifth year, it didn’t help the portfolio.
What Would Help the Portfolio Last Better?
To prevent volatility drag, the solution is to make sure that the initial income that you extract from the portfolio is low enough such that volatility drag is not a factor.
Basically, stick with a relatively low enough initial withdrawal rate.
Going back to the 100% US small cap example, we will have to take the withdrawal rate down all the way, closer to 2.8%, for all the years to work out:
In the worst year, which is the period starting in 1966, the portfolio will be left with $1.1 mil, which is quite dangerous because the ending withdrawal rate is closer to 7%, which means it cannot last another 20 years.
But if we reduce the initial spending by 0.1% to 2.7%, the worst year will be left with $2.2 mil, which is very good to last for a long time.
What you would notice is that… if you are not unlucky, you might potentially be left with too much money.
This shows the inefficiency again here.
What if I Aspired to Early Retire? What if My Wealth Need to Last 60 years?
If you aspire to retire at 40 years old, which means that you need your wealth to last for 60 years, then the rate that works for a thirty-year retirement may not be good enough.
In this example, we spend the same rate ($35,000 a year in the initial year on a $1 million portfolio), but we want to see if it will last 60 years:
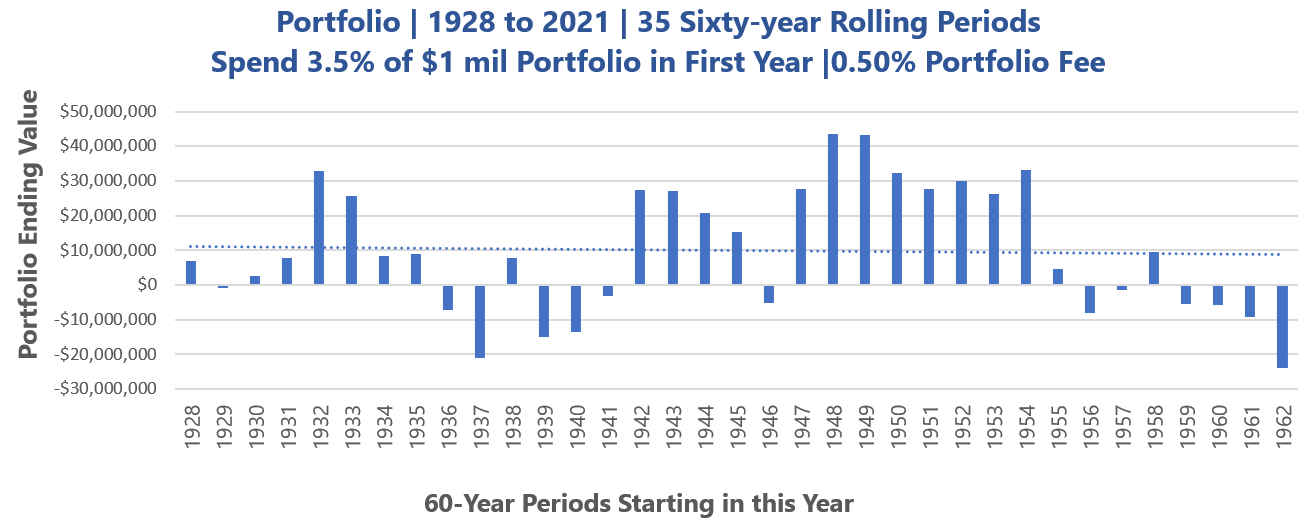
There are 35 sixty-year periods.
In 13 of those years, you would have run out of money by the end of the period. Some lucky retirees may be left with $40 million after spending so much.
Here is what happens if we reduce the income requirement to $27,000 a year or a 2.7% initial safe withdrawal rate:

The money safely lasts.
But you may be starting to see how come the “sweet spot” always seems to be a 2.7-2.8% initial withdrawal rate.
There is a rate to which the volatility drag is less of a factor, which usually takes place below 3.0%.
What Would Fees Do To the Retirement Math?
This one is straightforward.
Imagine some of the safe withdrawal rates is closer to 3%. If the fees are too high, it naturally means that there are some unlucky scenarios that your portfolio will run out of money.
Give me Some Good Rule of thumb.
Karstan at Early Retirement Now did up the simulation and a good table to show different portfolio allocation, time-horizon needed and the safe withdrawal rate:
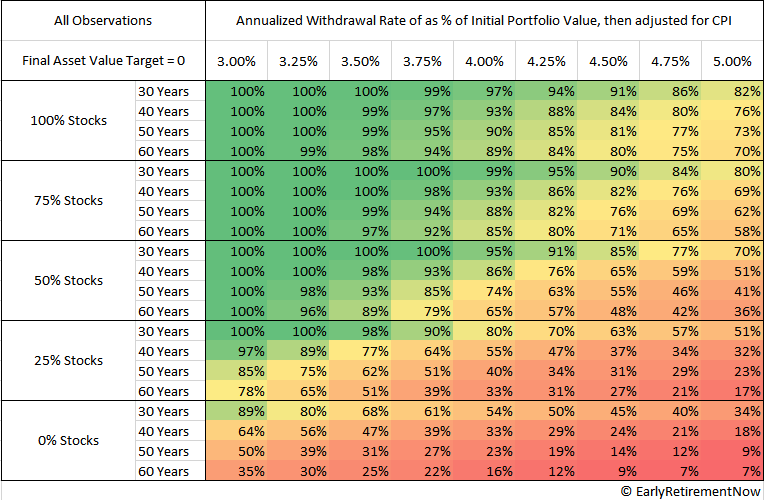
Karstan’s data spans 1739 possible retirement start dates between February 1, 1871, and December 1, 2016. This is as wide as possible
Each box shows the success rate. 100% means it lasts all these 144 years.
Note that these values do not include adviser or fund fees.
Karstan also provided a table if you wish to preserve your capital:
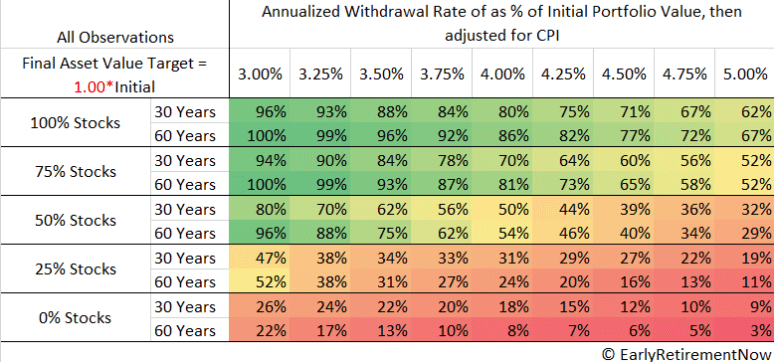
If you wish to preserve the portfolio value, you might need to step up to a higher equity allocation. The rate of return would matter in that scenario.
But you realize that the rate is still around the same range.
For Those Interested in Setting Up Your Portfolio for Perpetual Income
There is some research on the safe withdrawal rate if you need the money to last in perpetuity or close to that.
The first is Karstan’s work in the previous section on 3% for 60 years to preserve the capital.
Here are some more:
- Wade Pfau – Sustainable Spending Rates for Single Family Office – Less than 1.3%
- James Garland, Northwood Family Office – Fecundity of Endowments and Long-duration Trusts – Less than 2.7%
- Jim Otar – Perpetual Spending Rate for Foundations, Endowment and Charitable Trusts – Less than 2.3%
- Income planning in the most expensive market conditions – Greater than 35 times Shiller CAPE – Less than 2.8%
Except for Wade Pfau, most of the data starts from 1871. Wade Pfau’s research data starts from 1926.
What If I Decide to Be Flexible With My Retirement Spending?
I have written an article on the different types of flexible spending systems that you can incorporate into your retirement: Variable Withdrawal Strategies for Financial Independence- The Definitive Guide
Flexible spending makes your wealth last longer.
They make more sense, given that some lucky retirees may have too much money. So they would need a way to spend more systematically.
One of the flexible spending’s main drawbacks is that it makes your income not keep up with inflation. Another drawback is that can your income be flexible?
Imagine someone who is rather frugal in planning for his or her retirement.
There is already not a lot of variable in his or her budget. Can he or she cut down when times are bad?
Imagine someone planning for her income only for her daily survival food expense. She just wants to set aside a sum of money to rely on it to pay for her food if she needs it.
If you were here, would you be able to be flexible?
The best way to look at your expenses is that your expenses will have two portions:
- Flexible expenses – It May be possible to use flexible spending strategies
- Inflexible expenses – Most likely, you would use a safe withdrawal rate. It will have to remain conservative if it is an expense you cannot tolerate in failure.
Finally, in real execution, you might not get the kind of flexibility that you want.
For example, suppose we execute this flexible system:
- We spend an initial $50,000 on a $1 million 50/50 stocks/bonds portfolio. This is a 5% initial withdrawal rate.
- If the current withdrawal rate of the year exceeds 6%, I will reduce my income by 10% (the portfolio getting too small)
- If the current withdrawal rate of the year falls to 4%, I will increase my income by 10% (the portfolio getting too big)
- I will set a floor of $25,000 a year, which the income will not fall below.
Here is the income progression of a sequence that does not run out of money (1901 to 1931):
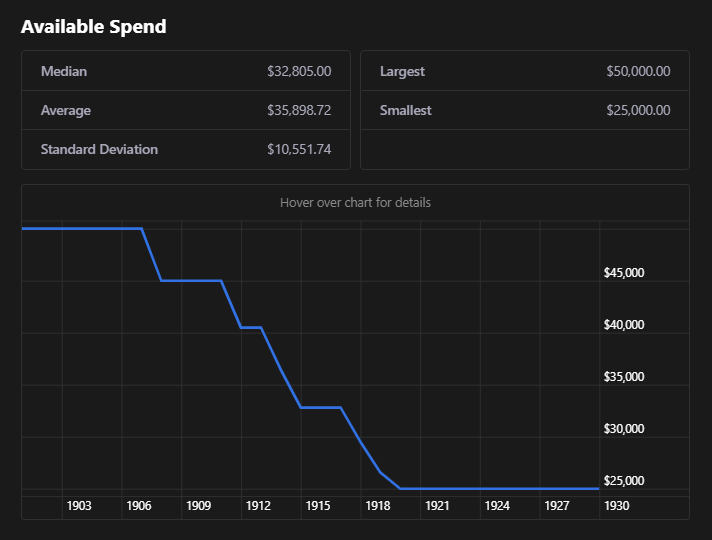
What we notice is that the income gets adjusted downwards and downwards. It never gets a chance to adjust upwards.
So effectively, what you get is close to a 2.5-3% withdrawal rate (the original safe withdrawal rate!).
A lot of the adjustments work out like this.
Those who talked about the virtues of flexibility might not have simulated the spending themselves.
Will a Multifactor Portfolio Improve the Safe Withdrawal Rate Outcome?
Some readers might remember that I introduce Smart Beta or Factor investing strategy to you in the past:
- Intro to Smart Beta Passive Investing for Singaporeans
- Would Smart Beta ETF Improve Your Returns If the Market Indices are Not Performing Well?
- JPGL vs IFSW vs Dimensional Global Core vs SWDA – 22-year Performance Showdown Comparison
Certain return drivers have been shown to deliver a premium over time across different asset classes.
We called these factors.
The factors with enough empirical evidence are:
- Value
- Momentum
- Size
- Quality or Profitability (a bit different, but people group them together)
- Low volatility
- Eliminate increase in asset size
- Carry for bonds
For Singaporean investors, a simple way is to invest in Dimensional Fund Advisers unit trust. You can also buy the iShares Multifactor ETF listed on the London Stock Exchange (which can be purchased through low-cost broker Interactive Brokers) or the JPMorgan Global Equity Multifactor ETF (JPGL), which is listed in London as well.
I decided to replay the spending an initial $35,000 a year on a $1 million scenario for 30 years but replace the S&P 500 with a Dimensional Index that simulates the factor tilts.
The Dimensional Index is made up of two portions:
- 1928 to 1974: Tilt towards the companies with smaller market capitalization and lower relative price (Size and Value)
- 1975 to 2021: Tilt towards the companies with smaller market capitalization, lower relative price, and higher profitability, excluding those with the lowest profitability and highest relative price within the small-cap universe. Also excludes companies with the highest asset growth within the small-cap universe. (Size, value, profitability and asset growth)
The difference between this Dimensional index is also that it covers the small-cap and micro-cap space. So it is the multifactor and expanded number of stocks.
The final allocation:
- 50% long-term US government bonds
- 50% of US stocks (whole market) tilted towards size, value, profitability and asset growth
- 0.50% portfolio cost
Here is the ending portfolio value of the Dimensional Index versus the S&P 500 Portfolio:
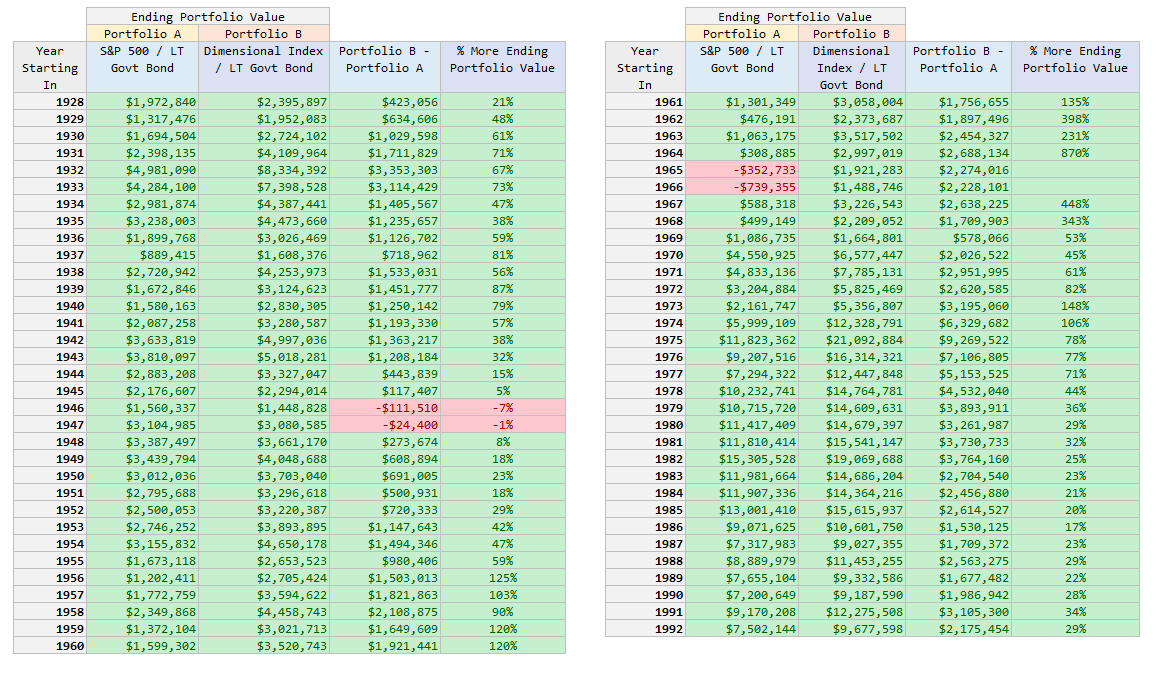
In our original case, the 3.5% initial withdrawal rate would fail in the thirty-year period starting in 1965 and 1966.
With the tilt towards the factors, the portfolio’s end-end value is now positive, $1.9 million and $1.5 million, respectively.
You would also notice that in most sequences, the multifactor portfolio produces an excess of portfolio value except for the two periods starting in 1946 and 1947.
Going by this, implementing factor tilts seems to benefit your retirement if you control the cost.
How Does a Dividend Portfolio Strategy Measure Up Against the Safe Withdrawal Rate?
If you view your dividend portfolio in terms of total return, your question will be how does the tilt towards higher dividend companies affect the safe withdrawal rate.
I don’t have the data for that, but dividend companies tend to be tilted towards quality, value and low volatility in a way. But unfortunately, I do not have the data.
But many would only prefer to spend only the dividend, which I think is a challenging strategy.
Revisiting that challenging 1966 to 1995 sequence, your dividend strategy would need to deliver this consistent inflation-adjusted income.
Would you be willing to sell your units if the aggregate dividend is less than your inflation-adjusted needs and your expenses are inflexible?
Some questions to think about.
How Does this Measure Against My Retirement Income Product?
When you purchase a retirement income product, be it an endowment plan or a unit trust, what matters is the underlying asset allocation and how different is the returns and volatility versus what I presented here.
- If the asset allocation is tilted towards more bonds, then their volatility is lower, but if you wish for it to survive longer financial independence, then it might not work out well (refer to Karstan’s table above)
- If the asset allocation is tilted towards high-yield bonds, then I do not have the data to figure out how it will go.
The asset allocation is important, but when you purchase these products, you think you have to transfer the risk of investment and sustain the fund to the insurance companies or fund manager.
But because they now have an obligation to pay out an income payout, they don’t dare to promise you too much.
Hence the guaranteed payout usually is very low (now that you understand the withdrawal math more, you can understand why their payout is so low! They are using some actuarial math that eventually got to somewhere close to the safe withdrawal math), so as they don’t go too wrong.
For those retirement income funds that promise higher payout, their distribution tends to be volatile which means their distribution is like flexible spending.
At the end of the day, you got to ask yourself: Can your retirement income product deliver this kind of income growth over 30 years for you?
How Does the Safe Withdrawal Rate Compare to Annuities Like CPF LIFE?
If we try to be philosophical about it, we are trying to create an inflation-adjusted income that hedges our longevity risk.
This is what an annuity is trying to do.
With an annuity, the insurance company can pool the clients together and take the payout of those who died earlier to pay those who lived longer. Thus, their payout can be higher.
When we are trying to self-insure through the safe withdrawal rate, we cannot do that, and we have to cover all sorts of different economic regimes.
Thus, the safe withdrawal rate is much lower, and we need more money.
The downside of CPF LIFE is that it is not indexed to some sort of an inflation metric. Thus, if an unlucky retiree chooses to retire during a high inflation period, his or her money may not go a long way.
Recall that recently, our government asked those who are retiring soon to put more money into their CPF SA or Retirement Account. This is to shore up the portfolio size relative to the income.
In a way, we cannot run away from safe withdrawal math.
Safe Withdrawal Rate Versus Monte Carlo Simulation
If the safe withdrawal rate is used as a risk assessment metric to check if your retirement setup is safe, then a possible alternative is to perform a Monte Carlo Simulation.
Monte Carlo Simulation is very popular among retirement software as a risk assessment layer. The adviser or user can put your income requirement and the portfolio value, iterating the portfolio’s expected return over 10,000 times. The software will throw out a percentage success rate.
It will be up to your interpretation of what that success rate means.
Jim Otar cites a few reasons why Monte Carlo Simulation is inferior:
- Monte Carlo treats growth rates as random. Jim argues that actual market returns are more fractal. Fractal means that there is a pattern to it. For market returns, what happens today, relates to what happened before this event. The returns are not exactly random.
- We cannot just say that with a 94% success rate, this is safe enough. Jim uses a car in an open-air parking lot analogy. We can say that it will not rain 94% of the time, but the car becomes wet during that 6% that does rain.
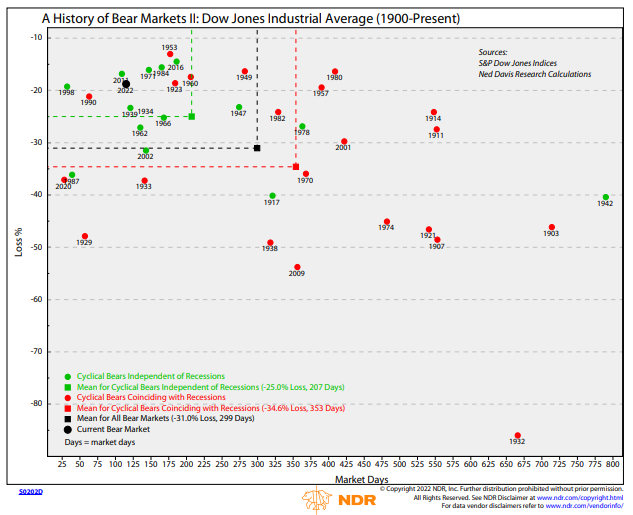
This picture of the history of markets shows that there seems to be a long-run pattern. It may not be exactly random. An overheated market will eventually result in a recession. We do not know when but the markets alternate between a few known economic regimes.
This is something that Monte Carlo will struggle to simulate. Even if they do, what does the data actually mean?
FREE Financial Independence Safe Withdrawal Rate Calculators That Does not Suck
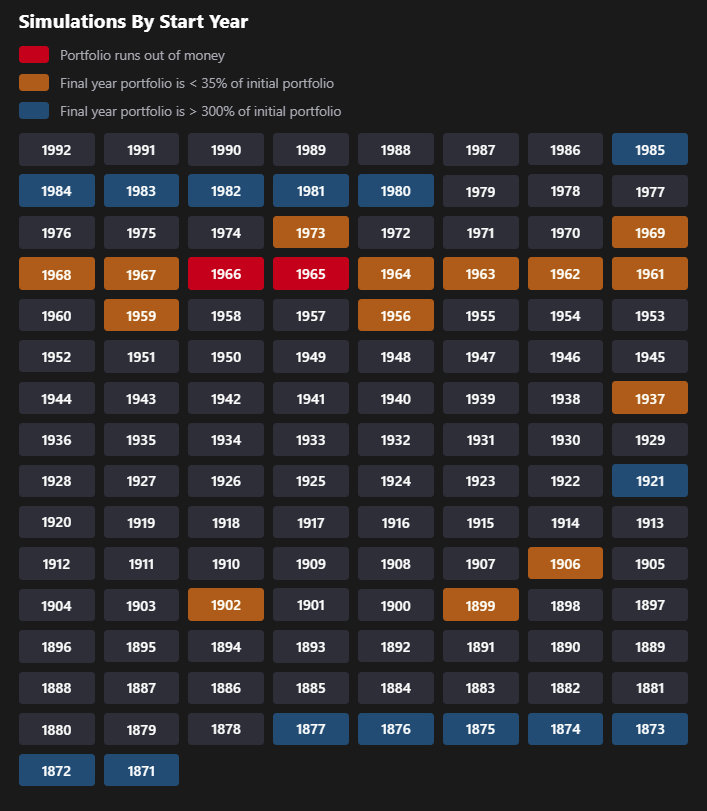
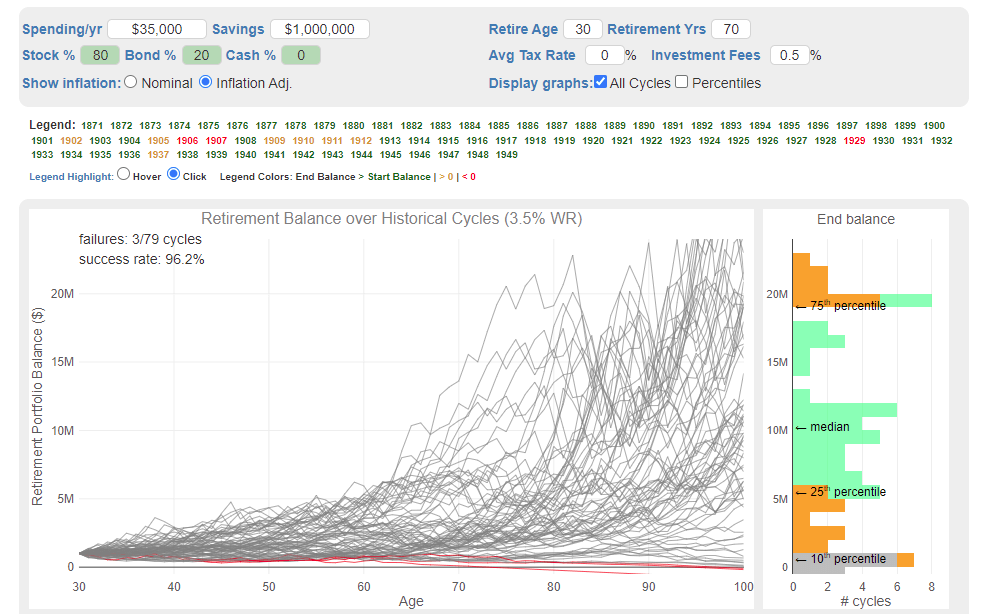
If you want to have fun with the Safe Withdrawal Rate, you can try this FI Calc here.
This calc is free, but not just that; the calculator is rather comprehensive.
- Data from 1871 to today
- Change portfolio allocation
- Add portfolio cost
- Includes flexible spending strategy (Variable percentage withdrawal, Dynamic SWR, Endowment, Guyton Klinger, 95% Rule, CAPE-based rule, Sensible Withdrawal, Hebeler Autopilot II, Vanguard Dynamic Spending)
- Simulate the effect of having extra work income
- Simulate the effect of having CPF LIFE income
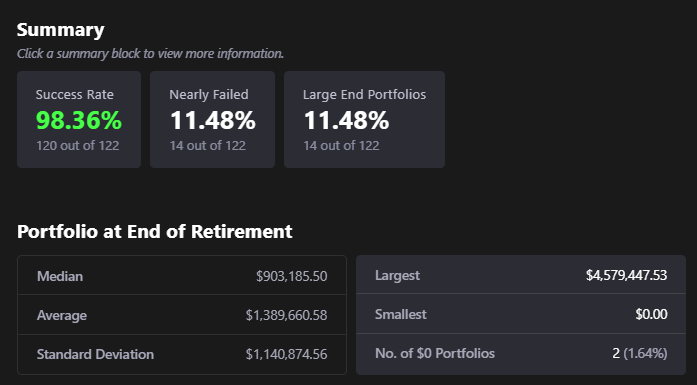
This is a godsend to the community together with Portfolio Visualizer and cFireSim.
On the same 3.5% safe withdrawal rate, but with an expanded data set, we can see the result still sticks.
Another good visualization tool to visually see whether the money last or not is over at Engaging Data.
You will be able to see which sequence you live through and will have a problem given the safe withdrawal rates you have chosen.
How Should You Use the Safe Withdrawal Rate Framework?
The safe withdrawal rate can be used in a different manner. It can also be abused.
Let me share a few uses, but most likely, I will expand upon this in the future.
1. Use as a Rule of Thumb to Gauge Whether Someone Will Have a Comfortable Financial Independence Outcome
The best use for the safe withdrawal rate is to give you a sense of the degree of value we can deliver to someone.
Often, I would ask about a prospect’s income requirement and the number of investable assets, and I would have a good idea if this prospect has a challenging demand or if they will have a good outcome.
A low number would let me know they should have a good outcome. A very high number tells me the prospect better have some more working years as the numbers are challenging.
2. Find out how the Degree of Financial Independence of a Family
To actually retire, you would need a more detailed, sustainable spending plan, but most often, we are not sure where we are in our financial independence journey.
In my article How Much Money do You need to be Financial Independent? A Deep Dive, I provided a table that shows you the degree of your wealth and what kind of retirement lifestyle is available to you:
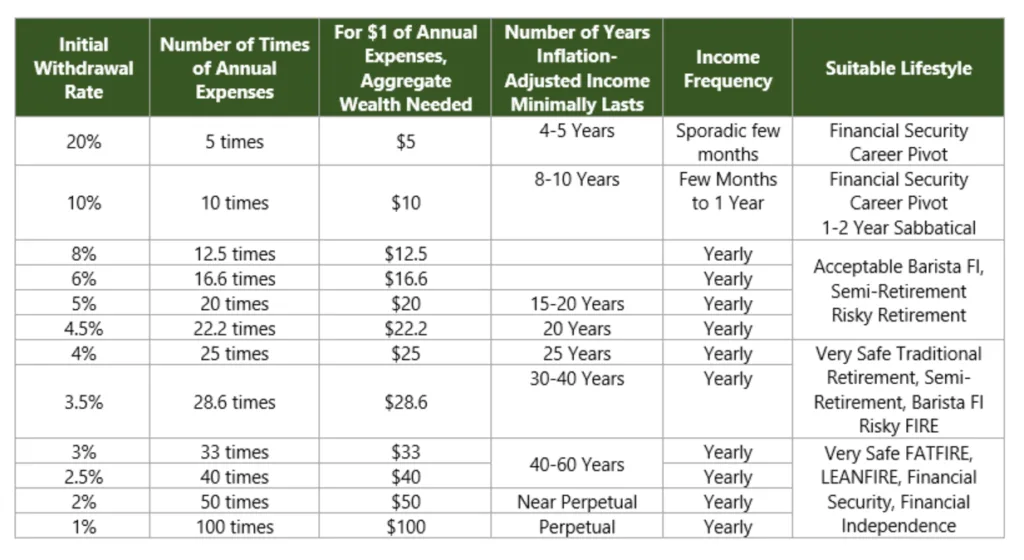
You will arrive at an initial withdrawal rate if you take your income requirement divided by your current portfolio value. If the rate is high, you could make a career pivot with the backing of your funds, but your wealth might not last long.
For some who managed to build up their wealth to an astounding degree, this is one way to let them know how long their wealth will last.
3. Find Out What Your Current Wealth Buys You
Suppose you have accumulated $1 million today.
Instead of finding out how much more you need to accumulate, you could reverse this and ask: What can I get with $1 million?
If you want a stream of income to last 30 years, with a 3.5% withdrawal rate, you know you have $35,000 a year.
How much of your life can you squeeze into $35,000 a year?
If you want a stream of income to last perpetually, you could use 2.5% or 2.7%. That $1 million means you have $25,000 a year. How much of your life can be squeezed into $25,000 a year?
4. Evaluating Tradeoffs in a Unique Way
Okay, so we know roughly that an initial safe withdrawal rate of 3% is more or fewer factors in some rather challenging 60-year worst-case scenarios.
You could use it to derive a unique trade-off from evaluating future purchase decisions.
If you wish to have a long-term inflation-adjusted passive income of $1 a day, that would mean you need ($1 x 365 days) / 0.03 = $12,200. Let us round up to $12,500.
If you earn $60,000 after-tax income before spending, you have 4.8 times $12,500.
If you don’t spend anything, you will have $4.80 a day passive income. That is like securing one meal for 60 years in one year of work.
You will secure your entire day meal for 60 years if you work for three years.
But of course, you cannot save everything. You still got to eat.
To some of you, this opportunity cost may be enough for you to consider carefully where you spend your money seriously.
How to Implement a Low-cost, Passive Portfolio Wealth Machine for Your Financial Independence
Today, we have more resources than ever to create a portfolio and fund the portfolio periodically over time to reach our financial independence. Once we are financially independent, we can cash flow our passive portfolio to get the income for our spending.
I will provide some model portfolios only to give you some direction on how to implement this way of investing, but there is more nuance involved. Generally, it is not a good idea to just implement it because I recommend it.
I do not know your risk tolerance, portfolio preferences and sophistication.
Do-it-yourself Portfolio Ideas
If you are a do-it-yourself (DIY) investor and would like to keep it simple, you could set up a two-fund portfolio with low-cost, global broker Interactive Brokers:
- iShares Core MSCI World UCITS ETF USD (SWDA) – Developed World Equity 60% allocation – 0.20% Expense Ratio
- iShares Core Global Aggregate Bond UCITS ETF Hedged to USD (AGGU) – Investment Grade, Average 7 years Duration, Bonds 40% allocation – 0.10% Expense Ratio
These portfolios have more of a global tilt than the data provided here because I favour an approach with more humility that we do not know what will happen in the future and whether listed companies listed in the USA will continue to be more dominant.
If you prefer to include a small emerging markets allocation, you can add the iShares Core MSCI EM IMI UCITS ETF (EIMI) to the allocation or replace the SWDA with:
- Vanguard FTSE All-World UCITS ETF USD (VWRA) – Developed World + Emerging Markets Equity 60% allocation – 0.22% Expense Ratio
- iShares Core Global Aggregate Bond UCITS ETF Hedged to USD (AGGU) – Investment Grade, Average 7 years Duration, Bonds 40% allocation – 0.10% Expense Ratio
If you want to take a multifactor approach to your portfolio allocation, you can replace SWDA with iShares Edge MSCI World Multifactor UCITS ETF USD (IFSW) – 0.50% Expense Ratio or JPMorgan Global Equity Multi-Factor UCITS ETF USD (JPGL) – 0.20% Expense Ratio.
These exchange-traded funds (ETFs) are domiciled in Ireland, listed on the London Stock Exchange (LSE) and can be assessed through Interactive Brokers, Saxo Bank, Standard Chartered and DBS Vickers.
For global investors, I recommend these ETFs that are Irish or Luxembourg, as opposed to those listed in the USA, due to their estate tax and withholding tax efficiency. I do not know you, and your tax situation may be very different from mine, so it would be best to check with your tax adviser.
Here are some guides:
- Guide to Estate Taxes for Singaporean Investors with Overseas Investment
- Guide to Withholding Taxes for Singaporean Investors
Implementing with Interactive Brokers is cost efficient because:
- There are no ongoing wrap/access/platform/maintenance fee
- Each trade on the LSE will cost 0.05%, and you do not have to pay the UK stamp duty (which may come up in the discussion)
- Conversion from SGD to USD is at a spot rate (as opposed to the 0.20-0.60% one-time conversion amount typically charged by other brokers) and at a one-time USD$2 charge
So your all-in cost can be really low.
Why 60% stock and 40% bond allocation?
This is the typical balanced portfolio, which gives a good balance between capturing equity returns and lower volatility than typical investors can accept better. However, each investor aspiring toward financial independence may have a different risk tolerance at different phases in their journey.
So this is very much a guide. What should be your actual allocation? That is not the purpose of this article, nor am I your financial adviser to advise that.
If you DIY, there is more stuff you need to get round to, so it is not really always as straightforward as what others tell you. I may probably cover more in the future.
Robo-advisers Options
For those who wish for an adviser to give you a well-balanced, low-cost, fundamentally sound portfolio, you can rely on the core/flagship portfolios of some Robo-advisers like Endowus or MoneyOwl.
Both create rather sensible portfolios for most investors.
MoneyOwl’s portfolios are constructed using Dimensional Fund Advisers’ funds, which will make their portfolios multifactor portfolios (you can revisit the multifactor section of this article on that). The moderate, balanced growth and equity portfolios are portfolios of different risk levels to cater to risk tolerance.
The portfolio expense ratio is between 0.25% to 0.27%.
Endowus have more variety to choose from. Their flagship portfolio has different risk levels and is generally good enough for accumulators or retirees of different risk levels.
They use a mixture of Dimensional and LionGlobal index funds in their portfolio, so the portfolio is a blend of index + multifactor.
In terms of portfolio expense ratios, it is quite comparable to MoneyOwl.
If you wish for a pure Dimensional portfolio, Endowus provides that as well.
Now, on top of the provided portfolio fees, there is an ongoing access/advice fee for both platforms.
MoneyOwl charges 0.60% a year and Endowus 0.25% to 0.60% a year (depending on your investment asset-under-management).
You can refer to my past comparison of Robo-advisers’ portfolio performances:
- Comparing the Performance of Some Singapore Robo Advisers (2022 Update 1.7 Years Later)
If you want to try them out, my MoneyOwl referral code is here.
Conclusion
The safe withdrawal rate is just one ratio.
However, that ratio embeds much information if you understand it well. How safe you feel would depend upon your understanding of the research behind the ratio.
It is a bit like the price-earnings ratio. A lot of people can comment on different things about it. However, if you understand the various way to interpret the price-earnings ratio, you can value stocks and the market and plan your income in a sound manner with just that ratio.
The safe withdrawal rate has such a status.
If we look at the safe withdrawal rate more as a framework but less as the final strategy for spending our money, we might be more open about it.
Hopefully, this article answered many of your questions about the safe withdrawal rate.
Are there any queries about the safe withdrawal rates that are not covered yet? You can post your further questions here.
You can also check out my Retirement Planning Section here for more rich financial independence knowledge.
More Resources on the Safe Withdrawal Rates
- The Trinity Study – Three professors trying to replicate Bengen’s work
- Early Retirement Now Safe Withdrawal Rate Series – 53 part (and running) Safe Withdrawal Rate Series
I invested in a diversified portfolio of exchange-traded funds (ETF) and stocks listed in the US, Hong Kong and London.
My preferred broker to trade and custodize my investments is Interactive Brokers. Interactive Brokers allow you to trade in the US, UK, Europe, Singapore, Hong Kong and many other markets. Options as well. There are no minimum monthly charges, very low forex fees for currency exchange, very low commissions for various markets.
To find out more visit Interactive Brokers today.
Join the Investment Moats Telegram channel here. I will share the materials, research, investment data, deals that I come across that enable me to run Investment Moats.


Do Like Me on Facebook. I share some tidbits that are not on the blog post there often. You can also choose to subscribe to my content via the email below.
I break down my resources according to these topics:
- Building Your Wealth Foundation – If you know and apply these simple financial concepts, your long term wealth should be pretty well managed. Find out what they are
- Active Investing – For active stock investors. My deeper thoughts from my stock investing experience
- Learning about REITs – My Free “Course” on REIT Investing for Beginners and Seasoned Investors
- Dividend Stock Tracker – Track all the common 4-10% yielding dividend stocks in SG
- Free Stock Portfolio Tracking Google Sheets that many love
- Retirement Planning, Financial Independence and Spending down money – My deep dive into how much you need to achieve these, and the different ways you can be financially free
- Providend – Where I used to work doing research. Fee-Only Advisory. No Commissions. Financial Independence Advisers and Retirement Specialists. No charge for the first meeting to understand how it works
- Havend – Where I currently work. We wish to deliver commission-based insurance advice in a better way.
Kyith is the Owner and Sole Writer behind Investment Moats. Readers tune in to Investment Moats to learn and build stronger, firmer wealth foundations, how to have a Passive investment strategy, know more about investing in REITs and the nuts and bolts of Active Investing.
Readers also follow Kyith to learn how to plan well for Financial Security and Financial Independence.
Kyith worked as an IT operations engineer from 2004 to 2019. Currently, he works as a Senior Solutions Specialist in Insurance Start-up Havend. All opinions on Investment Moats are his own and does not represent the views of Providend.
You can view Kyith's current portfolio here, which uses his Free Google Stock Portfolio Tracker.
His investment broker of choice is Interactive Brokers, which allows him to invest in securities from different exchanges all over the world, at very low commission rates, without custodian fees, near spot currency rates.
You can read more about Kyith here.
- My Dividend Experience Investing in UCITS iShares iBond Maturing in 2028. - April 23, 2024
- We Invest into Popular Funds When They Are Popular, Exactly When They Started Turning to Shxt. - April 22, 2024
- Meal Prep 2.0 – Cooking Your “Go-to” Meal that You Look Forward to Eating Everyday. - April 21, 2024
Felicia
Sunday 24th of July 2022
Great article as always!
Just a quick question…. Mind sharing why you chose AGGU and not A35/MBH as the bond component?
Felicia
Monday 25th of July 2022
Thanks Kyith for the clarification!
Kyith
Monday 25th of July 2022
Hi Felicia, ABF Bond is safe as well too. In fact it can be better because as a Singaporean, you would be spending in Singapore dollars and owning A35 won't subject you to currency risk.
Thinknotleft
Friday 22nd of July 2022
Great article!
You may be interested in the video -- Comprehensive Overview: The 4% Rule ( https://www.youtube.com/watch?v=umJvMGOu6DY )
Kyith
Saturday 23rd of July 2022
Thanks, this is a good summary!
Revhappy
Thursday 21st of July 2022
I stopped looking at SWR. The job market is so good, we have so much flexibility these days in terms of remote working, flexi working and employers are relatively lenient and allow very good work life balance. This is the best time to go to work. While stock markets are as unpredictable as ever.
If you really have to worry about SWR, it means you dont have enough to retire in peace. If you retire early, you will be very reluctant to put a lot of money into the stock markets. As per ERN, for 50 year retirement you need to be like 80-100% in stocks. But practically, you will not be able to maintain such a high allocation, if you retire early. You will be forever scared whether markets will crash and never come back. It is just not worth it.
Might as well take up a more relaxed job which is suitable for you and continue working as long as possible and keep a very high 75-80% allocation in stocks, knowing fully well that you can work and you dont need the money in your portfolio for 10-20 years.
This is my mantra now :)
Cheers!
Kyith
Saturday 23rd of July 2022
If i am right, its not moving to 100% equities. The volatility drag would make that not very optimal. that is what is shown in some of his asset allocation research.