Unit Trust house T Rowe Price has an interesting research out on retiree spending.
This may be something that those of you who are on the F.I. path will be interested in.
You might always wonder: How much volatility would there be in your spending in retirement the answer I feel is a function of how experienced you are living life, and whether you are quantitative about it.
This study shows us that our spending can be very volatile.
Your spending does not go up by 3% in the first year, then 3% in the second year, then 3% in the third year. Retirees in this study saw spending volatility of 25%, 50% or even 100%.
Much of the increase in spending is not so much due to health cost. I know a few of you would be worried about the health cost as I am.
But the bulk of the spending surprise came from home costs. I chalked that down to the “surprise” cost of having to replace much-needed stuff during a 20-year retirement. Some of the things do break down such as the roof and you cannot delay it but to repair it.
This also presents some relieve because for most of us Singaporeans, we live in a unit-like environment so the large replacement cost may be more controlled.
You may ask: “But Kyith, if you live in a house, shouldn’t you have put in place some money to replace the roof in your retirement?”
For most of us, we don’t because in our planning, we tend to plan the recurring spending that we see on a month-to-month basis.
Many don’t budget or think that it is a too OCD task.
Paying attention to your spending means having a better pulse about what you actually need during F.I.R.E.
And if you are unwilling to do that, then prepare for some surprises.
I often get the question: “Kyith, can I retiree like this?” I think figuring out the known unknowns, or the spending stuff that others who pay real attention know about but are unconscious to you helps a long way.
Given this information, what is T Rowe Price’s recommendation:
I think there is no new stuff but to recognize that if you are living in a Landed Property, don’t be unconscious about how much you need to set aside for the home that you live in!
If there are two of you, perhaps would you like to consider moving to a unit-based home?
Here are some interesting lifts from the study.
About the Health and Retirement Study (HRS) and Consumption and Activities Mail Survey (CAMS).
Both the HRS and CAMS are biennial studies conducted in even and odd years, by the Institute for Social Research at the University of Michigan. The sample used follows a group of 1,306 households from 2005 to 2018 who were present in the 2005 CAMS, were between the age of 65 to 90 years old and have been surveyed at least 3 consecutive years by CAMS.
Some of the Interesting Illustrations from the Study
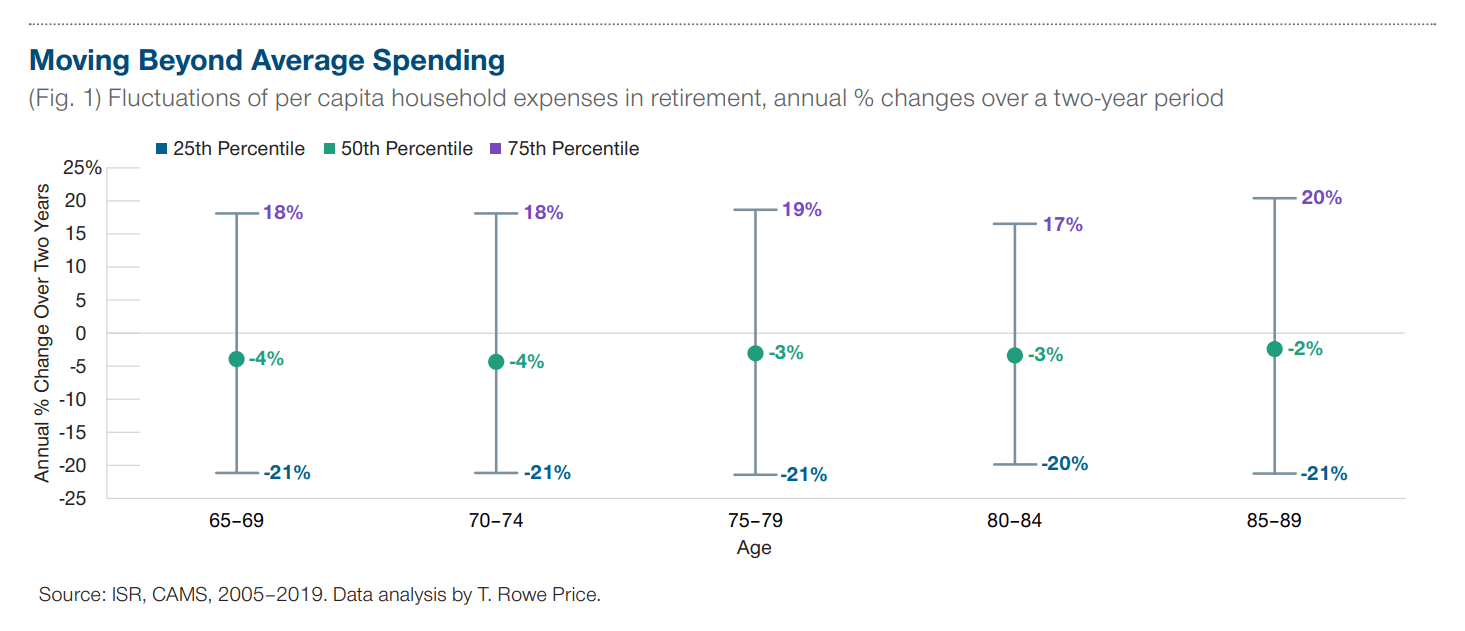
The chart above shows that our spending can fluctuate greatly.
1 in 4 retirees experienced at least a 17%-20% increase in annual spending over two years. 1 in 4 experienced at least a 20% to 21% decrease in annual spending over the same period.
All different age groups experience this volatility in spending.
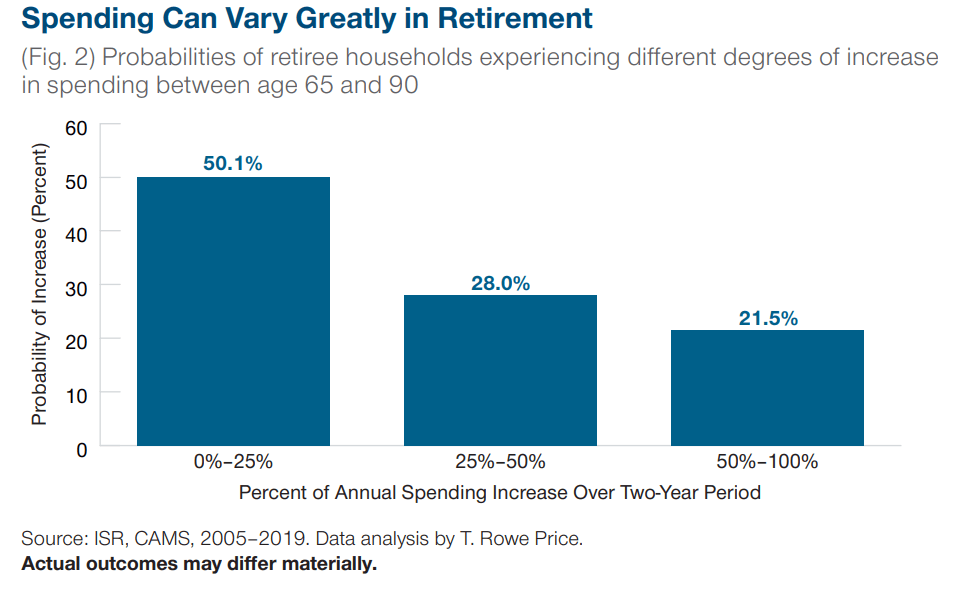
1 in 2 retirees or 50% experienced a spending increase of 0% to 25%. That is a drastic change. Out of 4 retirees, one will experience a 25% to 50% spending increase and out of 5 retirees, one will experience a 50-100% increase.
This means that there are some spending that typically surprises us due to:
- Unaccounted for or poor planning.
- Real life surprises.
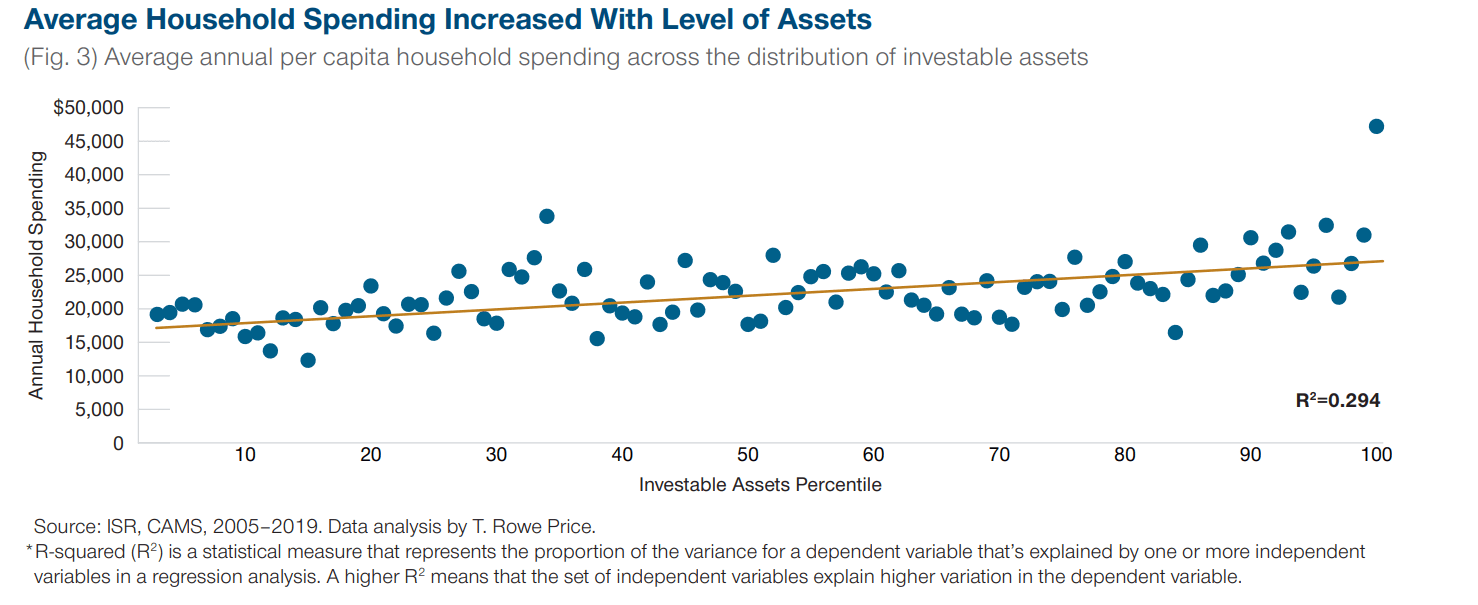
How much you spend does change, depending on how many investable assets you have.
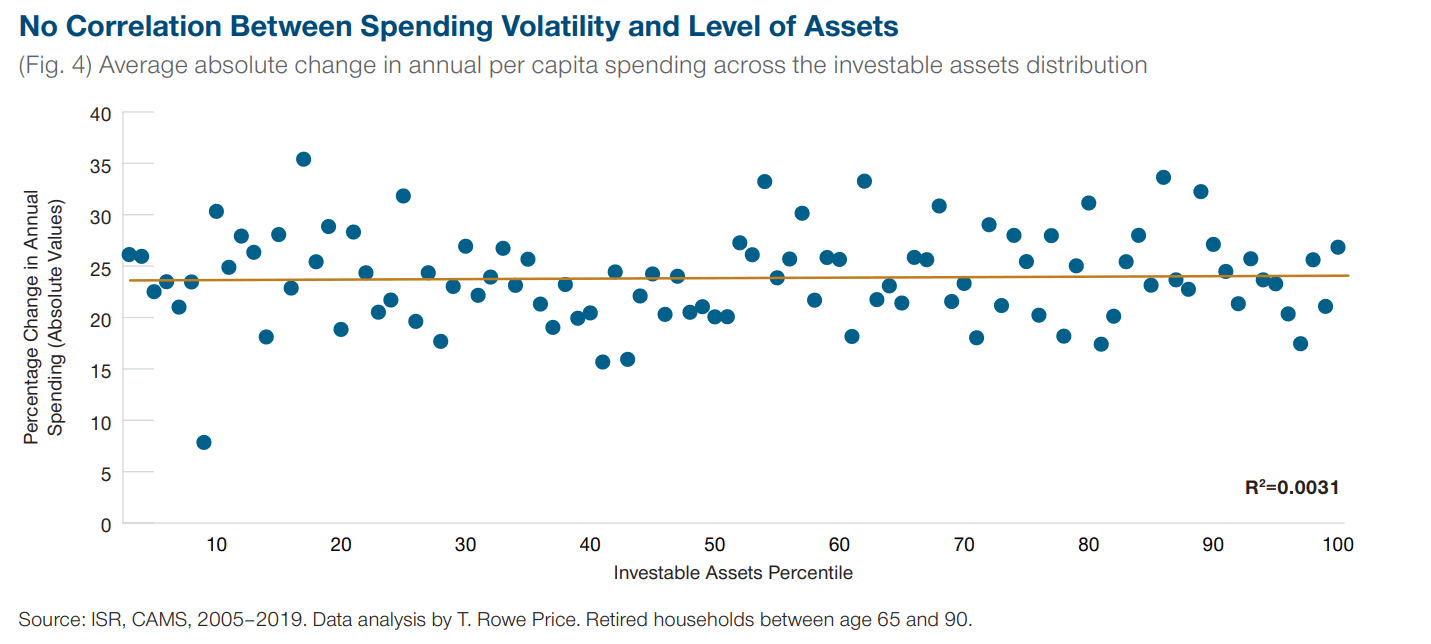
However, if we measure the percentage of change experienced by these retirees, it doesn’t change based on how many investable assets. This means that for those who retire with a lot of not too many assets, you will experience some sort of spending volatility according to this research.
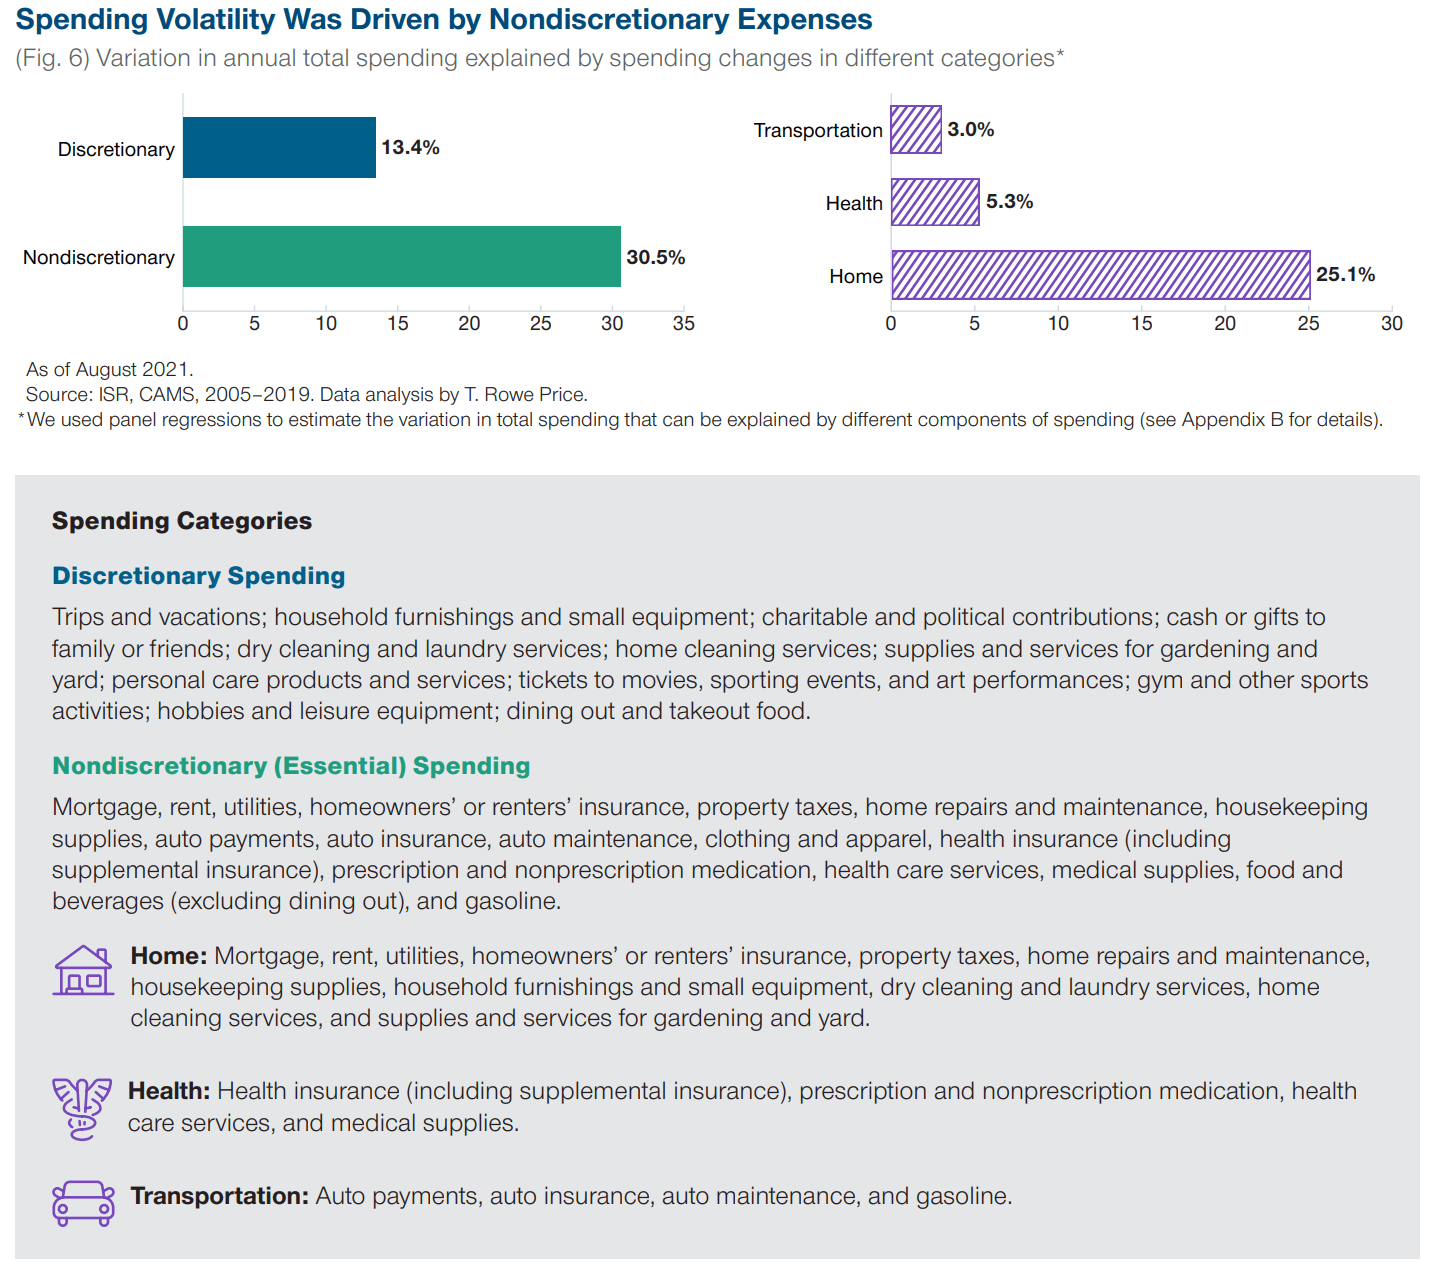
I like this illustration as it provides some definition what are considered discretionary and what are considered nondiscretionary spending.
The two charts show that it is the ESSENTIAL spending that causes most of the volatility and it is NOT HEALTH spending that causes this but what you deal with in the home.
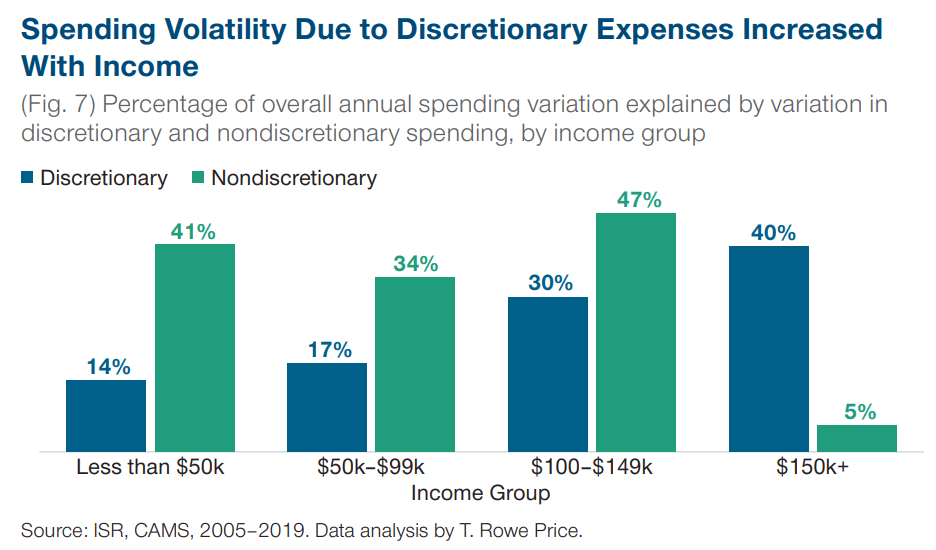
This figure shows that most of the spending volatility is due to essential spending except for the group that is earning $150,000 and above.
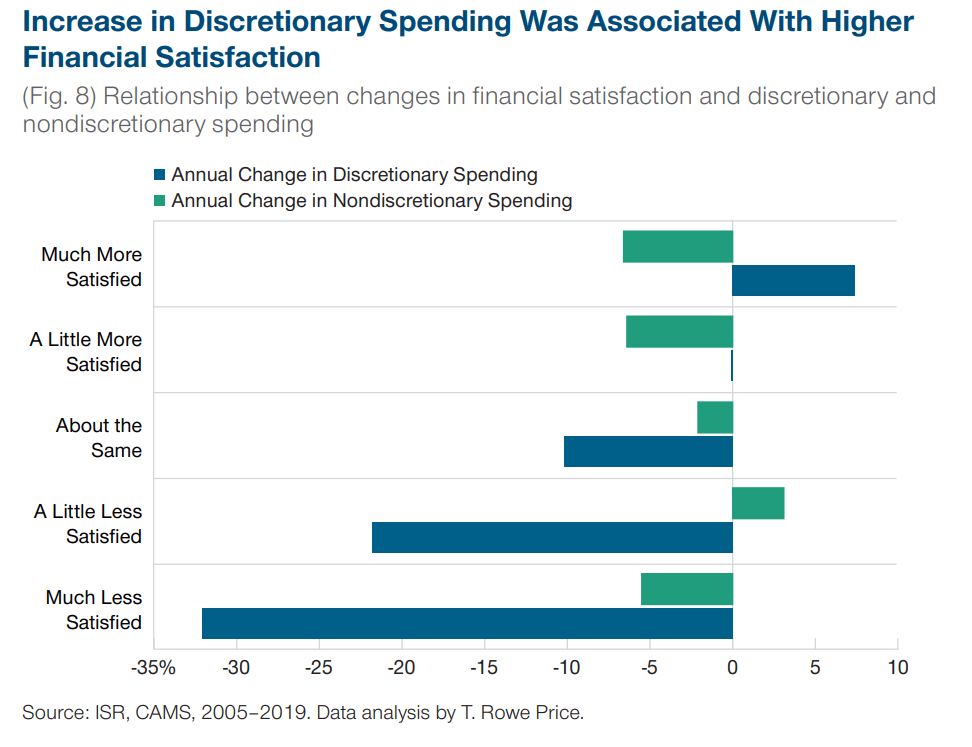
If you have more or less discretionary or essential spending, how would you feel about it?
The results show that the discretionary spending affects people more. There is a larger decrease in satisfaction and more satisfaction if the discretionary spending changes.
This means that even if we have a larger budget for our essential spending, that is only sanitary. We don’t derive more satisfaction knowing that we have more to spend on the essentials. But it is also good to know that if there is a reduction in essential spending the satisfaction level do not drop of dramatically.
Kyith is the Owner and Sole Writer behind Investment Moats. Readers tune in to Investment Moats to learn and build stronger, firmer wealth foundations, how to have a Passive investment strategy, know more about investing in REITs and the nuts and bolts of Active Investing.
Readers also follow Kyith to learn how to plan well for Financial Security and Financial Independence.
Kyith worked as an IT operations engineer from 2004 to 2019. Currently, he works as a Senior Solutions Specialist in Insurance Start-up Havend. All opinions on Investment Moats are his own and does not represent the views of Providend.
You can view Kyith's current portfolio here, which uses his Free Google Stock Portfolio Tracker.
His investment broker of choice is Interactive Brokers, which allows him to invest in securities from different exchanges all over the world, at very low commission rates, without custodian fees, near spot currency rates.
You can read more about Kyith here.
- The Cheapest Way to Extend Your Laptop to TWODisplay that I Can Find. - April 29, 2024
- My Quick Thoughts on the Net Cash, 4% Yielding Boustead. - April 28, 2024
- My Dividend Experience Investing in UCITS iShares iBond Maturing in 2028. - April 23, 2024