I think you should know my answer.
It will depend on your luck.
I think it is easy to be lured into using averages for a lot of our decision-making at work in each of our fields.
But how much do you trust averages in your field of work (not in F.I. income math)?
One of my Telegram group members pointed me to this article, in which the author comments on a Tweet by personal finance guru Dave Ramsey.
You can watch it in this tweet here:
Since then a few good articles were written about this subject but I find that the articles from Portfolio Charts and Of Dollars and Data is worth a read:
This should not be new to Investment Moats readers of my Retirement Planning section.
But I just want to summarize what is the problem of using average returns AND average inflation in your planning and a very unique illustration about what using average returns and inflation missed out.
A Very Common Planning Mistake and Where is the Problem
Dave Ramsey suffers from the same retirement income math that a lot of people or planners may suffer from.
The general idea is:
- If your fund grows at an average compounded rate of 12% a year.
- And the average inflation is 4% a year.
- You should be able to spend the difference, which is 8% a year.
This should be pretty safe in their mind.
Dave Ramsey cannot understand why someone in his team had to put out “garbage” that tells people to spend 3-4%.
It just doesn’t make sense to him.
The reason he uses 12% is because he says the “good” unit trust earns an average of 12% a year, better than the S&P 500 return of 11.8% a year.
This is what I call a very linear kind of planning.
In some cases, we can also say that if my portfolio of REITs currently yields 5% a year, and it has grown 2% a year in capital appreciation, and Singapore’s inflation averages 2% a year, then I should be able to spend 5% yearly.
The main problem is that all these investments that we are talking about, be it the S&P 500 equities, REITs and even bond returns, are not like your savings interest that are linear. Even our savings interest is not linear! It changes so often.
And because of that, there is this problem called the negative sequence of return risk. The sequence of your returns, and the sequence of the inflation matters.
This is something harder to flesh out with average figures.
Your portfolio may earn better than the average, but you might still run out of money pre-maturely during your retirement.
You can Earn Higher Than 8% Real Return and Still Run Out of Money
Perhaps the best illustration was produced by Nick Maggiulli at Of Dollars and Data:
Okay, let me try to explain what you guys are seeing.
The AIVSX happens to be a unit trust that Dave Ramsey has used for the longest time. This fund has existed since 1935 till today and averages 11.7% a year compared to the S&P 500 of about 10.94% a year.
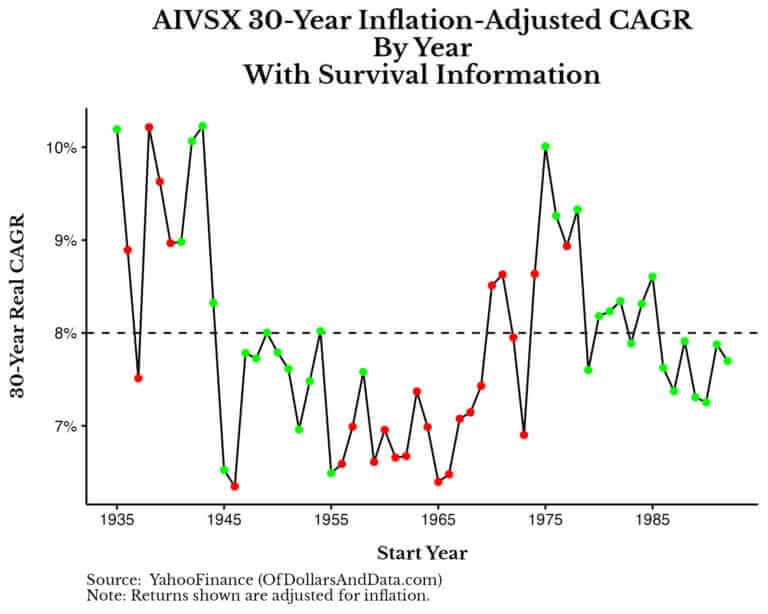
Nick plotted the rolling 30-year compounded average growth (30-Year CAGR) minus the inflation that experience during those thirty-year periods.
So this return is an inflation-adjusted return.
We can see the 30-year real return spans between 6% to 10% return.
Nick puts out a line where the return averages 8% so if this is a real return, you should be able to spend 8% and don’t run out of money isn’t it?
The green dots show the historical simulation that survived for 30 years with an 8% withdrawal rate.
The red dots show the historical simulation that DID not survive for 30 years with an 8% withdrawal rate.
There are a lot of red dots below that 8% line, but there are also a lot of green dots below, which implies that long-term real returns of AIVSX is not correlated with whether the 8% withdrawal rate will bankrupt the portfolio after 30 years.
In simple terms: It is not that if you return lower than 8%, you will run out of money!
I have said dunno how many times, in income math, it is not always about the returns!
But more so…. notice that there are red dots above that 8% line.
What this means is that there are cases where you have great returns but still run out of money.
The red dots typically fall into two groups:
- The very bad deflation of the 1920s and 1930s.
- The very high inflation fo the 1960s and 1970s.
So if you want to zoom in and test if your retirement solution is very robust, you can see if they survive those two kind of periods.
Last Word
This way of income planning is planning with the hope that you will be lucky enough.
Hoping that your returns and inflation belong to the half that is above average.
And there will be people checking with me: “Kyith, I invest in XXXX, do you think the returns can really hit Y% a year? I had in mind that if the returns are like Y%, I can spend Z% safely. What do you think?”
And here you have the answer.
I think that you are asking me to tell you if you will be lucky. I could tell you XXXX traditionally averages Y% a year.
But would that help?
What if you end up living through Y%-3% a year?
Would your plan still work? You do know I don’t control the market or that group of stocks right?
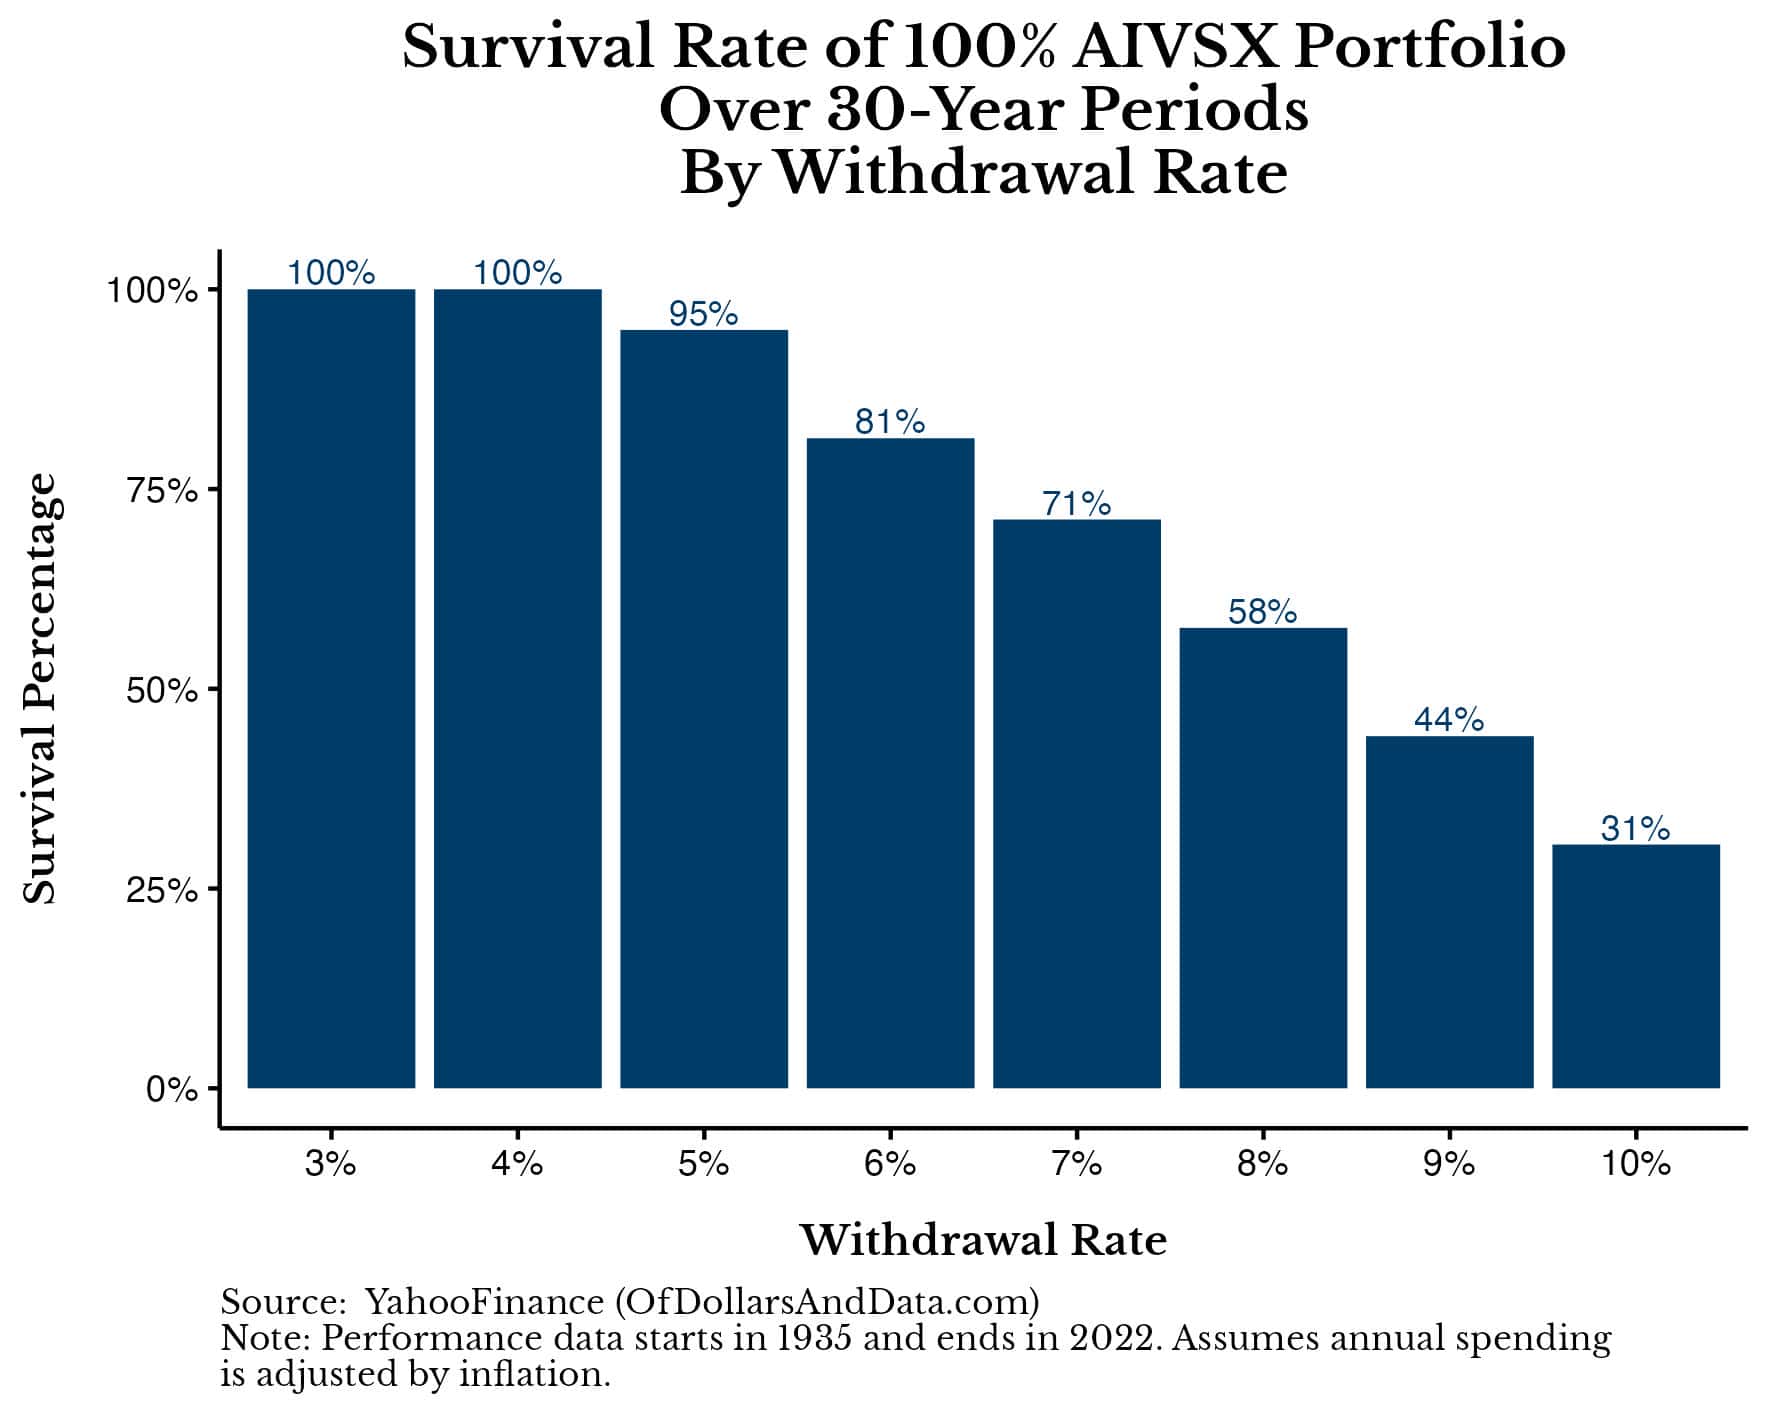
I thought this illustration is also quite a good summary:
If you want to trade these stocks I mentioned, you can open an account with Interactive Brokers. Interactive Brokers is the leading low-cost and efficient broker I use and trust to invest & trade my holdings in Singapore, the United States, London Stock Exchange and Hong Kong Stock Exchange. They allow you to trade stocks, ETFs, options, futures, forex, bonds and funds worldwide from a single integrated account.
You can read more about my thoughts about Interactive Brokers in this Interactive Brokers Deep Dive Series, starting with how to create & fund your Interactive Brokers account easily.
Kyith is the Owner and Sole Writer behind Investment Moats. Readers tune in to Investment Moats to learn and build stronger, firmer wealth foundations, how to have a Passive investment strategy, know more about investing in REITs and the nuts and bolts of Active Investing.
Readers also follow Kyith to learn how to plan well for Financial Security and Financial Independence.
Kyith worked as an IT operations engineer from 2004 to 2019. Currently, he works as a Senior Solutions Specialist in Insurance Start-up Havend. All opinions on Investment Moats are his own and does not represent the views of Providend.
You can view Kyith's current portfolio here, which uses his Free Google Stock Portfolio Tracker.
His investment broker of choice is Interactive Brokers, which allows him to invest in securities from different exchanges all over the world, at very low commission rates, without custodian fees, near spot currency rates.
You can read more about Kyith here.
- The Cheapest Way to Extend Your Laptop to TWODisplay that I Can Find. - April 29, 2024
- My Quick Thoughts on the Net Cash, 4% Yielding Boustead. - April 28, 2024
- My Dividend Experience Investing in UCITS iShares iBond Maturing in 2028. - April 23, 2024
lim
Saturday 18th of November 2023
I feel that stress testing your portfolio before FIRE and ensuring a margin of safety can cater for this. i.e. analyse your expenses vs investment income/gains every year.
(1) COVID - my annual dividends dropped by 20% but next year more than fully recovered. So if I want to play very safe, I can have 20% margin of safety on my passive income to cater for such events. Passive income +20% = current standard of living.
(2) Hypothetically, for normal years, when I have passive income that is 20% more than current standard of living. I should save this money for 'bad years'. As there are on average more good years than bad years since the long term trend is up, the buffer you have built up will be more than enough.
(3) Inflation is 'bad', but not as bad as it seems - as the inflation rate is an average of many items that might not apply to a person who has FIREd. For example, extreme housing inflation won't bother someone with a fully paid up residence (and if your FIRE plan is to own a rental property, that is even better for you).
(4) Dividends can grow. Even though ASSI /AK is allegedly unemployed, his annual dividend is growing. So organic dividend growth is possible with the right stocks.
Nothing of course, is certain, but in the end that is where the 'size' of the margin of safety comes in.
Kyith
Saturday 2nd of December 2023
Hi Lim so sorry for the late response. Here are my thoughts. 1) what you are sharing is a 20% margin of safety. This is what the safe withdrawal rate is trying to account for, which other strategy need to account for. Basically it is saying you need a quantitative margin of safety. You are using COVID because it is extreme enough in your opinion but when you think around this, ask yourself if you would have considered this margin of safety and to this degree if COVID is not around. You may not or you would, but not to this degree. Perhaps you are lucky to have COVID as a gauge. I hope people acknowledge the vulnerability of not knowing the degree of extremes. With that if the extreme is only 20%, then planning with a 25% dividend income and capital buffer is right. but what if this is not the extreme that unsettles things? 2) I think this is based on hope but quantitatively this is right. but you do have to be aware that your spending might also trend upwards due to inflation. 3) What you are talking about is the fact that we have an official country inflation rate and a personal one. That is fair. But Lim, what if what i am trying to secure the income is for just my parent's food for example and nothing else? how would you think round it? the inflation rate is higher no doubt so but also because it may not be something so flexible to change. in that case would the plan work?