Last week on my Moat Market Intel, I shared a table of the stock market performance during different periods after a major geopolitical event:

You would notice that the markets generally recovered within 6 to 12 months after the event. The main exception was during those periods where the events occurred during recessions.
After those events, it generally takes a longer period before the market recovers.
Corrections are challenging to live through but if the recovery is rapid, most of us can live with it. If I lock you up for 1 hour in the toilet you might feel rotten but you would probably be able to take it but what if I lock you up for 8 hours?
I think the moment you get out you will come after me with a kitchen knife.
Are we showing recessionary signs?
One of the reasons for the negative mood yesterday was probably related to the more recessionary talk.
In my short energy article, I explained a little why oil surges usually preceded recessions. The best cure for lack of oil supply is to kill the demand and a recession would try to do that (strangely in a Blockworks video I watched an hour ago, the guests said that even if a recession occurs, there may still be shortages!)
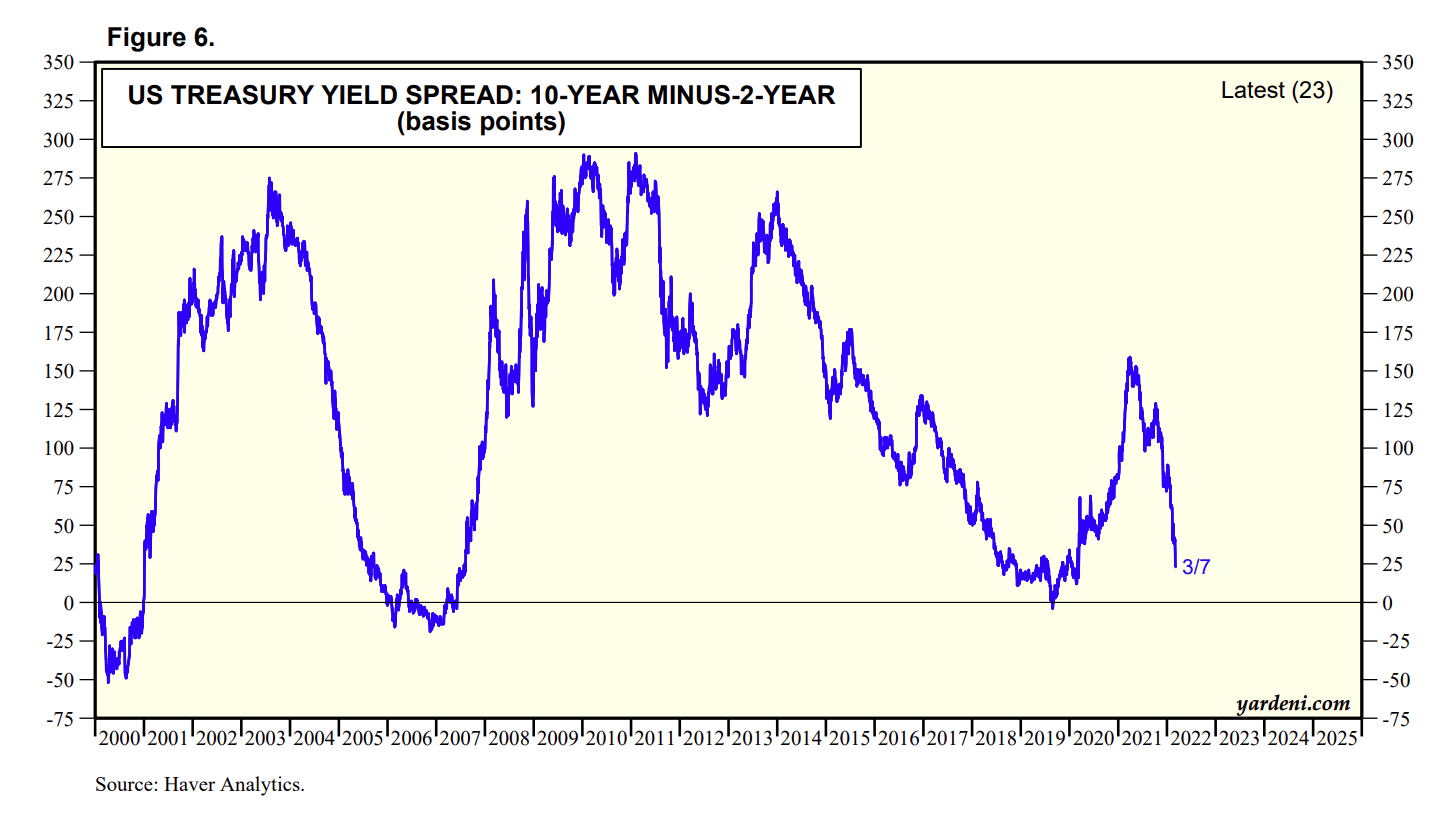
The 10-year minus 2-year Treasury yield spread is almost approaching 0. An inversion of the yield curve usually precedes a recession. But it does not mean the market goes down immediately (although 2000 bear a lot of resemblance to today). Usually, it is hard to determine when the curve inverts and when the market goes down.
Recently, I managed to catch veteran technical analyst Larry William’s Will there be a bear market? on YouTube. This video was published in mid-February one month ago and I think since then, there might be many changes.
But Larry did bring up a few good data points to help us identify signs of a recession early.
Larry said that on average it takes 5 months after the yield curve inversion before equities peak.
Also:
Major bear markets take place in recessions only. Selloffs outside economic recessions almost never accounted for more than -20% losses and recover swiftly.
Here are the odds of correction and bear market:
Of the 33 corrections from 1971 to 2021, 7 became a bear while 26 went to all-time highs. There is a one in five chance to turn into a bear. The average correction took 85 days with the median taking 63 days. Typical bull market corrections pull back 11%. However, the bear market corrections took 473 days to recover on average and the typical loss is 35%.

The conference board leading economic index shows that prior to every recession, the indicator does start dropping. While Larry’s chart does not show any drop-off, this February 2022 chart does.

The unemployment rate usually picks up during recessions.
Currently, we are not seeing any signs.

The St Louis FED also publish a recession probability indicator. Currently, it did not show that a recession is coming.
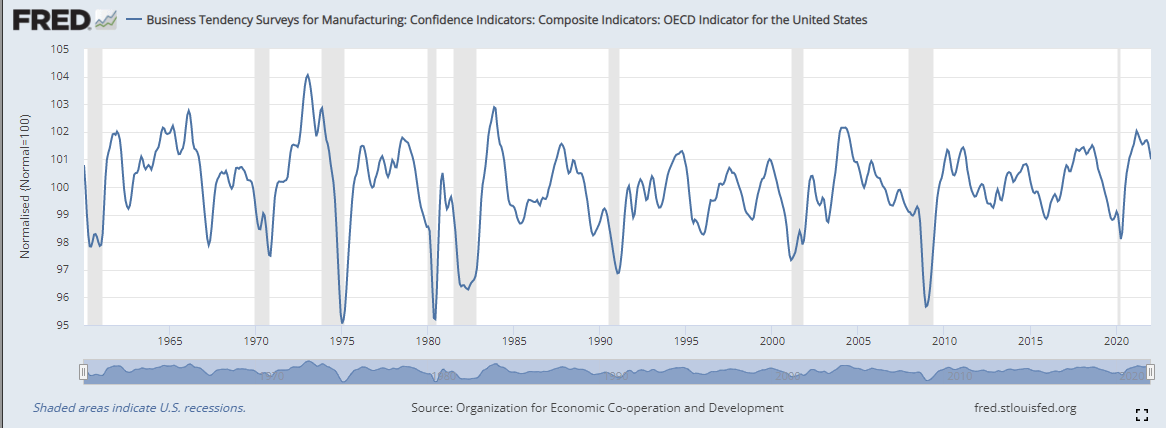
Business confidence is still rather higher at this point which does suggest that we may not be closer to a recession as well. (Grey area indicate recession)

Larry Williams has his own indicator where he gauges the smart money interest in the markets. Based on his reading during the February presentation, smart money is buying more than selling. Personally, I think it only indicates that we lean closer to a region the smart money may be buying and this should be use more for a longer term fundamental indicator than something that help us sense momentum.

My understanding of Larry William’s valuation index is a ratio of stocks to gold. Gold is an asset class that tends to do well during crisis and this is one indicator, together with wood to gold, that gives us an indicator of the general health of the market. These ratios can be used both as a momentum indicator or price-value indicator and in this case Larry is using it more like a price-value indicator. Given how much gold has shot up relative to stocks have gone down, the indicator do show that stocks are relative value compared to gold.
Larry Williams most likely trust these indicators more to give him a sense about recession probability and this may be an area that can be quite up to debate. Different people trust different metrics to tell them the recession probability.
Why is this important at this point?
If you are an accumulator and have an amount of capital to deploy, if this is a more drawn out correction, you might want to control the pace you put the money into work. This is aside from fundamentally whether the market has gotten to a level whether it is cheaper.
I would like to think that this is also useful for those who are planning their flexible spending budget in retirement. If this is a temporary correction, then you might not need to adjust your budget so much but if you know a full blown recession may be coming your way, you might want to adjust the amount you withdraw from the flexible pool of spending or to withdraw from the bond portion of the portfolio.
I invested in a diversified portfolio of exchange-traded funds (ETF) and stocks listed in the US, Hong Kong and London.
My preferred broker to trade and custodize my investments is Interactive Brokers. Interactive Brokers allow you to trade in the US, UK, Europe, Singapore, Hong Kong and many other markets. Options as well. There are no minimum monthly charges, very low forex fees for currency exchange, very low commissions for various markets.
To find out more visit Interactive Brokers today.
Join the Investment Moats Telegram channel here. I will share the materials, research, investment data, deals that I come across that enable me to run Investment Moats.


Do Like Me on Facebook. I share some tidbits that are not on the blog post there often. You can also choose to subscribe to my content via the email below.
I break down my resources according to these topics:
- Building Your Wealth Foundation – If you know and apply these simple financial concepts, your long term wealth should be pretty well managed. Find out what they are
- Active Investing – For active stock investors. My deeper thoughts from my stock investing experience
- Learning about REITs – My Free “Course” on REIT Investing for Beginners and Seasoned Investors
- Dividend Stock Tracker – Track all the common 4-10% yielding dividend stocks in SG
- Free Stock Portfolio Tracking Google Sheets that many love
- Retirement Planning, Financial Independence and Spending down money – My deep dive into how much you need to achieve these, and the different ways you can be financially free
- Providend – Where I used to work doing research. Fee-Only Advisory. No Commissions. Financial Independence Advisers and Retirement Specialists. No charge for the first meeting to understand how it works
- Havend – Where I currently work. We wish to deliver commission-based insurance advice in a better way.
Kyith is the Owner and Sole Writer behind Investment Moats. Readers tune in to Investment Moats to learn and build stronger, firmer wealth foundations, how to have a Passive investment strategy, know more about investing in REITs and the nuts and bolts of Active Investing.
Readers also follow Kyith to learn how to plan well for Financial Security and Financial Independence.
Kyith worked as an IT operations engineer from 2004 to 2019. Currently, he works as a Senior Solutions Specialist in Insurance Start-up Havend. All opinions on Investment Moats are his own and does not represent the views of Providend.
You can view Kyith's current portfolio here, which uses his Free Google Stock Portfolio Tracker.
His investment broker of choice is Interactive Brokers, which allows him to invest in securities from different exchanges all over the world, at very low commission rates, without custodian fees, near spot currency rates.
You can read more about Kyith here.
Revhappy
Wednesday 9th of March 2022
Hi Kyith,
I was looking at your portfolio, you currently have about 25% in cash. Are you planning to deploy this into the markets to? So no bond component for your portfolio?
Would like to know about your thoughts about the 60/40 portfolio and the efficient frontier. Peter Bernstein wrote this classic article which is always referenced when the 60/40 debate comes up.
https://www.safalniveshak.com/wp-content/uploads/2020/05/6040-Solution.pdf