This feels like the most depressing “bear” market since March 2020 maybe because the COVID drawdown was a fast 2 month affair and this grind is longer than that.
But if you are mainly not invested in international market, you would feel differently. If you are invested in China tech companies, you would feel this grind is even longer. After your China tech stocks took a beating, now it is your other international stocks turn.
My portfolio is not immune from this drawdown, taking a near 6 figure beating at this point.
Here are some of the notable data charts that caught my attention.
S&P 500 During Geopolitical Events

We have seen a data chart from LPL financial showing how long it takes to recover from geopolitic events. This chart from Deutsche is something similar but it shows more datapoints. The chart include size of the selloff, how long are the selloff and the performance since the bottom.
The data chart particularly highlights the periods where the events fall within recessions and those who do not. In a separate video by Larry Williams, he also pointed out something similar: It matters if these events happen in a recession or not. If it is not during recession these corrections are much more livable.
A Few Stocks Holding Up the Entire Market?
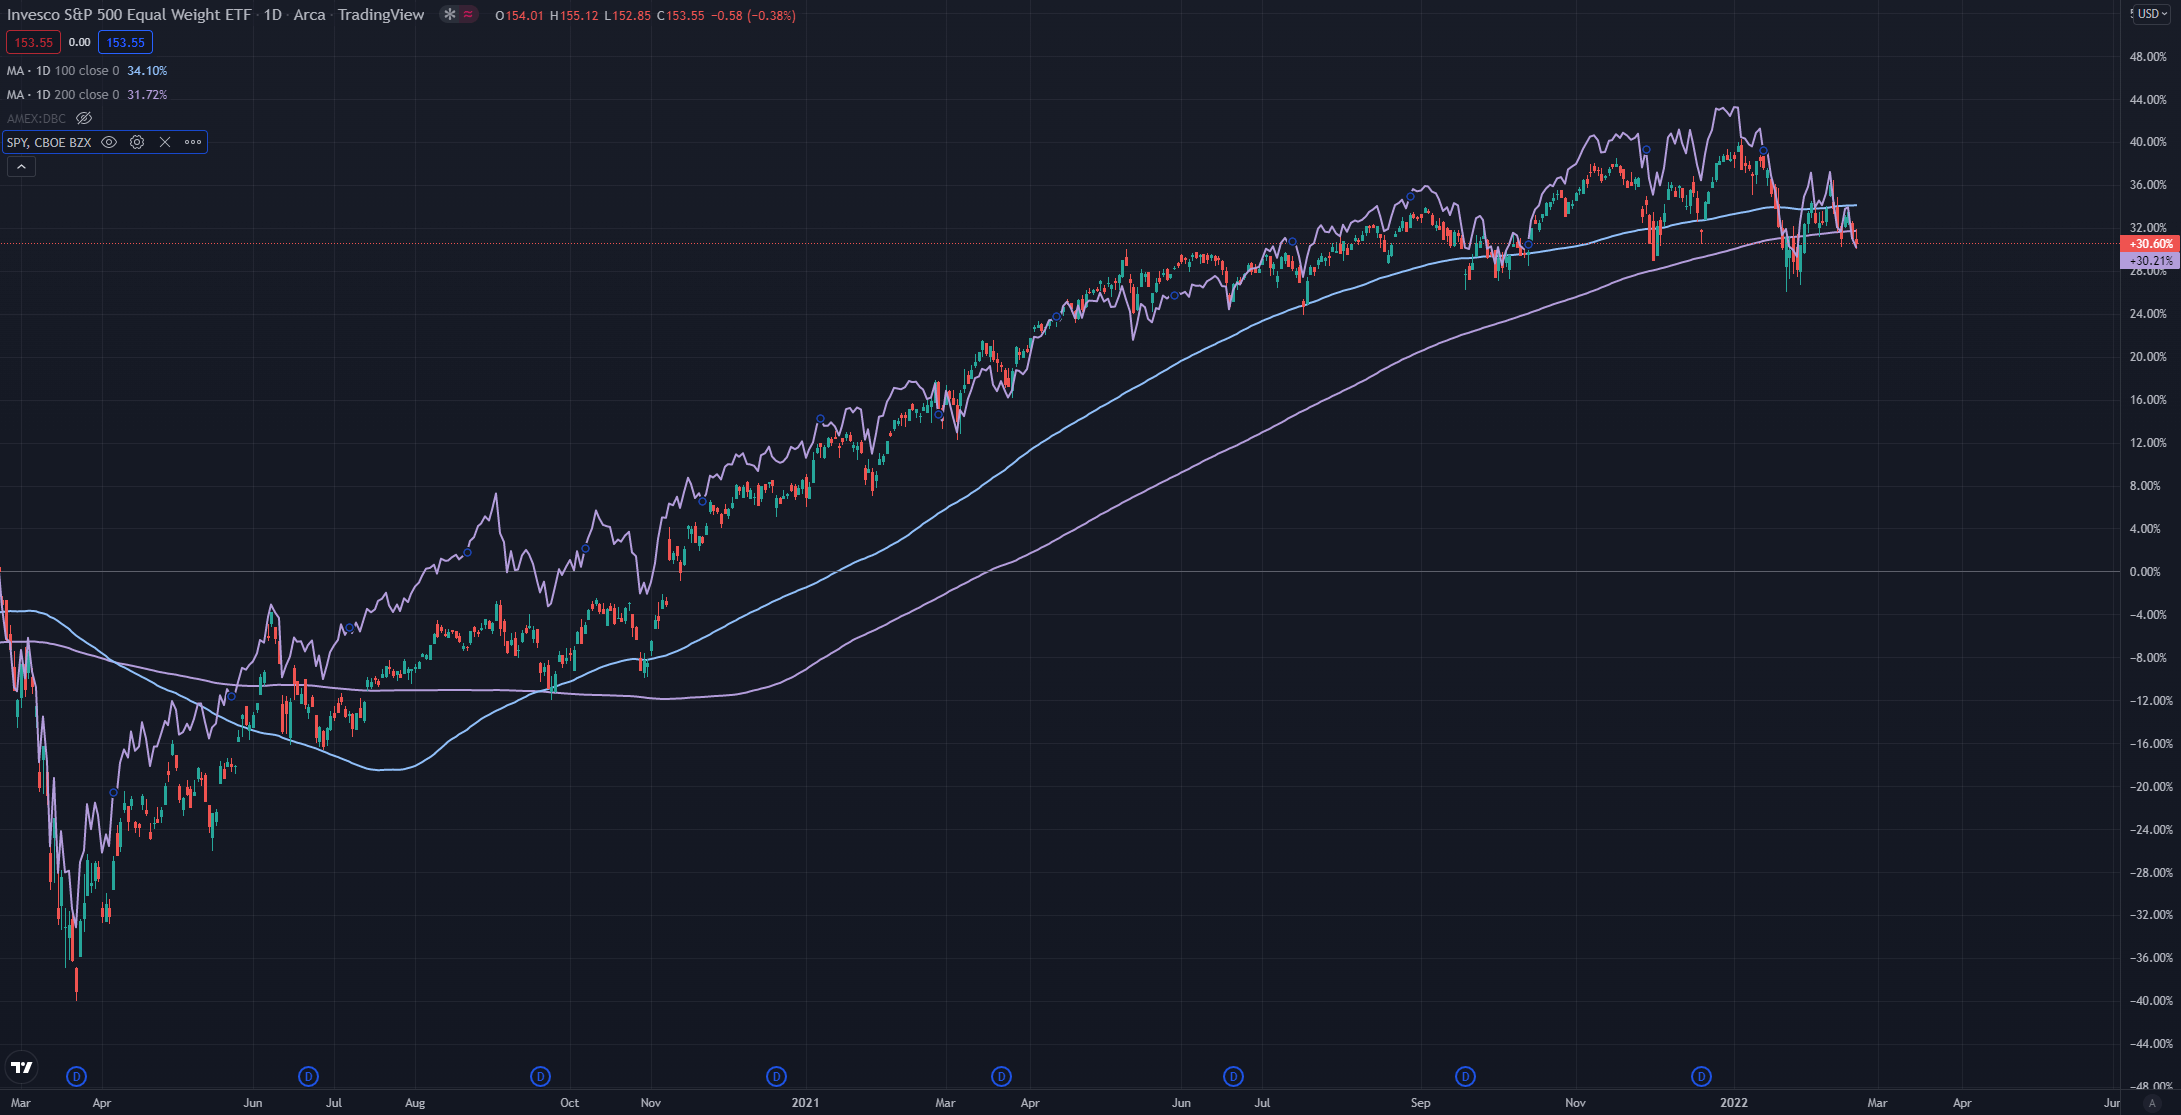
One fo the big disconnect about this period is that you would have a couple of individual stocks that were taken down 20% which puts them in index bear market territory yet the S&P 500 is barely down 10%.
Many believe that a few FAANGM stocks are holding up the market but I think it is more than that.
The chart above shows the Equal Weight S&P 500 ETF versus the traditional capitalization weighted S&P 500 ETF (purple line).
We can see that the equal weight ETF held up pretty well compared to the cap weighted one. If the other companies were not doing so well, relative to the S&P 500, the equal weighted S&P 500 would look worse.
Worst 2-Month Nasdaq 100 Performance Since 2008
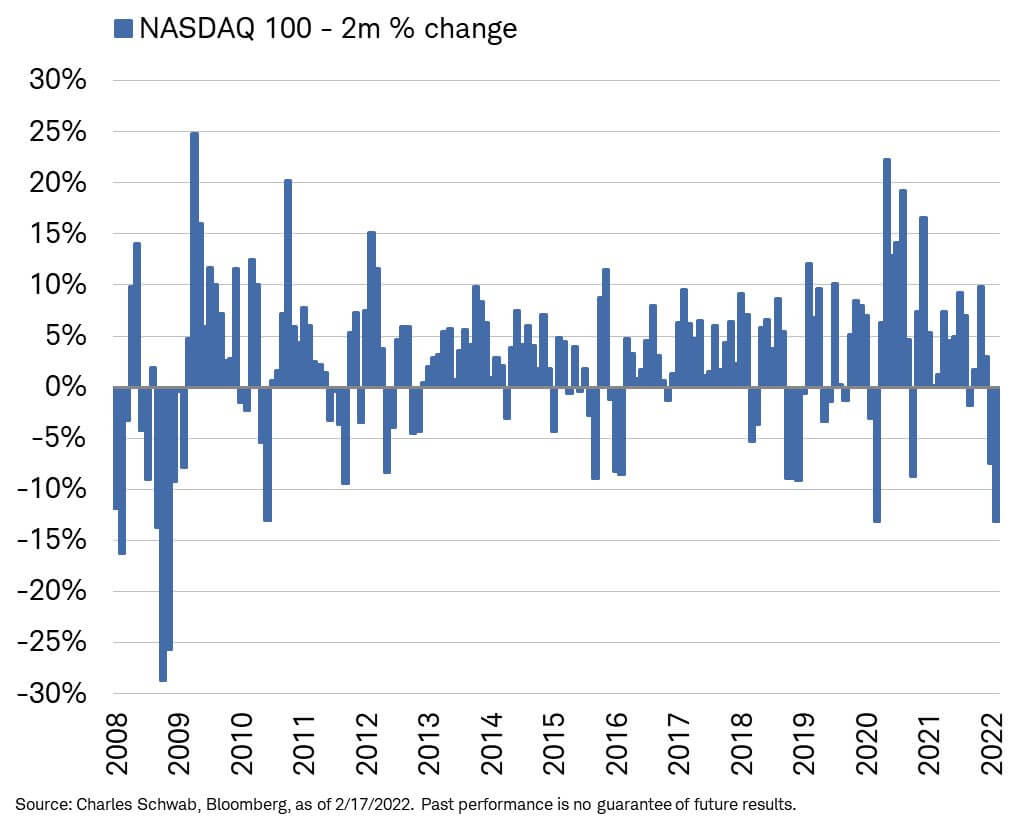
Nasdaq 100 have the worst rolling two month performance since 2008. This shows how remarkable the Nasdaq 100 have been.
I think if we extend the data for 10 more years, we will see more shitty 2 month rolling returns.
Bear Market Level Bullish Sentiment Levels

Based on the AAII survey, that was started in 1987, this currently sentiment is so low that the last few times it was this low was after the 1987 crash, 1994 bear, 1997, 2008 low and 2016.
The Market Has Bear Market Liquidity Levels

This equity market liquidity measures the depth and resilience dimensions of “liquidity” to gauge the price impact of flows. This shows the equity market liquidity seems to have collapsed.
The buying seems to have disappeared which is kind of a scary situation.
ETFs Are Incorporating More Options

Speaking of which, we talked about how the options market seems to be the tail wagging the dog in the past. This illustration shows how many options are used in the top 25 US-listed ETFs.
If more options are traded, the actions of the option market makers matter more in shaping the distribution of returns and volatility in the market creating a leptokurtic market like the black line below:
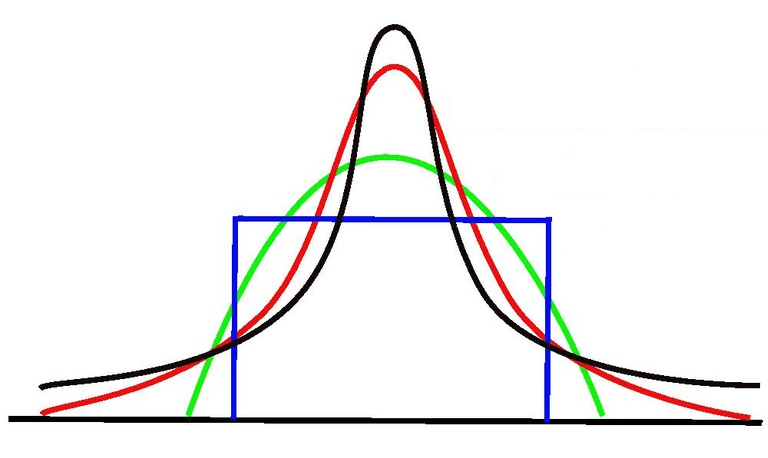
For most part the returns are very narrow in its range of returns, but if the forces are unbalanced, you get very fat good returns and very fat bad returns.

More and more funds are incorporating options in their strategy, perhaps to protect tail risk or to write put or call for income.
Lowest Allocation to Tech Since Aug 2006
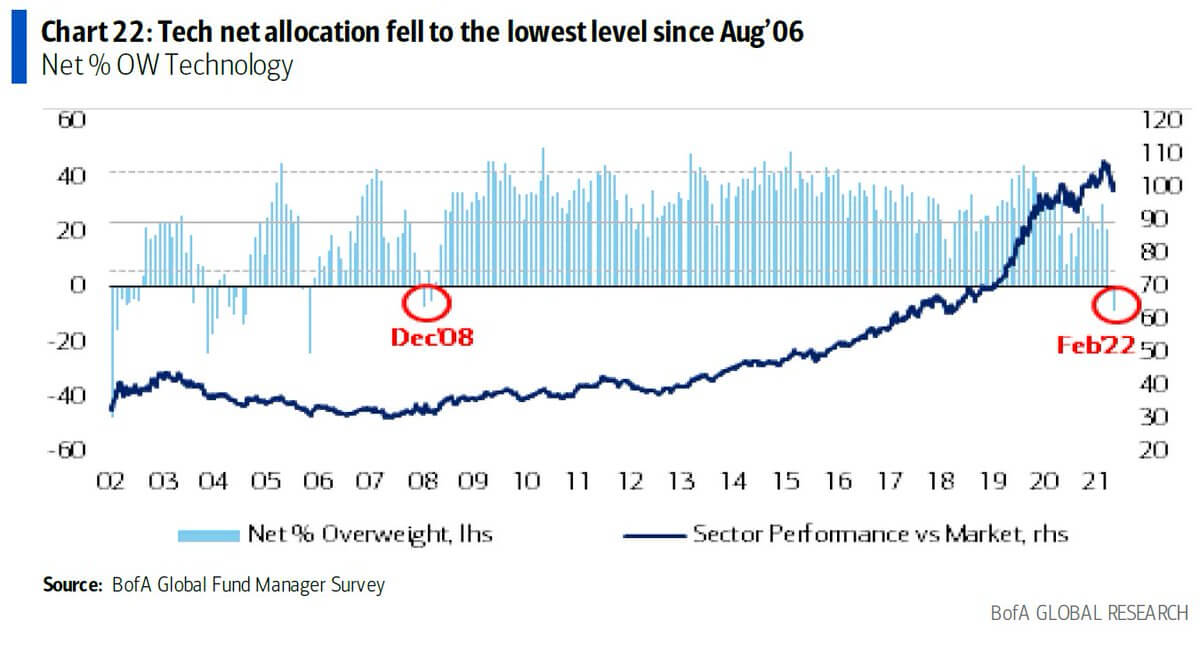
This chart is kind of fascinating. This is the first time since Dec 2008 that the net allocation to tech fell to such a low level.
Relative Valuation of Energy and Metals Companies

This chart shows how cheap or expensive energy and metal companies are versus the S&P 500.
Possible Contrarian Indicator
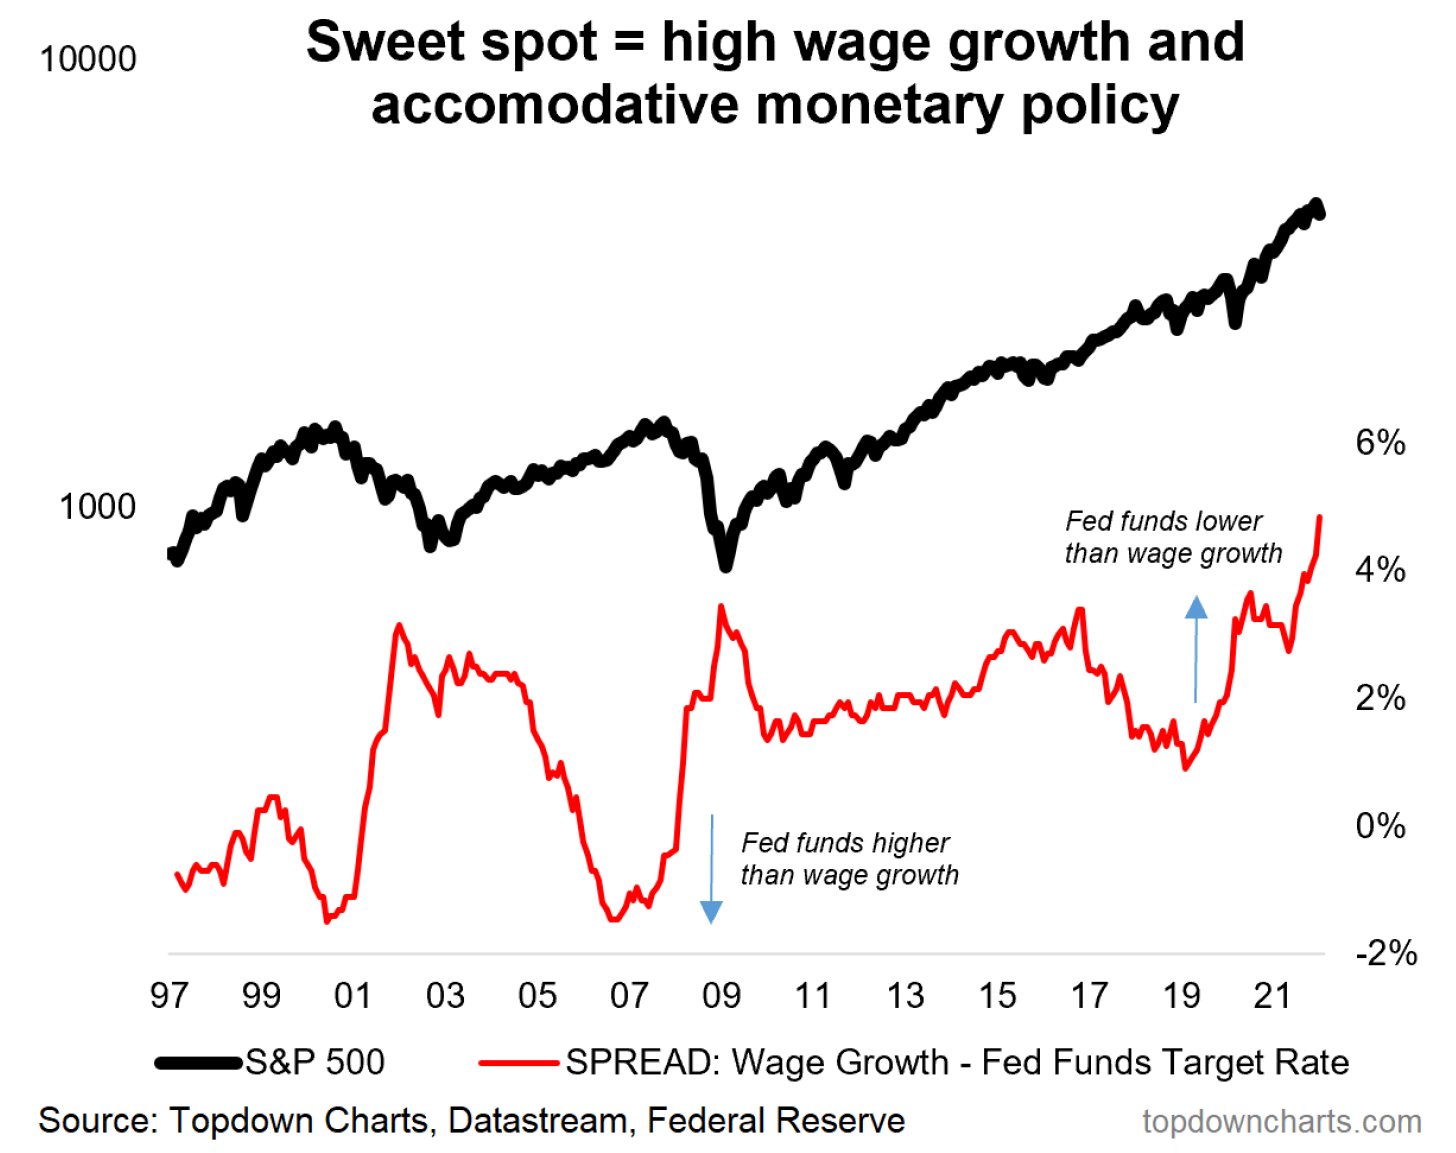
Wage Growth is greater than Interest rates == Upside?
Possible Contrarian Indicator 2
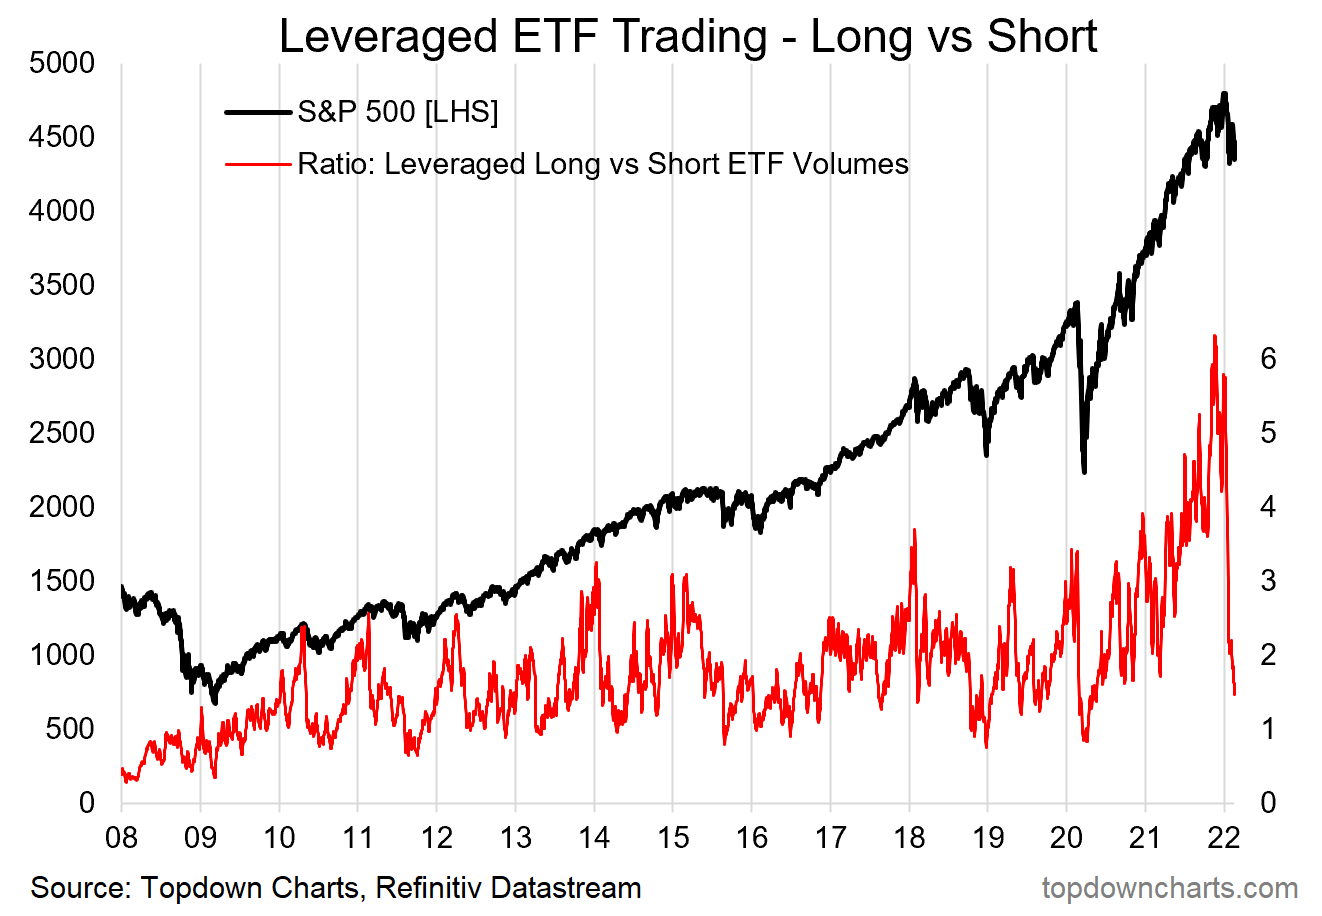
People tend to borrow or use leveraged ETFs during periods where they don’t think the market can do anything wrong. The red line shows the net leverage long versus short. This chart probably shows that bullish risk-taking seems to have collapsed.
I invested in a diversified portfolio of exchange-traded funds (ETF) and stocks listed in the US, Hong Kong and London.
My preferred broker to trade and custodize my investments is Interactive Brokers. Interactive Brokers allow you to trade in the US, UK, Europe, Singapore, Hong Kong and many other markets. Options as well. There are no minimum monthly charges, very low forex fees for currency exchange, very low commissions for various markets.
To find out more visit Interactive Brokers today.
Join the Investment Moats Telegram channel here. I will share the materials, research, investment data, deals that I come across that enable me to run Investment Moats.


Do Like Me on Facebook. I share some tidbits that are not on the blog post there often. You can also choose to subscribe to my content via the email below.
I break down my resources according to these topics:
- Building Your Wealth Foundation – If you know and apply these simple financial concepts, your long term wealth should be pretty well managed. Find out what they are
- Active Investing – For active stock investors. My deeper thoughts from my stock investing experience
- Learning about REITs – My Free “Course” on REIT Investing for Beginners and Seasoned Investors
- Dividend Stock Tracker – Track all the common 4-10% yielding dividend stocks in SG
- Free Stock Portfolio Tracking Google Sheets that many love
- Retirement Planning, Financial Independence and Spending down money – My deep dive into how much you need to achieve these, and the different ways you can be financially free
- Providend – Where I used to work doing research. Fee-Only Advisory. No Commissions. Financial Independence Advisers and Retirement Specialists. No charge for the first meeting to understand how it works
- Havend – Where I currently work. We wish to deliver commission-based insurance advice in a better way.
Kyith is the Owner and Sole Writer behind Investment Moats. Readers tune in to Investment Moats to learn and build stronger, firmer wealth foundations, how to have a Passive investment strategy, know more about investing in REITs and the nuts and bolts of Active Investing.
Readers also follow Kyith to learn how to plan well for Financial Security and Financial Independence.
Kyith worked as an IT operations engineer from 2004 to 2019. Currently, he works as a Senior Solutions Specialist in Insurance Start-up Havend. All opinions on Investment Moats are his own and does not represent the views of Providend.
You can view Kyith's current portfolio here, which uses his Free Google Stock Portfolio Tracker.
His investment broker of choice is Interactive Brokers, which allows him to invest in securities from different exchanges all over the world, at very low commission rates, without custodian fees, near spot currency rates.
You can read more about Kyith here.
- New 6-Month Singapore T-Bill Yield in Late-April 2024 to Drop to 3.70% (for the Singaporean Savers) - April 18, 2024
- Golden Nuggets from JPMorgan Guide to Retirement 2024. - April 16, 2024
- Be Less Reliant on Banks and Build Stronger Capital Markets by Pushing for Better Shareholder Dividend and Buyback Yield - April 14, 2024
KLKK
Tuesday 22nd of February 2022
If covid didnt kill the stock market maybe a war (or several) will. Imagine what if Russia invades Ukraine China invades TW DPRK launches nuclear
Then maybe it will be a great reset to the market and real estate (at the loss of innocent lives) ... need to brace ourselves for the worst to come.