I do not know about you but whenever I looked at an investment or an investment strategy, there will be one or a couple of key thing that made me feel that I should take my chance and go down certain rabbit holes.
When it comes to Smart Beta or factor investing, it was this key thing that I noticed when I tabulate the annual returns of the MSCI World and the different MSCI World factor indexes.
Note: I provided an introduction to smart beta passive investing in this in-depth article here.
If you invest in an exchange-traded fund that tracks the MSCI World, you are able to periodically add to a “volatile long term saving account” that enable you to passively earn market returns.
I do know that there is a recent period where the MSCI World did not perform very well.
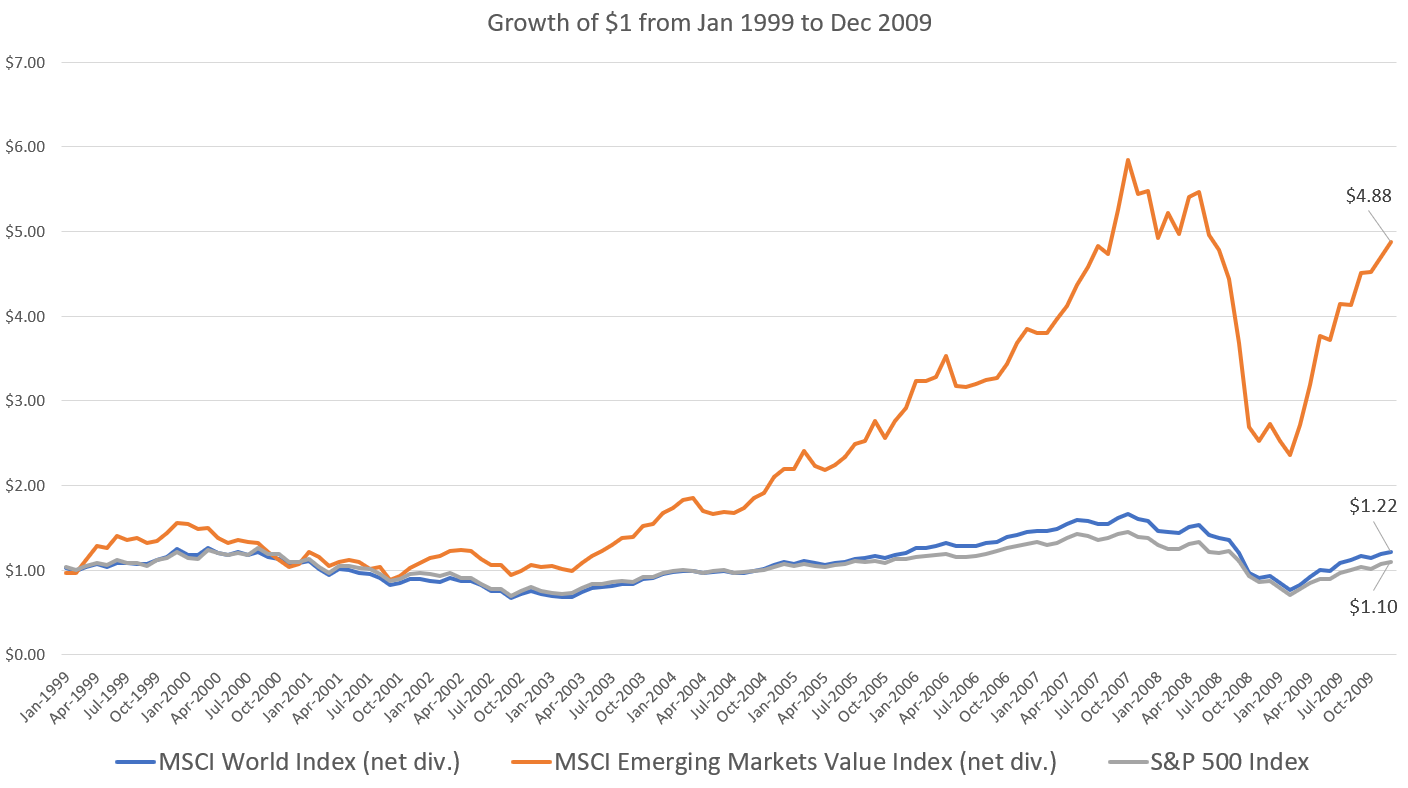
How the MSCI World Performed from 1999 to 2009
The recent performance of MSCI World or S&P 5000 for the matter, have made it easy to sell the idea of investing in solely one MSCI World or S&P 500 ETF.
I think even if the US is a superpower, there are periods where their stock market performance was not doing so well.
The 1999 to 2009 was a challenging period for the stock market.
- The MSCI World did a cumulative return of 21.9% or annualized return of 1.8% a year
- The S&P 500 did a cumulative return of 10% or annualized return of 0.9% a year
- The MSCI Emerging Market did a cumulative return of 388% or annualized return of 15.5% a year
Some investors are lucky. They started investing in the US market for the past decade without any excess baggage. You have to learn and understand why some of your older peers stuck with emerging market stocks because if you start investing in 2003 or so, you would have a totally different experience!
If you invest in solely one MSCI World Index based ETF, you might one day experience this very challenging sequence.
I asked myself: For rather passive investors, can we do better?
MSCI World 1999 to 2009 Performance Versus Various MSCI World Smart Beta Indexes
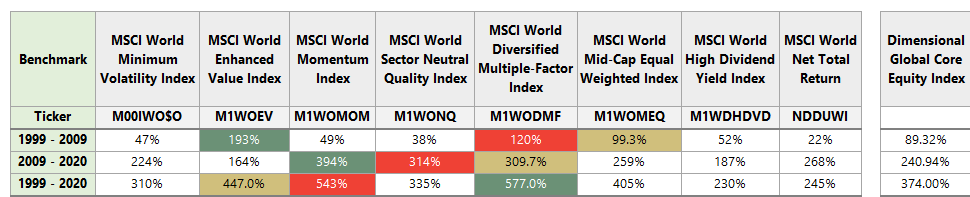
I have tabulated the MSCI World index versus the various MSCI World Factor Index, Multi-Factor Index avalable:
Each factor index hope to capture a certain driver of written proven to work in different market and time period.
The MSCI World Diversified Multiple-factor Index is a combination of small, value, quality and momentum.
There are three different color shadings. They indicate the index with the best performance that year (Green), second best (Orange) and third best (Dirty Yellow).
I have also included the Dimensional Global Core Equity Index, which is an index that backtests how the DFA Global Core Equity Fund would do if it is available since 1999.
The DFA Global Core Equity is a multi-factor unit trust tilted towards smaller, cheaper and more profitable company used by MoneyOwl, available at Endowus and recommended by my firm to our clients to help them build wealth.
If you focus on 1999 to 2009, you would notice that the top three performing indexes were:
- MSCI World Enhanced Value Index – 192%
- MSCI World Diversified Multiple-Factor Index – 120%
- MSCI World Mid-Cap Equal Weighted Index – 99%
All three did better than the MSCI World index, which did 22%.
But my biggest take away was: If you observe carefully, almost all the factors did better than the MSCI World.
If we look at 1999 to 2020, one of the best performing index was the MSCI World Momentum Index, which did 543% during this 22 year period (8.8% a year). However, the momentum index did not do as well from 1999 to 2009 (3.7% a year) but it still did better than the MSCI World.
I like the MSCI World Diversified Multiple-Factor Index as it did rather well across both 11-year periods and the full 22-year period. (On London Stock Exchange, this is IFSW.L)
Across different time period, ou would notice that Momentum, Quality, Multiple-Factor, Equal-Weight did well in all time periods versus the MSCI World.
Another conclusion from this is that it is challenging to find a factor that will work out the best across all time periods. Factors come and go. Factors also performed to different degree.
The DFA Global Core did not perform as well as the MSCI World in the past 11 years. However, over that challenging period, the Global Core performed better as well as over the entire 22-year period.
MSCI USA and S&P 500 from 1999 to 2009 Performance Versus Various MSCI USA Smart Beta Indexes
I wanted to zoom in to the USA market to see the performance:
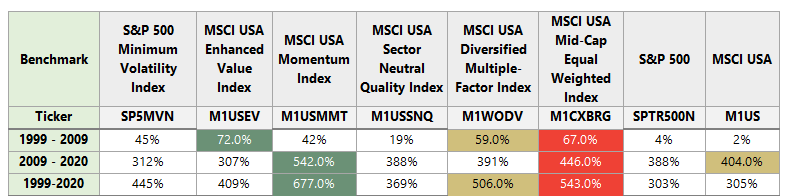
For that challenging 11-years, MSCI USA did 0.2% a year and S&P 500 did 0.36% a year. Basically, the USA, dominant in the MSCI World, pulled down its performance.
The top performing indexes during 1999 to 2009 was:
- MSCI USA Enhanced Value Index – 72%
- MSCI UA Mid-Cap Equal Weighted Index – 67%
- MSCI Diversified Multiple-Factor Index – 59%
The order is slightly different but the top performers of MSCI World and MSCI USA is pretty similiar.
If you are invested in any of the factor index during that period, you would have done better than a simple market-cap-weighted S&P 500 or MSCI USA.
For the entire 22-year period the best performing index was the MSCI USA Momentum Index, follow by the MSCI USA Diversified Multiple-Factor Index and MSCI USA Mid-Cap Equal Weighted Index.
Across different time period, ou would notice that Momentum, Quality, Multiple-Factor, Equal-Weight did well in all time periods versus the S&P 500 and MSCI USA.
MSCI Emerging Market from 2009 to 2020 Performance Versus Various MSCI Emerging Market Smart Beta Indexes
If we are focused on challenging periods, then I want to cover most of my bases by taking a look how pervasive are the performance of these factors.
While they did very well from 1999 to 2009, the emerging market struggled versus the USA and World market.
This presents a good opportunity to review the factor index performance from 2009 to 2020:

The best performing indexes are:
- MSCI Emerging Markets Momentum Index – 339%
- MSCI Emerging Markets Diversified Multiple-Factor Index – 264%
- MSCI Emerging Markets Quality Index – 264%
There are two common names here compared to the previous two region comparisons.
The two factor indexes that did not do very well versus the MSCI Emerging Markets are the Value and Equal-Weighted Index. The equal-weighted index’s performance was quite close to the market-cap weighted index.
So that leaves one index that did not perform so well – value.
Across a different time period, you would notice that Momentum, Quality, Multiple-Factor, Equal-Weight, Minimum Volatility did well in all time periods versus the MSCI World.
MSCI Europe from 2011 to 2020 Performance Versus Various MSCI Europe Market Smart Beta Indexes
Let us round this off by taking a look at a region that not many investors here put on their radar because they are like the sick child: Europe.
We will look at the performance in the 10-year period from 2011 to 2020:
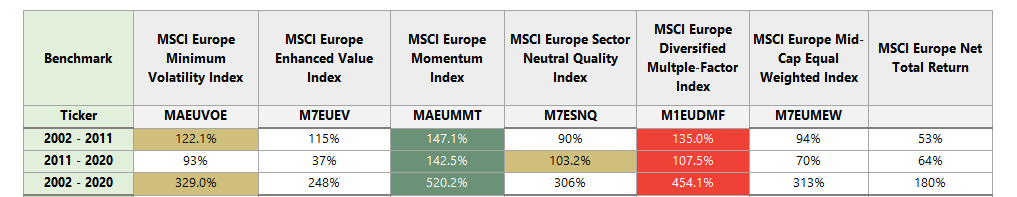
The top performing indexes during 2011 to 2020 are:
- MSCI Europe Momenturm Index – 142%
- MSCI Europe Diversified Multiple-Factor Index – 107%
- MSCI Europe Sector Neutral Quality Index – 103%
We are seeing some familiar names.
During this period, the value factor failed to show up as well. Other factor indexes did better than the MSCI Europe Index.
Across a different time period, you would notice that Momentum, Quality, Multiple-Factor, Equal-Weight, Minimum Volatility did well in all time periods versus the MSCI World.
Conclusion
Smart Beta indexes can do better than the traditional indexes because other than capturing market risks, smart beta indexes also try to capture more risks. We are compensated with greater returns if there is really a risk premium.
Predicting which factor will do well in the future is not simple. Factors come and go.
Most of you would be happy to earn long term 5-6% return, but what if there are certain periods where certain traditional market-cap weighted indexes do not do as well?
It is likely you will not know when the regions are not doing well. When you know it, it might be pretty hindsight.
We have greater aversion to the downside and thus if these Smart Beta indexes can give you a chance to do better than the market during challenging period, would you take a chance with them?
I invested in a diversified portfolio of exchange-traded funds (ETF) and stocks listed in the US, Hong Kong and London.
My preferred broker to trade and custodize my investments is Interactive Brokers. Interactive Brokers allow you to trade in the US, UK, Europe, Singapore, Hong Kong and many other markets. Options as well. There are no minimum monthly charges, very low forex fees for currency exchange, very low commissions for various markets.
To find out more visit Interactive Brokers today.
Join the Investment Moats Telegram channel here. I will share the materials, research, investment data, deals that I come across that enable me to run Investment Moats.


Do Like Me on Facebook. I share some tidbits that are not on the blog post there often. You can also choose to subscribe to my content via the email below.
I break down my resources according to these topics:
- Building Your Wealth Foundation – If you know and apply these simple financial concepts, your long term wealth should be pretty well managed. Find out what they are
- Active Investing – For active stock investors. My deeper thoughts from my stock investing experience
- Learning about REITs – My Free “Course” on REIT Investing for Beginners and Seasoned Investors
- Dividend Stock Tracker – Track all the common 4-10% yielding dividend stocks in SG
- Free Stock Portfolio Tracking Google Sheets that many love
- Retirement Planning, Financial Independence and Spending down money – My deep dive into how much you need to achieve these, and the different ways you can be financially free
- Providend – Where I used to work doing research. Fee-Only Advisory. No Commissions. Financial Independence Advisers and Retirement Specialists. No charge for the first meeting to understand how it works
- Havend – Where I currently work. We wish to deliver commission-based insurance advice in a better way.
Kyith is the Owner and Sole Writer behind Investment Moats. Readers tune in to Investment Moats to learn and build stronger, firmer wealth foundations, how to have a Passive investment strategy, know more about investing in REITs and the nuts and bolts of Active Investing.
Readers also follow Kyith to learn how to plan well for Financial Security and Financial Independence.
Kyith worked as an IT operations engineer from 2004 to 2019. Currently, he works as a Senior Solutions Specialist in Insurance Start-up Havend. All opinions on Investment Moats are his own and does not represent the views of Providend.
You can view Kyith's current portfolio here, which uses his Free Google Stock Portfolio Tracker.
His investment broker of choice is Interactive Brokers, which allows him to invest in securities from different exchanges all over the world, at very low commission rates, without custodian fees, near spot currency rates.
You can read more about Kyith here.
- Should I Take Less Risk in My Fixed Income Allocation by Moving Away from a Global Aggregate Bond ETF? - May 5, 2024
- Singapore Savings Bonds SSB June 2024 Yield Climbs to 3.33% (SBJUN24 GX24060A) - May 3, 2024
- New 6-Month Singapore T-Bill Yield in Early-May 2024 to Stay at 3.75% (for the Singaporean Savers) - May 2, 2024
Humji Investor
Sunday 28th of February 2021
Thanks for sharing this post. It would be interesting to see in the next decade how much outperformance factor-based investing can achieve. As I recall smart beta strategies started becoming more popular in the latter half of 2010-2020 period due to its historical outperformance. Perhaps going forward the outperformance may weaken due to overcrowding in these factors.
Kyith
Sunday 28th of February 2021
Hi Humji Investor perhaps i will do an article on this area. I think one thing you can think about is....We know that the past 2.5 years, the market seem to change a lot. if overcrowding have removed any of these premiums, then we should not see that great outperformance in the Momentum Factor.