The department of Singapore statistics published the Household Expenditure Survey 2017/18.
The department published the results every 5 years. And so we have the figures to compare against the expenditure figures published in 2012/13. That is the data 5 years ago.
There is too much data, and we would probably not be able to finish in one seating.
As a researcher of financial independence, I was curious whether the data do show that Singaporean’s will find it challenging to reach their financial independence goal.
How Do We Judge whether You can Be Financial Independent Easily?
In most cases, if you map out your cash inflow and cash outflow, factor in the rate of growth of your wealth, and expenses, you could figure out when a person can be financially independent.
You could however, rely on some rule of thumb to determine if this household can be financially independent much faster than the average folks.
Usually, we rely on two metric:
- Your long term rate of return of your wealth
- Your average savings rate through your working career
Long Term Rate of Return
For #1, your wealth are your
- investment property
- cash, deposits
- unit trusts, insurance savings plans, ILP
- stocks and bonds
- exchange traded funds
This is net of your liabilities.
We say long term because in any given year, your rate of return can be very high or very low (short term the sample is smaller, you tend to get more extreme results). Over longer term, we are able to see your average consistent rate of return.
The higher your long term rate of return, the higher chances you will be financially independent earlier because your wealth accumulates faster.
Your savings rate
You make $70,000 a year. That can be the amount you take home or gross before deducting your CPF. If you spend $42,000 a year, your savings is $28,000 a year.
Your savings rate is ($70,000 – $42,000)/$70,000 = 40%.
Whatever you do not spend, you save. It has to go somewhere.
What you save, becomes your wealth. The more you save the more wealth you get.
How Long to Reach Financial Independence?
If you pair savings rate with the long term rate of return, that is when you see your wealth built up.
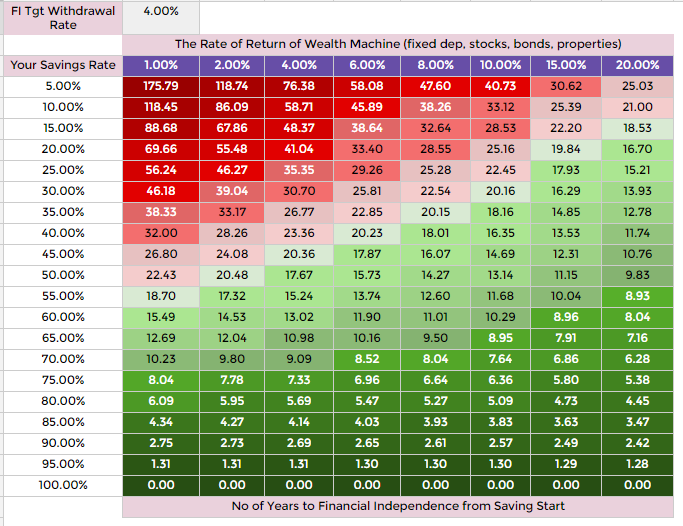
I shown this table in the past. Each number on this grid is how long it takes for you to be financial independent.
Going back to the previous example, if your savings rate is 40%, that means you spend the other 60%. Your rate of return of your wealth can be from 1% to 20%.
It will take you between 11.74 years to 32 years to be financially independent.
So from the table, you can see that if your savings rate is 50%, it is between 10 years to 22 years. If it is 60%, it is between 8 years to 15 years.
The higher the savings rate, the less the long term rate of return matter. You realize when the savings rate is high, whether you get 4%, 6%, 8% rate of return, it does not speed up the number of years that much. (50% savings rate the difference is just 3 years)
What if your annual expenses change?
Then you recompute how long you need. This rule of thumb is easy to recompute. Many people will tell me your expenses keeps going up. There is a lot of truth to that, but for some, they can envision that if they stop working, their expenses will be lower.
Adjust accordingly.
The assumption is that you take out a constant, inflation adjusted amount from your wealth over the next 30 years. You withdraw 4% in the initial year, and adjust with inflation over time.
There are a lot of debate whether 4% is a safe initial withdrawal rate. I think let us leave that out of the equation. If you think it is not safe, because the duration in which you need the money is longer, use 3.5%, 3%, 2.5%. Come up with your own metrics. I have already say this is a rule of thumb. It is a gauge how close you are to financially independent.
To stop working, you need more thorough planning.
Once we established this we can take a look at the Singapore Statistics
The Household Income Analysis
I won’t be able to cover all demographics in one article, thus let me focus on just a few prevalent ones.
Singaporeans work a spectrum of jobs. They live in different kind of dwellings. Different age group earns a different salary.
My way to tackle this is to pick out the prevalent household types, and take a look at the prevalent jobs categories and age group.
The majority of Singaporeans lived in 4 room and 5 room HDB flats. For work purposes, let me look at the upper echelons of Singapore as well. These will be those that stayed in the Condos and Landed Property.
The statistics show the income and expenditure on a monthly basis. The income also factored in the employer’s portion of CPF. It is likely they took the annual taxable salary and divide by 12.
We could factor in our CPF portion in our analysis but most of us would like to see how much we could achieve with our take home. My struggles are that above $6,000, the income does not contribute to CPF. It is a pain but I worked out the figures.
We presented the following Take Home Income data:

I found that the most common home types are the 4 room and 5 room. I found that the education level most prevalent are the university and diploma.
I would also like to see the take home income of different age group. I did not list all age group. My focus tend to be on the 30 to 54 year old that are accumulating towards financial freedom. They are the group that are not able to access their CPF currently.
I would also like to see the take home income of those above 65 years old.
Some observations:
- There are those who have diploma qualification but lived in landed property
- University take home income higher than diploma
- Those who stayed in landed has higher take home income than those in condo, and 5 room and 4 room
- Those older than 65 years old and staying in 4-5 room HDB and landed take 60% less income than when they are working before age 54
- Those older than 65 years old and staying in condo, saw their income cut by 50%
Let us see the income progression for different age group:
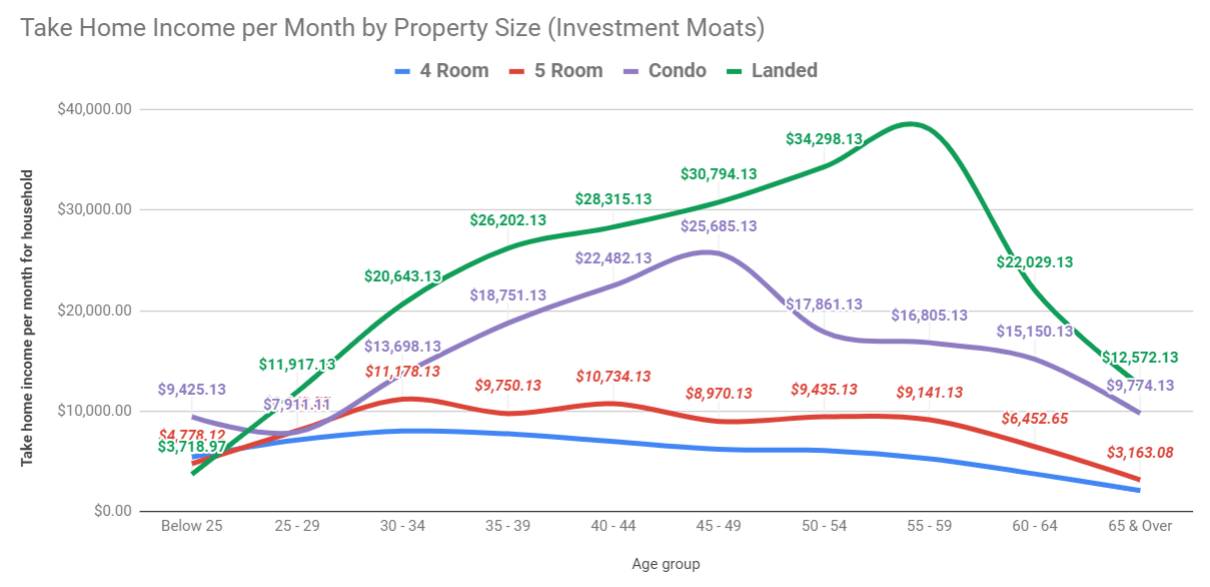
You would notice those living in 4 room and 5 room showed stagnating or declining income. They peak at 30 to 34 years old, before stagnating and declining.
In contrast, there is a reason why those staying in condo and landed was able to stay there. Those staying in condo and landed saw their income go up.
The condo ones peaked earnings at 45-49 years old. They either get retrench here, or manage to retire here.
If a lot of us are staying in 5 room, then many household have an annual take home income of $120,000 to work with. Those living in condo have $200,000 a year to work with.
The Monthly Expenses Analysis
The Singapore statistics provides many angles to household expenses. I have picked out some which are more relevant.

I think that for expenses, we have to look at various angles.
So I looked at:
- The expenses of the 61-80 decile and 81-100 decile. These tend to be those above average income
- The expenses based on household size
- The expenses of the PMETs and managers
Here are some observations:
- Overall, there is a big monthly expense gap between condo and 5 room HDB
- The expense differences between 61 to 100 decile for 4 rm, 5 rm, Condo is small. The difference is bigger for landed properties
- The expenses for a single is almost the same, despite living in 4 room or 5 room
- The expenses for a single is almost the same, despite living in condo or landed
- In fact, the expenses difference between 2 ,3, 4 person household for condo and landed are almost the same
- There are synergies when the household moves up from 1 person to 2, 3, 4 person. Expenses do not double, triple or quadruple just because the household has more people
- Managers earn more than PMET
- The average expenses seem to match those with a 4 person household
We can then take the average expense for the following expenses:
- 61-80 income decile
- 81-100 income decile
- 3 person household
- 4 person household
- PMET
- Senior officials and managers
We get an average expense of
- 4 rm HDB: $4,711
- 5 rm HDB: $6,176
- Condo: $8,418
- Landed: $10,973
Let us look at the expenses based on age group:

Here are some observations:
- Expenses for 4 room, 5 room, landed dwellers stayed largely consistent
- Expenses for condo dwellers rose over time
- Expenses for those older than 65 dropped by 50% for 4 room, 5 room and landed property. Condo dwellers went down by 30%
The previous average monthly expenses coincide with those in the age group 45 to 49 years old.
Analyzing Singaporean’s Savings Rate
With these figures, we can work out the spectrum of savings rate. This would enable us to see whether Singaporeans have any chance to be financially independent.

We can compute the savings rate based on the different monthly expenses. We compute based on the average take home pay for the various housing categories.
A clear observation is how high the savings rate we get!
The single household should be looking to be financially independent in 5 to 8 years due to the 75-80% savings rate!
A 70% savings rate means their years to financial independence takes between 6 years to 10 years. If the rate of return of your wealth is at least 6%, it will take 8.5 years for you to reach it. If your rate of return is less it will take you a long time.
Those with the larger household have a lower savings rate. But even the 4 person household have a 40% savings rate. PMET have at least a 40% savings rate.
This is based on take home pay.
A 40% savings rate means their years to financial independence takes between 11 years to 32 years. If the rate of return of your wealth is at least 6%, it will take 20 years for you to reach it. If your rate of return is less it will take you a long time.
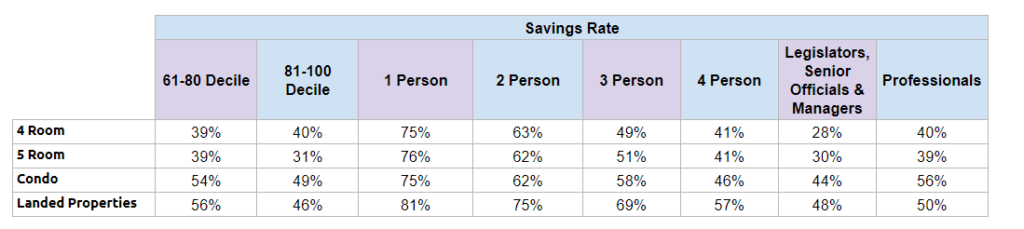
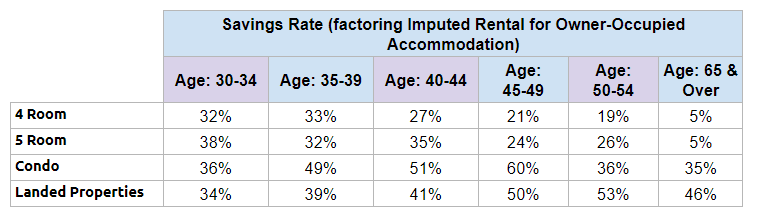
Now let us look at the savings rate, for different age group:

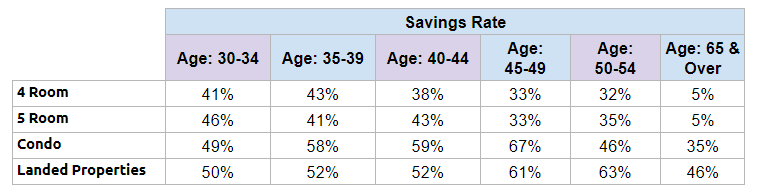
The Savings Rate are as high. But we observe for those living in 4 and 5 room HDB flats, and from age 45 to 54, the savings rate are going down.
For those that are above 65 years old, the savings rate is low but this may be understandable.
With such a high savings rate, financial independence seem to be within reach for Singaporeans.
So why do we have so many articles explaining that retirement is not possible in Singapore?
I think the savings rate is high enough for most Singaporeans to have a chance to be financially independent. Based on the data. Being financially independent early or later demands a high enough savings rate. The singles will have an easier time. The DINKs will also have an easier time. It is a choice. Those with a good job can achieve it.
The formula is to have an income in a higher decile and spending in a lower decile.
How I Think Expenses was Collated
The first thing is to study how the expenses is formed. What was omitted. There were two areas that I noticed not included:
- Their insurance figures only factor in term insurance not cash value insurance
- They did not factor in mortgage
This savings rate will look incredulous to you but you got to think if have cash value life insurance policy. If you have then those are considered as savings.
The rate of return in the past are usually around 2.5% to 3.5%. You can read my article here on some historical return rate.
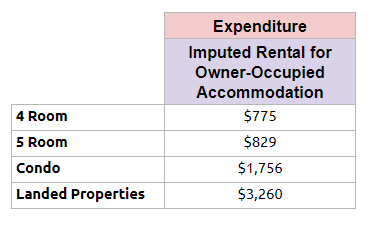

I have noticed that aside from the monthly expense, there is an imputed rental for owner-occupied accommodation. This seem to be simulating the additional expenses should they be renting a similar properties. I thought some of the figures look low.
But if you factored in this “rent”, the expenses will be higher.
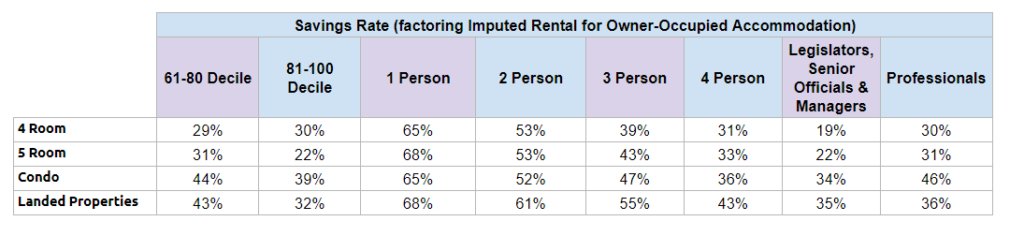


Some observations:
- The Singles still have high savings rate
- So does the Dual Income No Kids (DINKs)
- You start seeing the savings rate for the 4 to 5 room, 3 and 4 person household come down
- For some reason the managers living in 4 to 5 room look to be really struggling
- The 45 to 54 year old living in 4 room and 5 room flat drop off over time while those in Condo and Landed Properties stayed well
Despite this, for a large part, we still have a savings rate of 30% at least for those living in 4 to 5 room flats.
A 30% savings rate means their years to financial independence takes between 14 years to 46 years. If the rate of return of your wealth is at least 6%, it will take 26 years for you to reach it. If your rate of return is less it will take you a long time.
I do not think we should factor in the Imputed Rental from Owner Occupied Accommodation. This is because most of household own a property. The way our mortgage finance rules are set up is such that we are deterred from using our CPF after retirement age. So majority will have owned their property after retirement age.
Furthermore, the mortgage were usually funded with CPF. So this cost is not part of your take home pay.
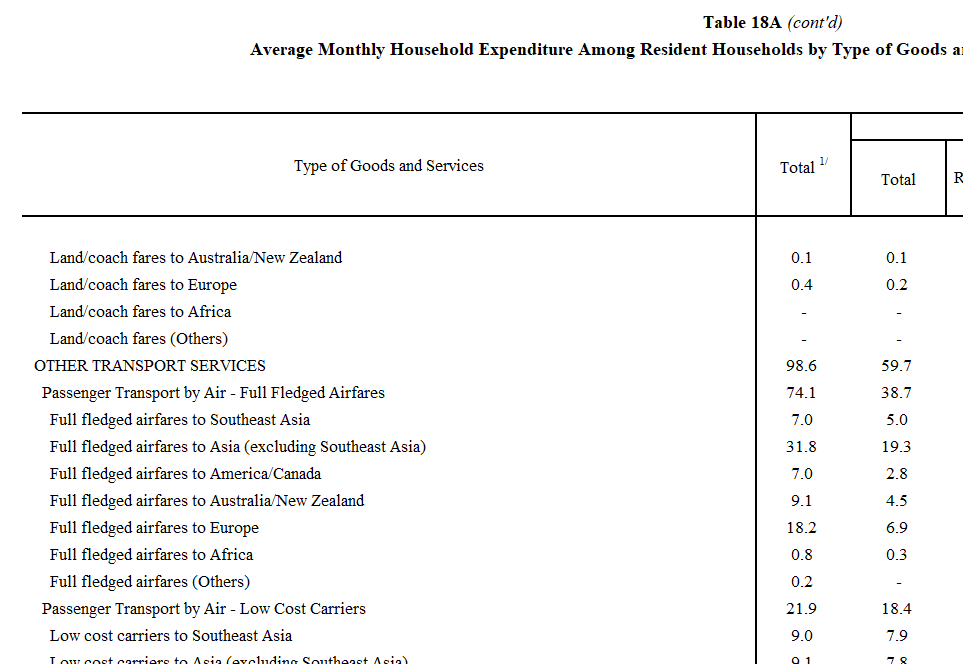

The above expenditure data shows the monthly expenses spent on other transport services. These data were broken down by full fledged air fares to different parts of the world. The way the data is group together do not feel natural to me.
I felt the only way this data could exist, is that the expenses were take from some Airline database, NTUC Fair Price database. These data are than correlate back to the different demographics.
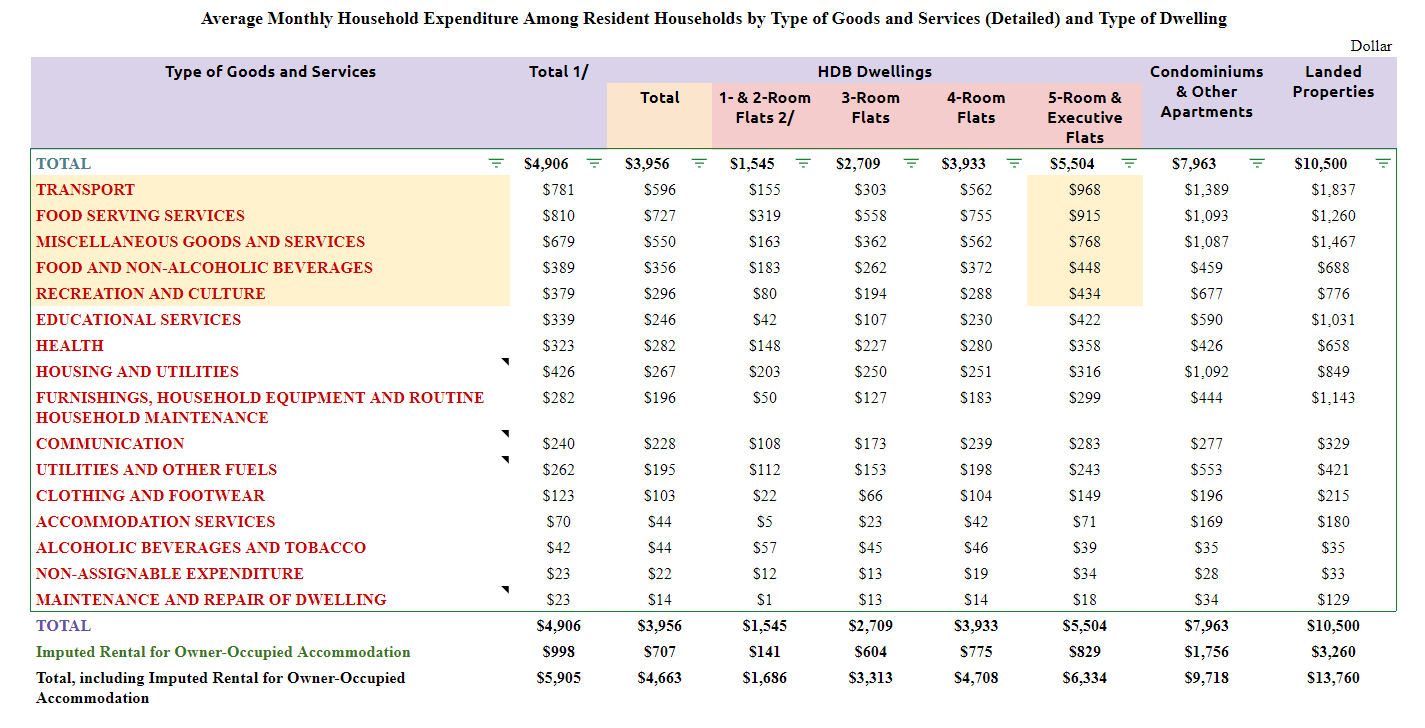
In the table above, we are able to see the top categories of expenses. I have sorted based on 5 room and executive flats.
The first thing to note is that this is average cost. And this is likely to make things…. weird.
We have those living in 1 or 2 bedroom flats owning cars. Generally, we should not expect a lot of them to. So why are there vehicle owning costs? This is because if you have a retiree downgrading to a 2 bedroom but still able to afford a vehicle, this cost is spread among all the 1 or 2 bedroom household.
It may be right that the costs for this group is low. For other expense categories, the expenses might be pulled up due to the average spending amount.
The top 5 category for 5 room flat accounts for 65% of the costs:
- Transport entails purchase of vehicles and what comes with it. It also includes your public transport costs. For the 4 to 5 room HDB, this is the highest
- Food serving typically takes the data collated from restaurants, pubs, fast food restaurants, hawker centers, food delivery
- Miscellaneous goods and services includes personal care (hair dressing, grooming, electrical appliances for personal care), insurance (no whole life type insurance, those expense only)
- Food and Alcoholic beverages should be the data taken from the supermarkets. It is your groceries
- Recreational and culture includes your holidays, reading, pets and photography
The way to use this is your mileage may vary. This might be less applicable to you. If you are the frugal sort, your expenses could be 10 to 20% less than this average amount.
Analyzing the Expenses of those 65 years old and Older
It is likely the 65 years and older cohort makes up of those that are semi-retired, retired and working. Their expenses should reflect that of a retirement lifestyle.
The average expenses are:
- 4 rm HDB: $1,989
- 5 rm HDB: $2,992
- Condo: $6,334
- Landed: $6,730
In June 2019, a team of researchers from Lee Kuan Yew School of Public Policy released their research on working with a few focus group to determine the household budgets necessary for older people to meet their living needs.
I have written about the interesting takeaway from this report here.
This public policy school study is based upon a focus group and what the people think constitute a budget that is meaningful enough.
So how far are these figures from the stats in general?
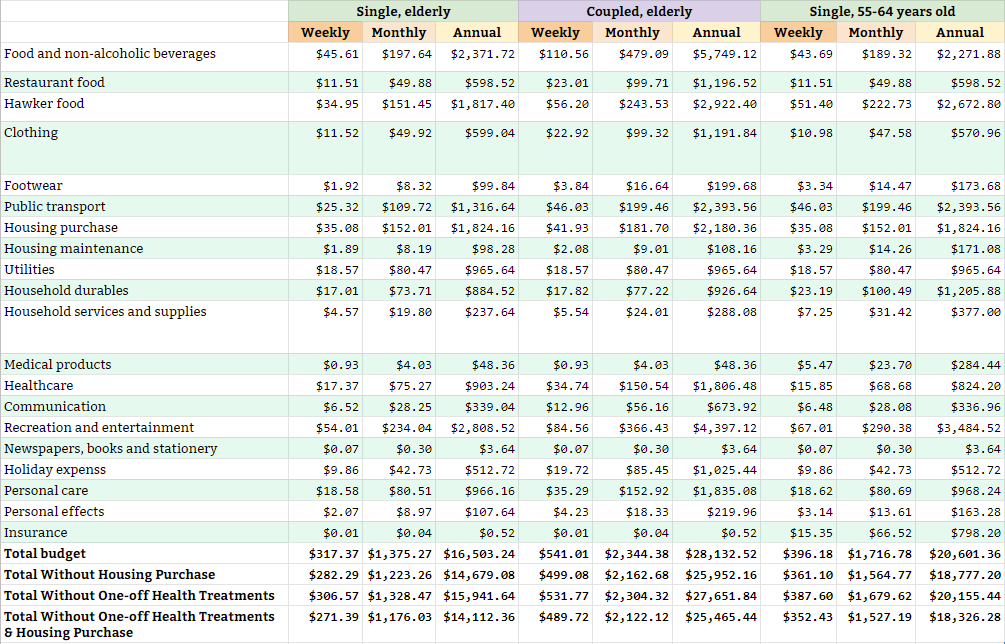
- Single monthly without housing: $1,223
- Couple monthly without housing: $2,162
The LKYSPP survey’s budget look lower than the 4 to 5 room actual spend. Probably at the lower bound of the Singapore statistics.
I can see that $2000/mth for a 4 room HDB flat be a good spending rate for retirement.
If a couple has CPF Full Retirement Sum (FRS), they should be able to provide that amount. But not everyone has the FRS. They have used their CPF to purchase their HDB.
That would mean they need a retirement fund. Since their retirement is not in an annuity (unless they top up their CPF to be ready for CPF Life), they might be looking for at least $600,000 in wealth based on the 4% withdrawal rate.
Of course, if they meet the CPF Basic Retirement Sum (BRS) which is half of the FRS) they may be able to offset this.
If a couple have $75,000 each in their CPF Life, and they chose the CPF Basic option, each of them would have $450 a month. This would offset 45% of the $2,000 per month expenses. This would approximately reduce the wealth they need to $330,000 at least. Alternatively, they can top up their CPF so that it is fully funded. Instead of needing $330,000 at 65, at age 55 they would just need $150,000.
In Conclusion
The way the data is pieced together makes me question whether I could conclude our take home savings rate is at least 30% of our take home pay.
Yet the way it works is that those frugal folks will buffer those spendthrifts. So perhaps the data is about right.
Let me summarize some big observations for myself.
The savings rate of 30% to 40% looks better than a lot of other countries. But because we do not have a government supported system in Singapore, we have to come up with lot of the costs (above the bare minimum) ourselves.
This means Singaporeans take between 11 to 46 years roughly to be financially independent. A lot will depend on your rate of return:
- Rate of return of 2%: 28 to 39 years
- Rate of return of 4%: 23 to 30 years
- Rate of return of 6%: 20 to 25 years
Most will need to start building wealth at least at age 35 to 40 years for it. This is so they can retire at age 65. If the rate of return of your wealth is low (1% versus 5%), you probably need to work 10 to 15 years more.
There seem to be a wealth divide. This wealth divide is based on income. Those that seem to do better in their career, their careers continue to flourish.
In contrast, those whose career seem to stagnate, their income does not allow them to upgrade their comes. It seems to be meritocracy at work. Those who do well get rewarded with a higher social economic standing.
Those living in 4 to 5 room HDB, their income peaked around 30 to 34 years old. Those living in Condo peak much later at 45 to 49 years old. Those in Landed seemed to drop off after 55 years old.
There is a big expense gap between the 5 room HDB dwellers and the Condo dwellers.
The expenses for single household largely stayed the same despite some upward mobility.
We can make use of some average expenses in our planning:
- 4 rm HDB: $4,711
- 5 rm HDB: $6,176
- Condo: $8,418
- Landed: $10,973
Your mileage may vary.
Other than condo dwellers, expenses do stay the same over certain age groups from 30 years to 54 years.
When you are 65 and below, your expenses go down by 30-50% (leaning closer to 50% instead of 30%).
The average expenses are:
- 4 rm HDB: $1,989
- 5 rm HDB: $2,992
- Condo: $6,334
- Landed: $6,730
For those with CPF Life, you might be able to offset a large part of your retirement expenses.
I think that based on the figures, it seems financial independence for most would coincide with the defacto retirement age. The problem it seems, is the rate of return for wealth for most.
I write more about financial independence and retirement in the retirement section below:
I invested in a diversified portfolio of exchange-traded funds (ETF) and stocks listed in the US, Hong Kong and London.
My preferred broker to trade and custodize my investments is Interactive Brokers. Interactive Brokers allow you to trade in the US, UK, Europe, Singapore, Hong Kong and many other markets. Options as well. There are no minimum monthly charges, very low forex fees for currency exchange, very low commissions for various markets.
To find out more visit Interactive Brokers today.
Join the Investment Moats Telegram channel here. I will share the materials, research, investment data, deals that I come across that enable me to run Investment Moats.


Do Like Me on Facebook. I share some tidbits that are not on the blog post there often. You can also choose to subscribe to my content via the email below.
I break down my resources according to these topics:
- Building Your Wealth Foundation – If you know and apply these simple financial concepts, your long term wealth should be pretty well managed. Find out what they are
- Active Investing – For active stock investors. My deeper thoughts from my stock investing experience
- Learning about REITs – My Free “Course” on REIT Investing for Beginners and Seasoned Investors
- Dividend Stock Tracker – Track all the common 4-10% yielding dividend stocks in SG
- Free Stock Portfolio Tracking Google Sheets that many love
- Retirement Planning, Financial Independence and Spending down money – My deep dive into how much you need to achieve these, and the different ways you can be financially free
- Providend – Where I used to work doing research. Fee-Only Advisory. No Commissions. Financial Independence Advisers and Retirement Specialists. No charge for the first meeting to understand how it works
- Havend – Where I currently work. We wish to deliver commission-based insurance advice in a better way.
Kyith is the Owner and Sole Writer behind Investment Moats. Readers tune in to Investment Moats to learn and build stronger, firmer wealth foundations, how to have a Passive investment strategy, know more about investing in REITs and the nuts and bolts of Active Investing.
Readers also follow Kyith to learn how to plan well for Financial Security and Financial Independence.
Kyith worked as an IT operations engineer from 2004 to 2019. Currently, he works as a Senior Solutions Specialist in Insurance Start-up Havend. All opinions on Investment Moats are his own and does not represent the views of Providend.
You can view Kyith's current portfolio here, which uses his Free Google Stock Portfolio Tracker.
His investment broker of choice is Interactive Brokers, which allows him to invest in securities from different exchanges all over the world, at very low commission rates, without custodian fees, near spot currency rates.
You can read more about Kyith here.
C
Wednesday 21st of August 2019
Pardon me, what does it mean by "Take Home Income" (under Household Income Analysis)? Does it mean annual Total Income (as shown on NOA) + annual Employer CPF contribution?
Kyith
Wednesday 21st of August 2019
How government computes their household income is to include your gross, which includes your cpf contribution but also the cpf employer contribution. Take home means i divide this number by 1.17 then times 0.80.
Milissa
Tuesday 20th of August 2019
Hey Kyith, interesting article!
Can you please help me understand that how long to FI: Your Savings Rate and Rate of Return Matters?
Kyith
Tuesday 20th of August 2019
HI What don't you understand about the two equations
singvestor
Monday 19th of August 2019
Super analysis! Really enjoyed reading through the details. In the end it boils down to expense management. Singapore's high incomes can support high saving rates when not succumbing to lifestyle inflation, keeping up with the Joneses, driving a car etc. Geo arbitrage might be attractive also... I always daydream of alternating between Spain / Italy / Taiwan...
Kyith
Tuesday 3rd of September 2019
Now that you are in Europe, have you found a better place? Perhaps Portugal?
Aw Bean Seng
Sunday 18th of August 2019
Rubbish. This survey is too artistic and do no reflect the actual situation on the ground. Go ask those aged 65 and above, and they will tell you a different story.
Kyith
Sunday 18th of August 2019
HI Bean Seng, perhaps you can start by providing one example.
Sinkie
Sunday 18th of August 2019
I would say the figures have improved a lot from 2013 to 2018 due to the higher rate of income growth in recent years (after govt started restricting more foreigners from 2012 onwards).
It was kinda bad in the previous reports i.e. from 2008 to 2013.
Most people focus on savings rather than investing. Hence with increased longevity it simply means working & saving longer.
It's easier to convince people to work longer than to convince them to take investment risks. Hence govt will be announcing the increased retirement age & re-employment age today during Nat Day Rally. :)
For people calculating their own retirement adequacy, the concern going forward will be whether CPF payout age will also be increased inline with increased longevity?
Whether own savings or national pension, how to ensure retirement adequacy is still a hard question with no easy-to-live-with answers. Either people have high savings on their own, or govt taxes you high & put into pension fund.
Kyith
Sunday 18th of August 2019
Hi Sinkie, thanks for the semantics. I would probably take a look at the past ones. Take a while for the brain to be adjusted to it.
> Either people have high savings on their own, or govt taxes you high & put into pension fund.
-.-!