Robeco has a short and easier-to-digest article about the resurgence of the Value factor.
The main idea is that value is still alive despite many people feeling it does not work anymore.
Robeco’s data includes the broad, large and mid-cap developed AND emerging markets. This is pretty unique as most data is US-centric.
I picked out the following charts to be more interesting for me.
The chart below shows the forward price-earnings for the top (value) and bottom (expensive) quintile portfolios of an enhanced value strategy (which is a composite value strategy based on book-to-market (R&D adjusted), EBITDA/EV, CF/P and NPY metrics).
The investing universe consists of developed and emerging market indices.

We observe that the median P/E for value stocks stays around 11 times (low of 8 and high of 14) but the most expensive stocks is around 20. During the dot-com bubble, the number goes as high as 30 times and during Covid recently, it ends up higher.
This spread between the most expensive and cheapest have widen and have not closed back down.
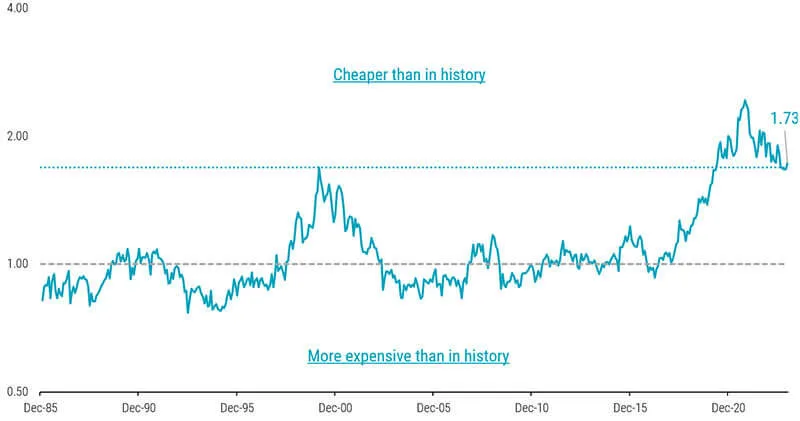
The chart below shows the composite valuation spread between the top and bottom quintile portfolios. We are talking about the same universe.

The spread between expensive and cheap have narrowed but in the context of history, is still very, very wide. The current wide spread is as wide as at the peak of the dot-come bubble in 2000.
While the changes in spread accounted for a significant part of the returns, there are other contributors of returns such as carry (positive), portfolio migration from cheap to expensive (positive) and change in fundamentals (can be positive or negative).
Changes in spread is a less stable returns compared to carry, migration and fundamentals.
The chart below shows the relationship between value returns and changes in valuation spreads:

There is a negative relationship between value returns and changes in the valuation spread. The value spread account for roughly 50% of the variation of the returns.
As valuation spread narrows (become more negative), the annual value return tends to be higher.
Without any change in value spread, the intercept is about 10%, which can be interpret as the value premium if we are running a long value short expensive strategy.
If the value spread narrows, returns would be good.
The chart below shows the continuously compounded annual value return scenarios for value investing:

Currently, the value spread is around 1.73. If there is no value spread narrow or widen, the returns will be about less than 10%. But if the valuation spread narrows to 1.5, then the returns are closer to 20%. But if it widens then we see a negative 7% return.
The chart below tries to see if there is a relationship between value returns and the 10-year Treasury yield.

The data does not show that there is a relationship between value and interest rate changes.
Perhaps the most interesting to me is the chart below:

Many of us imagine that growth stocks will have a longer growth duration than the value stocks. Therefore, they should benefit from a lower discount (hurdle) rate that applies to their cash flow. Fundamentally, that make sense.
But what we are more concern about is whether expensive stocks do indeed have higher future growth.
The chart above shows the previous 5-year realized growth in earnings (Realized) and what analysts’ projection of long-term (5-year) earnings per share growth expectations at different time during the portfolio formations (the months in the x-axis).
At the initial time of portfolio formation, the EPS growth expectations between cheap and expensive is wide but these differences is not persistent.
Both the Realized and Expected growth rapidly converges after the portfolio formation.
Cheap stocks experience improvements in realized and expected growth, while expensive stocks have deteriorating growth for both.
Investors seem to overpay for expected growth differences at portfolio formation. The conclusion is that the growth does not live up to investors expectations.
You may have a more value-based philosophy instead of a philosophy of trusting the market. If that is the case, there are unit trust and exchange-traded funds that allow you to express this philosophy.
If you want to trade these stocks I mentioned, you can open an account with Interactive Brokers. Interactive Brokers is the leading low-cost and efficient broker I use and trust to invest & trade my holdings in Singapore, the United States, London Stock Exchange and Hong Kong Stock Exchange. They allow you to trade stocks, ETFs, options, futures, forex, bonds and funds worldwide from a single integrated account.
You can read more about my thoughts about Interactive Brokers in this Interactive Brokers Deep Dive Series, starting with how to create & fund your Interactive Brokers account easily.
- The Cheapest Way to Extend Your Laptop to TWODisplay that I Can Find. - April 29, 2024
- My Quick Thoughts on the Net Cash, 4% Yielding Boustead. - April 28, 2024
- My Dividend Experience Investing in UCITS iShares iBond Maturing in 2028. - April 23, 2024
