LionGlobal came up with this new ETF called the APAC Financials Dividend Plus ETF.
The APAC Financial Dividend ETF is the most obvious ETF that should have existed, but no one has come up with it until now.
- Singapore investors has this idea that the only companies that is worth invested in are the banks of Singapore (OCBC, UOB and DBS)
- Singaporeans favour dividends.
So, add a few more banks and come up with an ETF with both Financials and Dividend in the name.
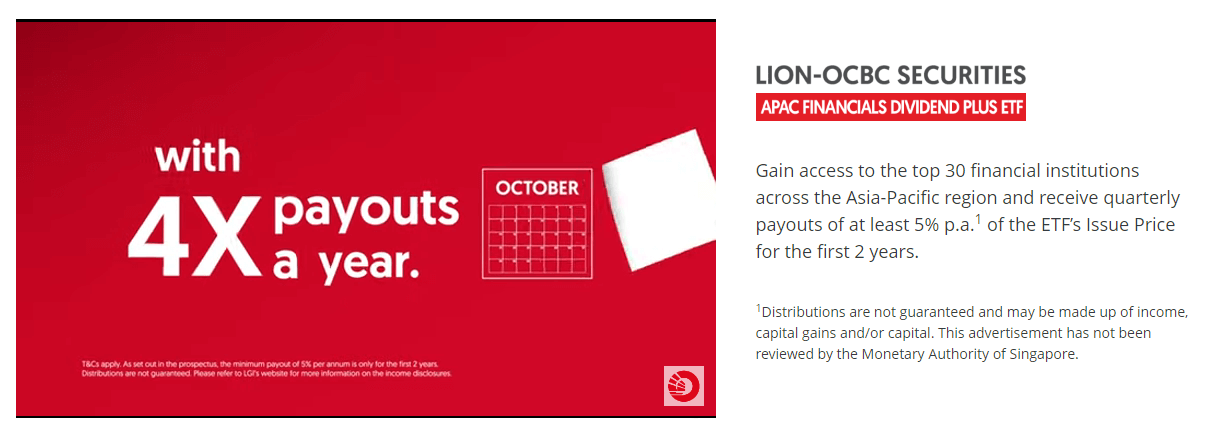
You can see the marketing. Payout four times a year and a minimum of 5% dividend yield!
Then they add a 1 on top and say the distributions not guaranteed and can be made up based on capital gains.
I think give it enough time and our advisers will have quite a few clients asking them “What do you think of this APAC Financials Dividend ETF? Do you think it is a good idea to invest in it?”
I don’t know, but I do think it is more diversified than investing only in three banks.
And I don’t think the fund manager knows as well. By most measures, fund managers will release the funds when they are very popular but in market cycles, what comes next might be the usually sector, or regional struggle.
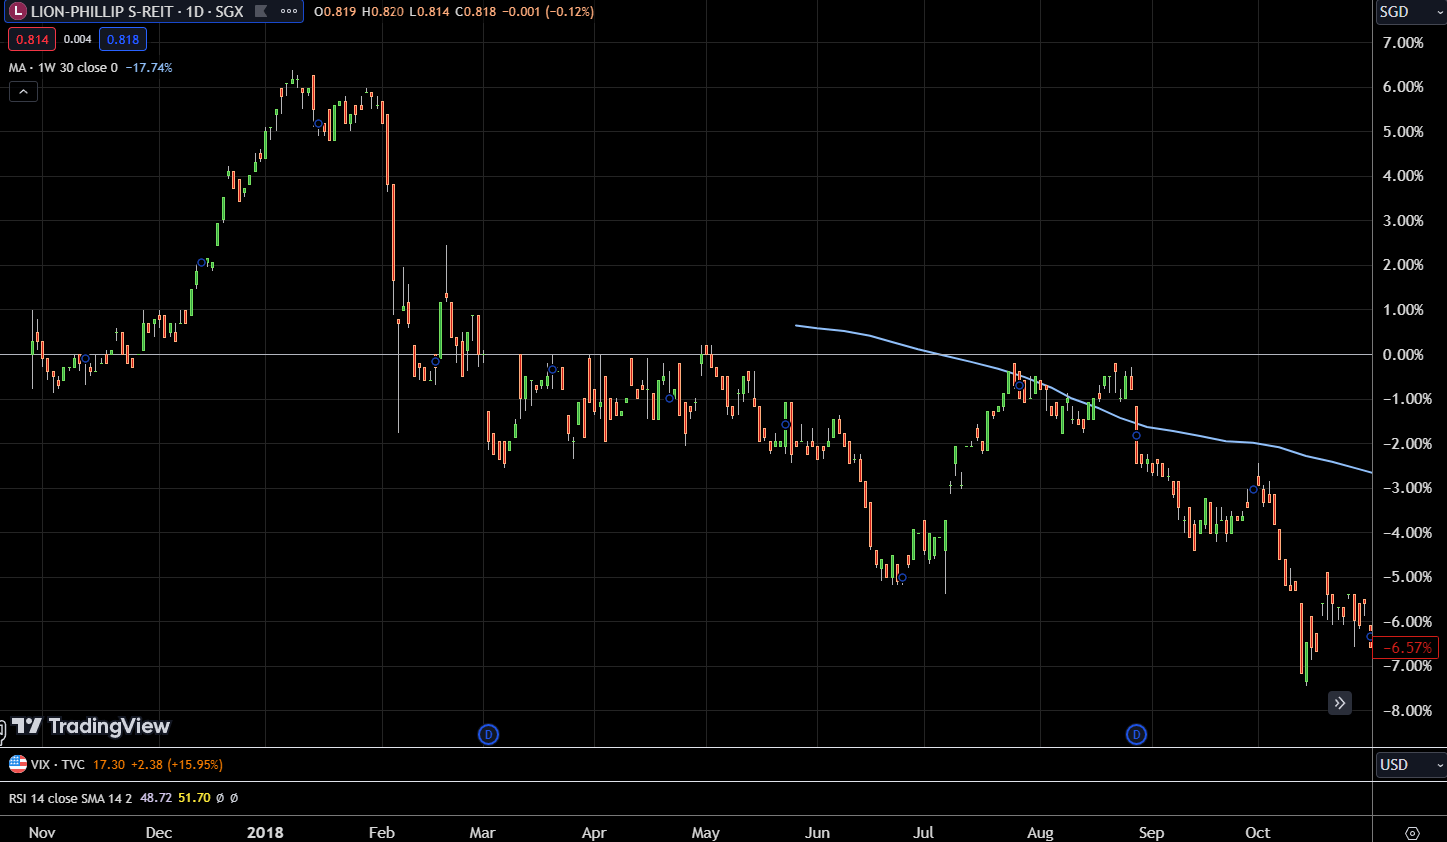
LionGlobal released a very popular Singapore REIT ETF in 2018 and this is the performance for the first year:
Think people need to calm down and evaluate:
- What is this investment instrument investing in?
- Do you understand it?
- What is your own investment time horizon? This is after all an equity index and if you invest less than 15 years, there may be losses. Do you need the capital within this time frame? Can you overbuffer your investments?
Serious investors who wish to consider should go through the link above, you can go to the main page and get the Product Highlight Sheet and Prospectus and read it.
Here are some notable things I picked up:
- The ETF replicates the performance of an index.
- The fund adopts a direct physical replication strategy which means they do hold the actual physical shares instead of synthetically replicating the index.
- The index will be reviewed semi-annually in March and September.
- Index is weighted based on Capped Free-Float market capitalisation.
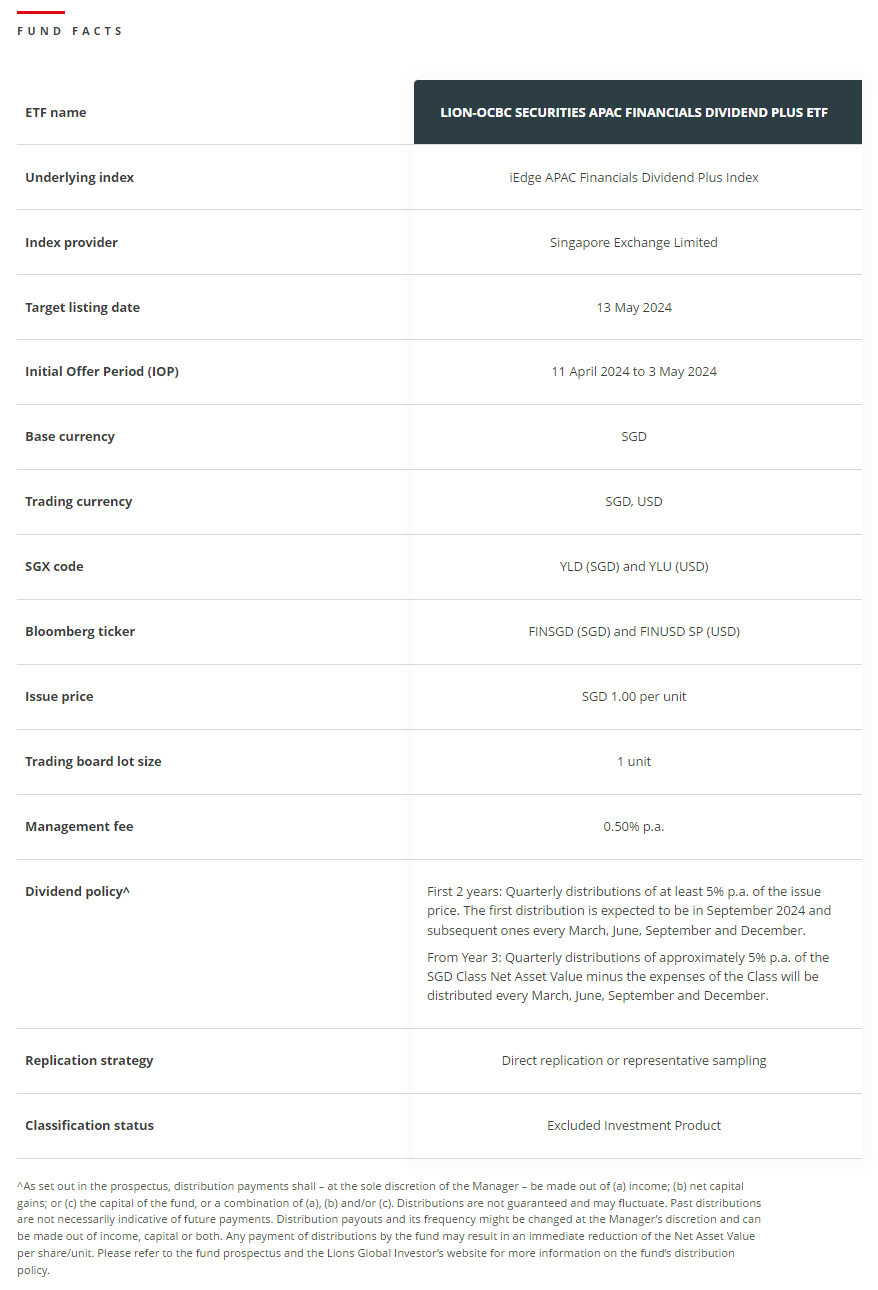
- The management fee is 0.50% p.a.
- There are two trading currency in Singapore dollars and US dollar.
- Distributions made to of the fund enjoys the Section 13D Scheme and will be exempted from Singapore tax in the hand of investors. Singapore currently do not impose tax on capital gains.
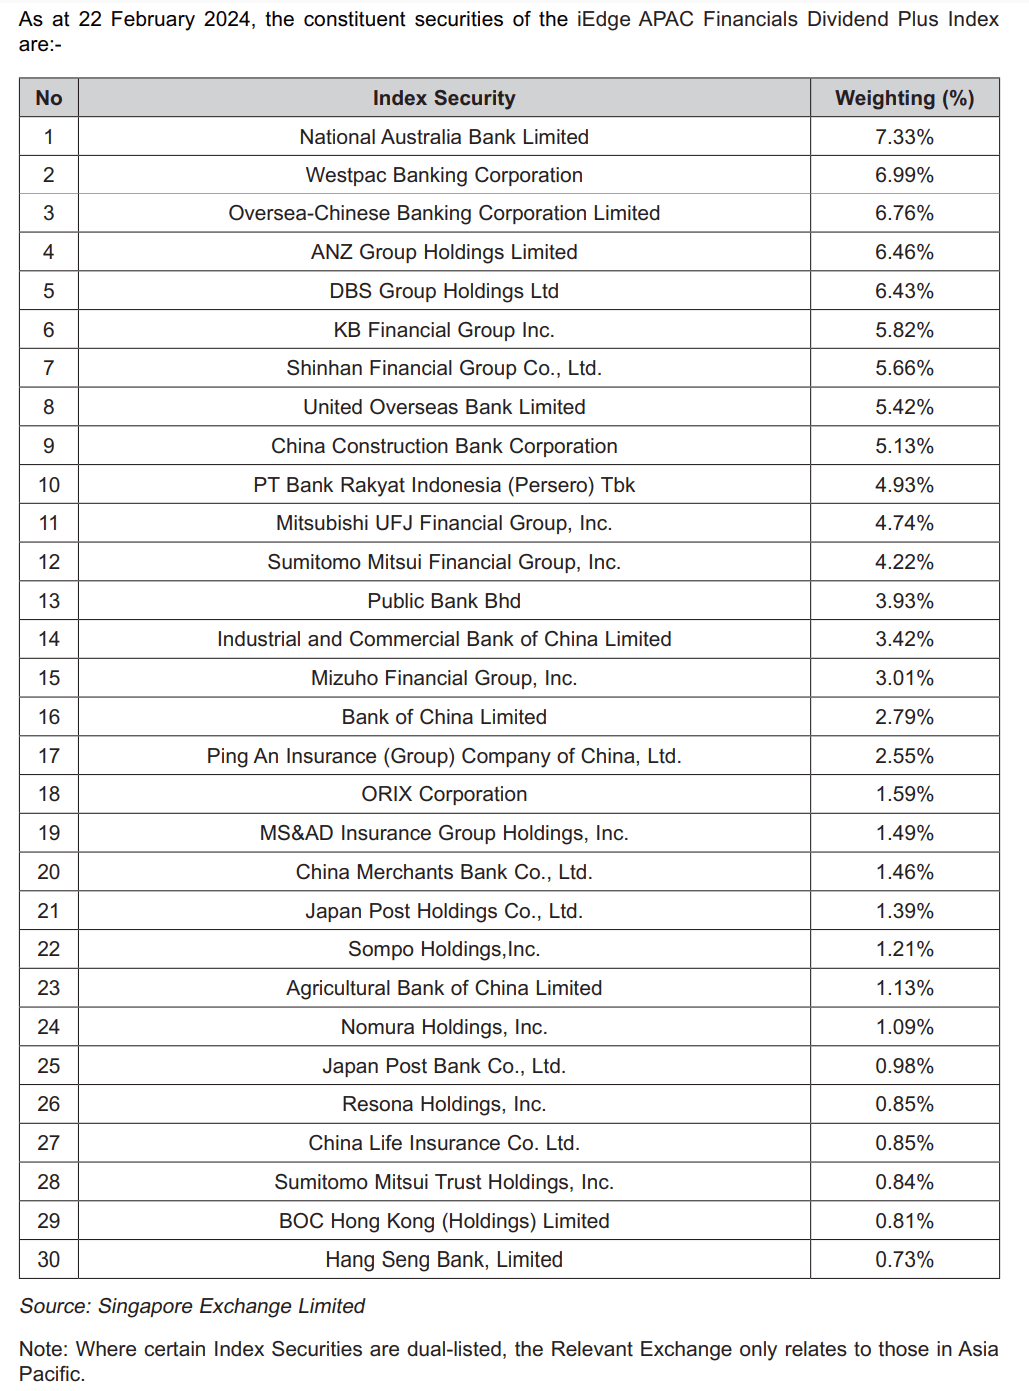
- In the index, there are 30 components. Check the images below.
- The “universe” that the components of the index can come from is Asia Pacific. It has this values-based screen that excludes companies dealing with alcohol, defense weapons, drugs, gambling and tobacco.
- Eligible stocks need to have a minimum daily traded velocity of 0.10%
- Eligible stocks need to have a dividend payout ratio between 0 and 1 (that basically means 0% payout also can consider???)
- The index may add a new stock in and one of the criteria is that the stock need to have a 2-year average dividend yield of 3.5%.
- To remain on the index, the index components need to have a minimum 2-year average dividend yield of 3.0%.
- Each stock is capped to less than 7% (not sure why National Australia Bank Limited is more than that but there must be some logical explanation).
- Each country weight is capped to 20%.
- There is a maximum cap of 5% to Indonesian stocks (very specific!)
Here are more info officially.
Here are the components:
If there is one big takeaway from this is that:
Don’t assume there is a dividend policy to payout 5% of the NAV or minimum 5% as dividend per year. This is not stated in the prospectus. The minimum average dividend yield is 3-3.5% and if you need this as part of your financial plan, you should work with a lower number (if you are those zealots who don’t wish to spend any single dollar of your capital).
How are the Historical Performance of the Financial Sector Versus the Total Market?
The history of stock market data allow us to imagine:
If this APAC Financial Dividends ETF were to be listed like 20 years ago, and I get a chance to invest at any point, how would my returns be like?
Unfortunately, I don’t have the data for an index of financial stocks in the Asia Pacific region. However, I do have about 20-years’ worth of MSCI World Financial Index and Emerging Markets Financial Index data from Oct 2004 till March 2024.
Banks around the world are not equal but they do have similar characteristics, have similar pros and cons as well. Most of them do pay dividends, just whether it is more than 3% on average.
The APAC financial institutions may just rest in between the developed markets and emerging markets.
If you have invested $1 million in a MSCI Emerging Market Financials Index vs a Cap-weighted Emerging Market Index, your performance will look like this:
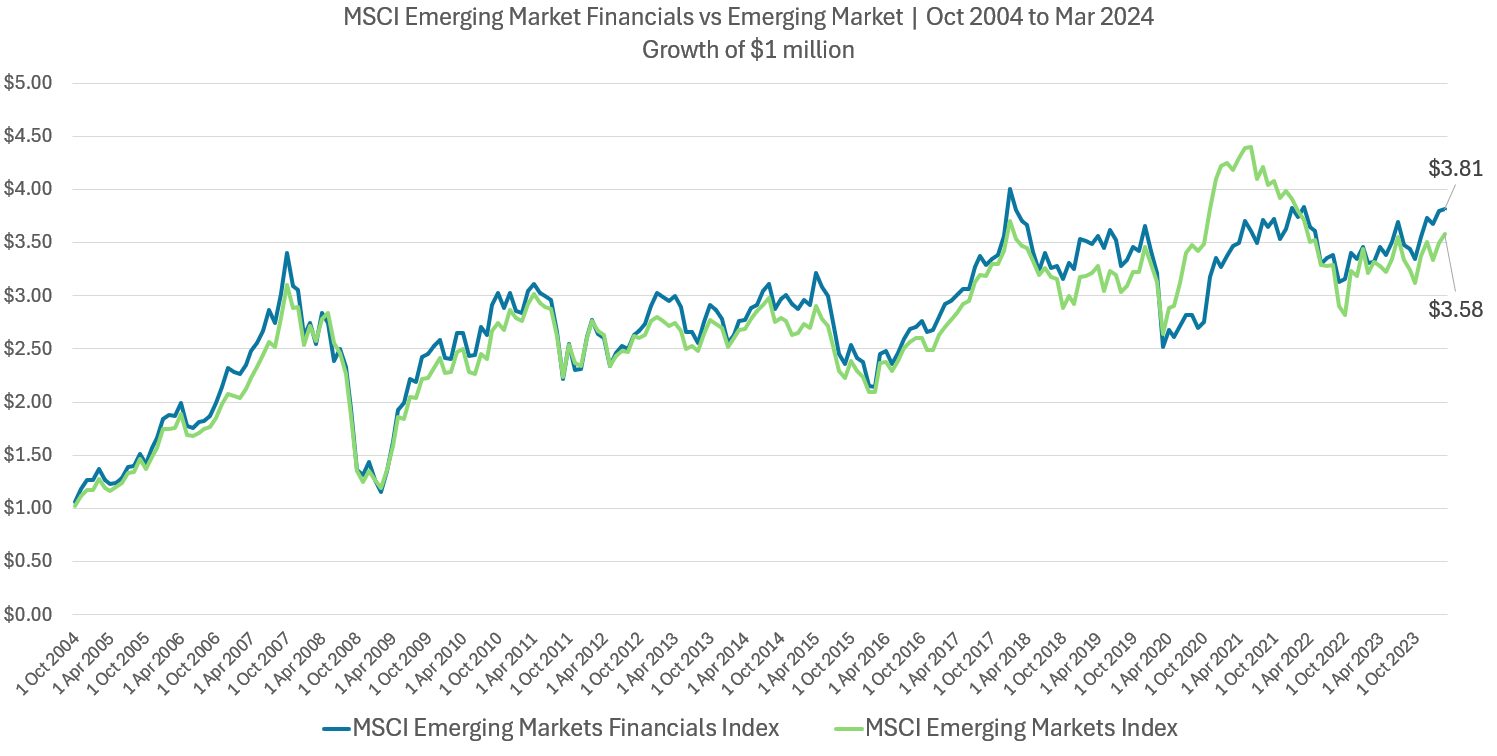
Note that these index is Total Return which means it is both capital gains and dividend returns.
The returns… don’t look too different. That is because in emerging markets, banks are pretty dominant.
What you are getting is not too different from the general index.
The situation is a bit different if we consider the world financials against the world index:
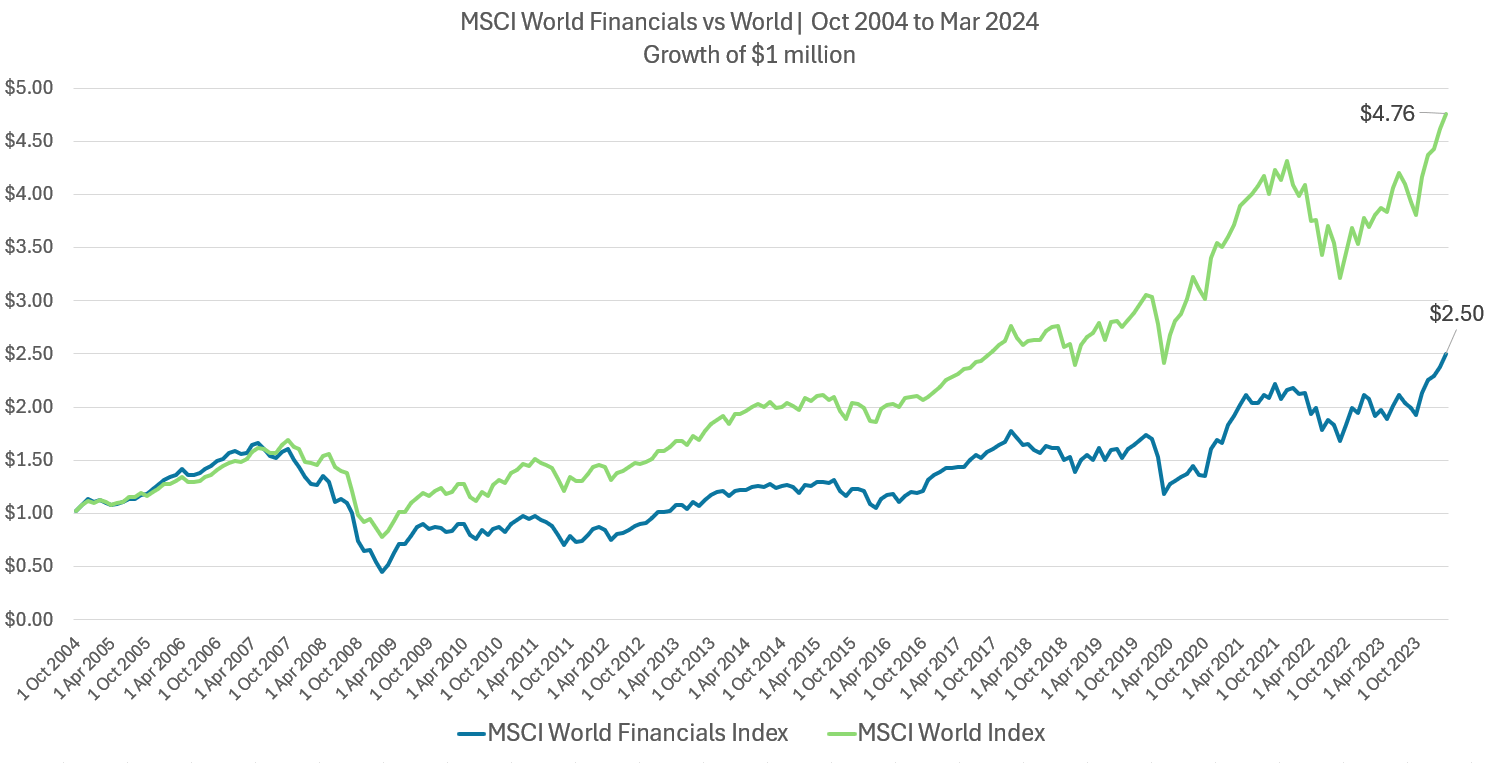
After the Great Financial Crisis, the “nature or beast” of a general MSCI World index is able to focus upon the momentum of the sectors or stocks that does well.
So, we can see a divergence of performance.
In the chart below, I plotted the rolling 5-year annualized return for the MSCI Emerging Market Financials Index against the Emerging Market index:
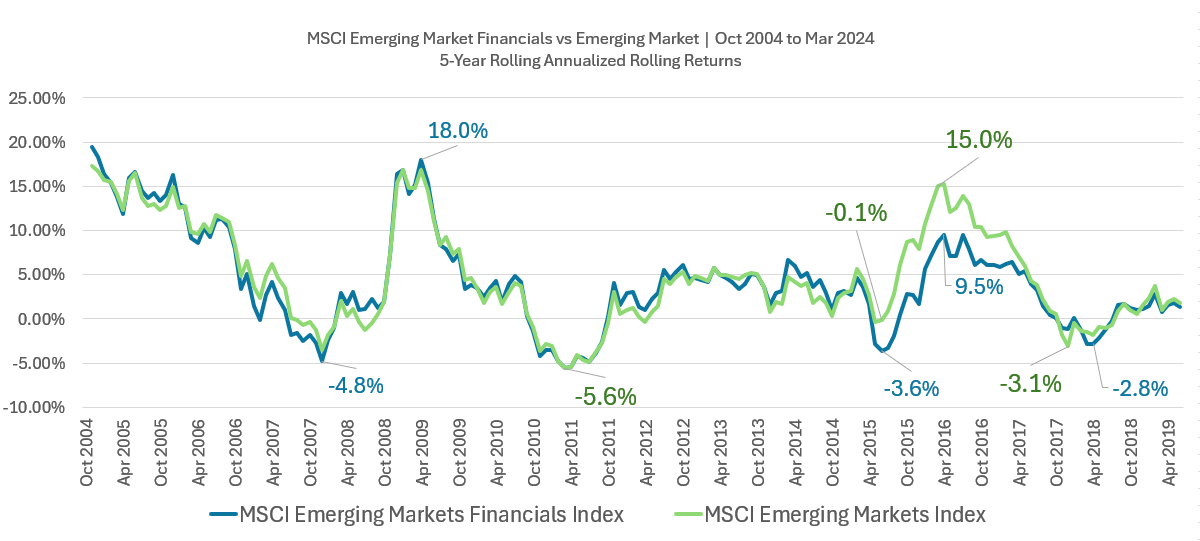
The best way to describe rolling returns is:
Imagine that you can invest all your net wealth then in one lump sum at any point within the past 20 years from Oct 2004 to Apr 2019, and you look at the returns five years later. What kind of returns will you enjoy?
Well, your returns will be a mixed bag, just like the broad index. You may be unlucky to get -4.8% p.a. after 5 years if you invested in Oct 2007 or 15% p.a. if you invested in Apr 2016.
The first principle to take note is: 5 years is a pretty short time to judge performance but to a novice investor, 5 years seems a long time.
Here is the performance of the MSCI World Financial Index against the MSCI World Index:
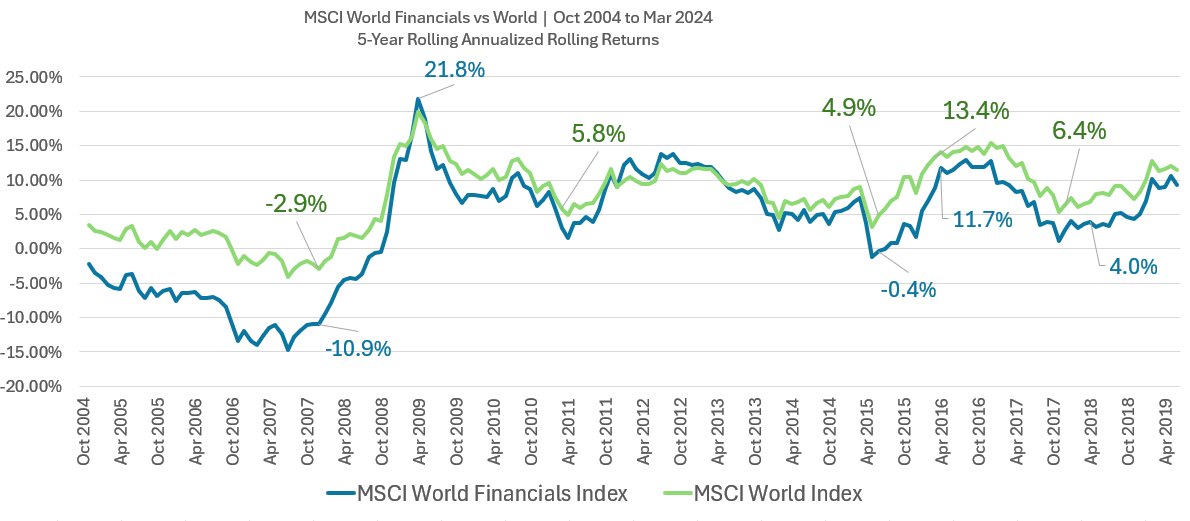
Clearly, over the past twenty years, the financial index have fared poorer than the general index.
I can also view it positively that despite what people say about financials, they are not doing too badly always.
Although, we have those periods where the MSCI World will do 4.9% p.a. if invested in Jun 2015 but if you invested in the financials you would have done -0.4% p.a.
That is a big enough difference in terms of absolute returns.
Returns and Financial Metrics from MSCI Factsheets
While I do not have Asia Pacific Financial Data, we can pick this up by just Googling “MSCI Asia Pacific Financials…” and you would get a PDF factsheet as the first search entry:
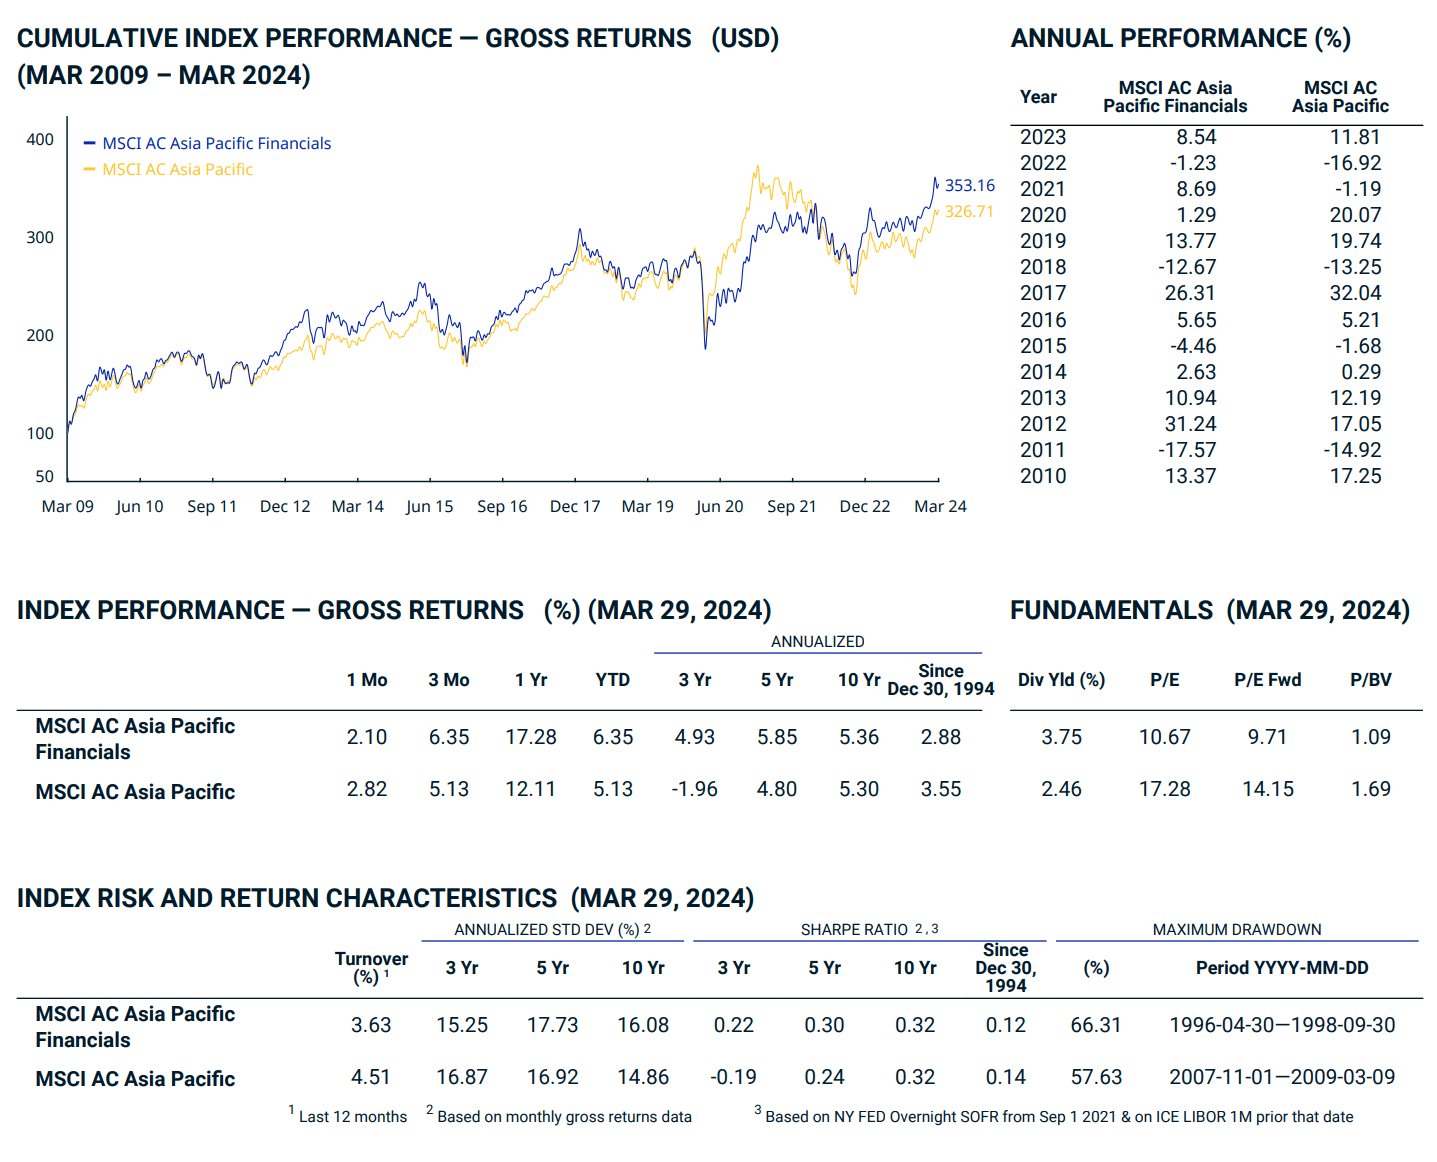
Asia Pacific banks have done well within a 3-year timeframe. The All Country Asia Pacific index did -1.96% p.a. while the financials did 4.9% p.a.
The financials also did better over the last 5 years and 10 years timeframe.
If we extend it to over 30years, then you can see the financials did poorer.
Notice that the average dividend yield of the financials at 3.75%. this would make good comparisons against this ETF.
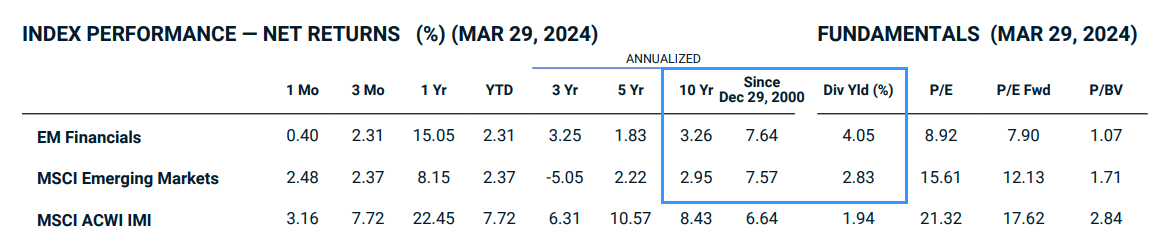
I have provided more returns info for the Emerging markets:
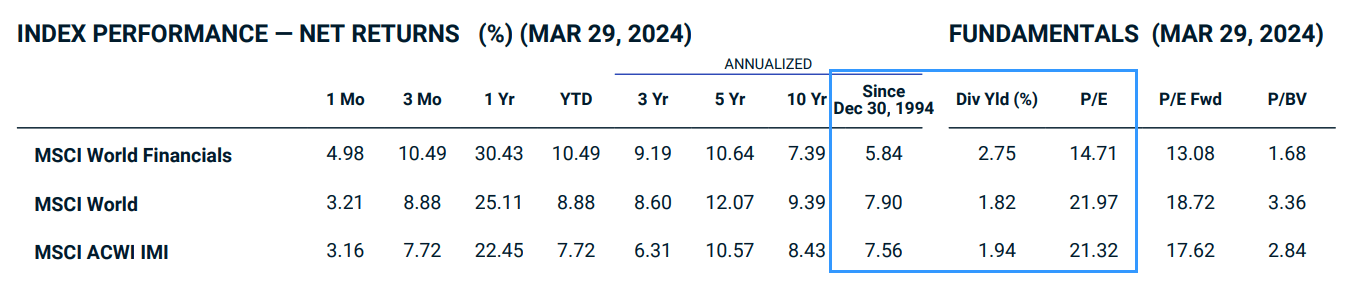
And the world:
Conclusions
The APAC Financials Dividend Plus ETF is an ETF that is rather specific:
- Gives you exposure to the risks of financial companies only.
- Gives you exposure to the risk of value and dividends.
- Gives you exposure to the risks of Asia Pacific.
As an investor, there are the “big rocks” that you need to think about putting into the jar first before even thinking about buying this ETF:
- What is my financial plan or which goals am I attempting to satisfy with this ETF? (Do you have a plan in the first place?)
- Does this ETF fit my investment philosophy? (Do you have one in the first place?)
- What is my risk capacity (how long do you have until you need the money)?
- What is my risk tolerance (can you take volatility, or if you look at the rolling return chart, five years return -10.9% a year. Can you take it)?
Ask these questions, which I laid out in order of priority.
Then when looking at investments:
- Is this ETF for speculation or for tactical allocation?
- Do I want this in my strategic portfolio allocation?
- How much should I allocate to this? Or rather, how much DON’T I want to allocate to?
- Am I missing out on something else by being this narrow?
End of the day, the history of the returns of financials against other sectors show that we are basically investing in a sector and a large part of the returns are driven by the life and death of the sector.
It can be good but it can be bad as well.
Financials is a very old industry, and so I won’t expect the future to look too different than in the past.
And that data can help you make some of your decisions.
If you want to trade these stocks I mentioned, you can open an account with Interactive Brokers. Interactive Brokers is the leading low-cost and efficient broker I use and trust to invest & trade my holdings in Singapore, the United States, London Stock Exchange and Hong Kong Stock Exchange. They allow you to trade stocks, ETFs, options, futures, forex, bonds and funds worldwide from a single integrated account.
You can read more about my thoughts about Interactive Brokers in this Interactive Brokers Deep Dive Series, starting with how to create & fund your Interactive Brokers account easily.
Kyith is the Owner and Sole Writer behind Investment Moats. Readers tune in to Investment Moats to learn and build stronger, firmer wealth foundations, how to have a Passive investment strategy, know more about investing in REITs and the nuts and bolts of Active Investing.
Readers also follow Kyith to learn how to plan well for Financial Security and Financial Independence.
Kyith worked as an IT operations engineer from 2004 to 2019. Currently, he works as a Senior Solutions Specialist in Insurance Start-up Havend. All opinions on Investment Moats are his own and does not represent the views of Providend.
You can view Kyith's current portfolio here, which uses his Free Google Stock Portfolio Tracker.
His investment broker of choice is Interactive Brokers, which allows him to invest in securities from different exchanges all over the world, at very low commission rates, without custodian fees, near spot currency rates.
You can read more about Kyith here.
- The Cheapest Way to Extend Your Laptop to TWODisplay that I Can Find. - April 29, 2024
- My Quick Thoughts on the Net Cash, 4% Yielding Boustead. - April 28, 2024
- My Dividend Experience Investing in UCITS iShares iBond Maturing in 2028. - April 23, 2024