I thought I would put out a short piece on valuation.
In this world, you are always trying to understand the intrinsic value of something versus what you would pay for it.
Whether you are a buyer, seller or someone holding on to an asset, you want to know what is something worth.
- The buyer wants to pay as low as possible, so that he has enough margin of safety such that his purchase will work out
- The seller wants to charge as high as possible, so that he can gain in excess of what he thinks his company is worth
- The holder wishes to know that the value of his business is still greater than what people are willing to pay for it now
This article will try to go through what I understand about the art of valuation. I try to minimize too much crap talk but if there are some areas that you think I did not explain well, do put them in the comment below.
What is Intrinsic Value?
The goal of valuation is to understand what you have, or what you think of buying and get to know what it is worth.
Imagine there is this magical number that tells you the true value of an investment.
Valuation is the goal of finding out this magic number.
If you know this magic number, you can then look at the price people are selling to you at or what people are willing to pay for, and make a decision upon it.
Knowing the Quality of the Asset/Business is a Vital Part of Valuation
We can start by going through whether it is better to use discounted cash flow, dividend growth model, price earnings ratio or EV/EBITDA.
However, the most important part to get right is the level of quality of the business. This is perhaps why you would hear fund managers say: “While the price we pay is not cheap, we are purchasing a quality business.”
High quality business is hard to come by. There may be more medicore and poor quality businesses around.
If you have a high-quality business you can pay a reasonable price for it. This is because a high-quality business either has a high future cash flow growth rate or that the future cash flow is so well protected that it lasts for longer than other businesses.
If the price you pay very low, relative to the intrinsic value, then you have an absolute bargain.
If the business is of mediocre or low quality, then to gain a good margin of safety, you have to ensure that you only purchase it below it’s intrinisc value.
If not, you can only depend on hope that someone guillible comes along and buy it from you.
How do you assess Quality?
Assessment of quality is a combination of quantitiative and qualitative analysis.
- Quantitative: Assessing the financial data and industry metrics
- Qualitative: Assessing its business, management, competitive forces
This means that you need two different skillset.
This is where the majority of where the job needs to be carried out.
The better you do the job, you will come closer to the true nature of the business.
Once you know the true nature of the business, then you may be disgusted with it or realize you discovered something great.
If I am not good at this… I would assess that a mediocre business as great, or a great business as mediocre.
This is one of the reason someone would be selling while others are buying.
The Cheat Sheet
I will probably go through different valuation models in this article.
For those who are just getting acquainted with this, it might be a bit hard to relate to. So maybe it is a good idea for me to give some guidance which model to use for what type of business:
- Property: Total return: CAP Rate + Capital Appreciation over the long run, XIRR
- Businesses that have seemingly consistent or recurring cash flow: PE, DCF, Reverse DCF, EV/EBITDA, EV/EBIT
- Same as #2 but with more debt: EV/EBITDA, EV/EBIT
- Business whose operating a business is not the focus but have a rich balance sheet: Price-to-book, sum-of-the-parts
- Software as a service business with earnings: PE, EV/EBITDA, EV/EBIT, DCF, Rule of 40
- Software as a service with no earnings: PTS, Rule of 40
- REIT: free cash flow yield and dividend yield, price to book
- Recovering business: Price-to-sales, PE using conservative recovery earnings
- Insurance companies: Price-to-embedded value, Price-to-book value
- Cyclical companies: Difficult… case by case basis. May use different methods
- Lumpy earnings like property developer: PE factoring a short period of high growth rate
- Matured business with recurring earnings: PE, EV/EBITDA, DCF
- Conglomerates: Sum-of-the-parts
Using Price Earnings Ratio or Earnings Yield to Value Businesses
Out of all the valuation metrics, Price earnings ratio or PE ratio is one of the easiest.
You would just need to get the price of the stock and the earnings per share, then divide the price of the stock by the earnings per share, and you have the PE ratio.
If you invert the PE ratio, you will get the earnings yield.
For example, if the price of a stock is $20 and the earnings per share is $1, the PE is $20/$1 = 20 times.
If you invert it (1 divide by 20), you will get 0.05 or 5%.
PE or Earnings yield is better?
We cannot say whether one is better than the other.
Having both allows you to compare the business in different ways.
A 5% earnings yield allows you to compare this business against other competing financial assets. You can compare against the 10-year bond yield of 0.6% or a REIT with an earnings yield of 6%. You could also compare the business to a property with a net rental yield of 2.5%.
With an earnings yield, you can compare against businesses in the same industry. Competitor A could have an earnings yield of 5.3% while competitor B has an earnings yield of 7%. Competitor B looks attractive price-wise (not sure about the quality).
The issue is in the financial world, people compare valuation based on PE more.
You can use PE to compare against listed and non-listed business.
However, PE is better for the business whose earnings are recurring in nature. If the business is cyclical, then the PE of the company will go through “emotional mood swing” kind of fluctuations.
Using PE to Measure against the Risk-free Rate
PE or earnings yield is quite useless unless you know the quality or lack of quality of the business.
Suppose you have a golden goose that lays a golden egg a year that you can sell for $1000 and a normal goose that lays a normal egg a year that you sell for $0.20. The golden goose cost you $20,000 and the normal goose cost you $5.
The PE for the golden goose is 20 times and the PE for the normal goose is 25 times.
Which is a better investment?
The answer may be none. How long can a goose survive for? Can the goose even survive for 10 years?
Valuation have to be in relation to the thing you are assessing.
A PE of 25 times for a business used to be expensive. If you invert that, the earnings yield is 4%.
However, we have to compare against other competing financial assets.
The risk free rate or the 10-year government bond rate is 0.6%. This used to be closer to 4%.
If you compare the risk-free government bond at 4% versus a business that has an earnings yield of 4%, the business might look expensive.
The risk premium (the earnings yield minus the risk-free rate) is 0%. There is no risk premium which indicates the market is pricing in zero risks in the investment. This likely is not the case. The asset might be overvalued, unless the company can grow at some great growth rate.
But if the earnings yield is 4% and the risk-free is 0.6%, the risk premium is 3.4%. There may be value there.
Using PE to Measure against Other Businesses
The price earnings may be better to compare against peers or other companies you wish to invest in.
If you have only $10,000 and can only put into something, which business would be better?
A PE of 30 times, by historical standards may look expensive. If you have another business in the same industry that trades at a PE of 15 times, the latter looks like a bargain.
However, the quality of the former may be better than the latter. The former may be dominant in the industry, continue to be dominant. The latter may be facing competitive headwinds, losing its edge.
The difference here is that the high PE business may last for 20 years in the business while the low PE business may only last for 5 years.
If you view it from this lens, you might wish to pay up more for the business with 30 times PE.
In general, to make things simple, you can frame quality down to two metrics:
- The length of time the business can keep going, maintain its competitive position. The longer it can, the higher PE is reasonable.
- The growth rate of its cash flow. How long can they maintain a high growth rate. The higher the growth rate and if they can maintain that high growth rate, a higher PE is reasonable.
The current example explains #1 more.
Let us consider the growth rate when valuing using PE.
Relating PE and Growth Rate Together
From “Using PE to Measure against the Risk-free Rate” and “Using PE to Measure against Other Businesses”, we sort of know that there is a reasonable price to pay for a certain quality of business.
The first thing is that you need to determine what is this.
Suppose the business quality is high enough. Based on the risk-free rate, you might think that if the business do not growth its cash flow, a reasonable or fair PE is 25 times.
You would pay 25 times for this business.
If you can get it for 20 times it is even better.
But currently this business trades at 100 times PE. 100 times PE would look absurd. However, if the earnings can grow 50% for three years, buying th ebusiness at 100 times PE may not be so absurd.
Let us go through an example.
A Super High Growth Business with a Competitive Edge
100 times PE would mean you pay $100 for a business with $1 in earnings.
- The first year, the earnings grow 50% to $1.50
- The second year, the earnings grow 50% to $2.25
- The third year, the earnings grow 50% to $3.38
If you purchase the investment today at $100, 3 years from now the PE, based on the future earnings of $3.38 will be 29.5 times.
29.5 times may not be close to the fair value of 25 times we are willing to pay if the business does not have much growth. However, what is the chance that a business that grew 50% for three years cannot grow at 10% for the next 10 years?
Paying $100 for a business that eventually would trade at 29 times PE three years from now, and still have very good quality may be very reasonable.
A High Quality Business Trading at a High Multiple
A less bombastic example would be an investment that trades at $35 with earnings per share of $1. This gives it a PE of 35 times.
You have assessed that based on the business quality, 25 times PE is pretty fair to pay for the investment.
You have seen the business delivering 15% earnings growth for the past 7 years.
Let us be conservative.
Can the business deliver earnings growth of 10% for the next 3 years then grow at a terminal growth rate of 3%?
- First year earnings: $1.10
- Second year earnings: $1.21
- Third year earnings: $1.33
Three years from now, at your purchase of $35, the PE would be 26 times.
You are essentially paying for a better cash flow in the future, today.
Your margin of safety would be:
- Your understanding of the quality of the business
- Assuming that the high growth rate will only grow at a lower and shorter amount
You would have overpaid if #1 and #2 are untrue.
A Mediocre Company at a Reasonable Multiple
In the last example here, we have a business that trades at $15 who earns $1. This gives the investment a PE of 15 times.
You would have to do your work assess the quality of the business. Suppose you have asesssed that you cannot tell for certain if the company can buffer itself well against competition, or that you seen that at times the earnings can fall off the cliff, you might want to err on the safe side.
You cannot tell for certain that the growth rate would be consistently 3% a year or how long it would be.
You would choose to value this business as if it does not grow at all. At 15 times or 6.66% earnings yield, this might be a fair value to pay.
But to be safe, you might wish for a greater margin of safety to grab it at a lower PE.
Your margin of safety would be
- A seemingly undervalued price
- Assuming zero growth
Can We Use EV/EBTIDA to Value Companies instead?
Yes you can.
In fact, using EV or enterprise value is better as in it factors in debt and takes out the cash.
What you need to be aware of is that EBITDA does not factor in depreciation, taxes, and interest payment.
Compare a companies EV/EBITDA against a group of similar quality companies’ EV/EBITDA to assess whether it is undervalued.
Just don’t compare the inverted EV/EBITDA against say properties net rental yield or something because when you do not factor in depreciation and amortizaiton, it is like valuing a business that you are not sure how long it will last.
A better measure may be EV/EBIT.
You can use that in a similar way.
- Assess the quality of the business
- The duration and magnitude of growth
- What is a reasonable stable state EV/EBIT that it should trade at
Can We Use Dividend Yield in Valuation?
Dividend yield used to be the original value investing measurement.
However, in recent times, it has lost its appeal.
I still think you can use dividend yield to value business.
You can use dividend yield to compare against:
- Same industry peers
- Companies that are in the same dynamics
- Compare the attractiveness versus itself at different points in history
Dividend yield may be more suited to value businesses in industry where the dividend payout ratio tends to be high such as utilities, property companies, REITs.
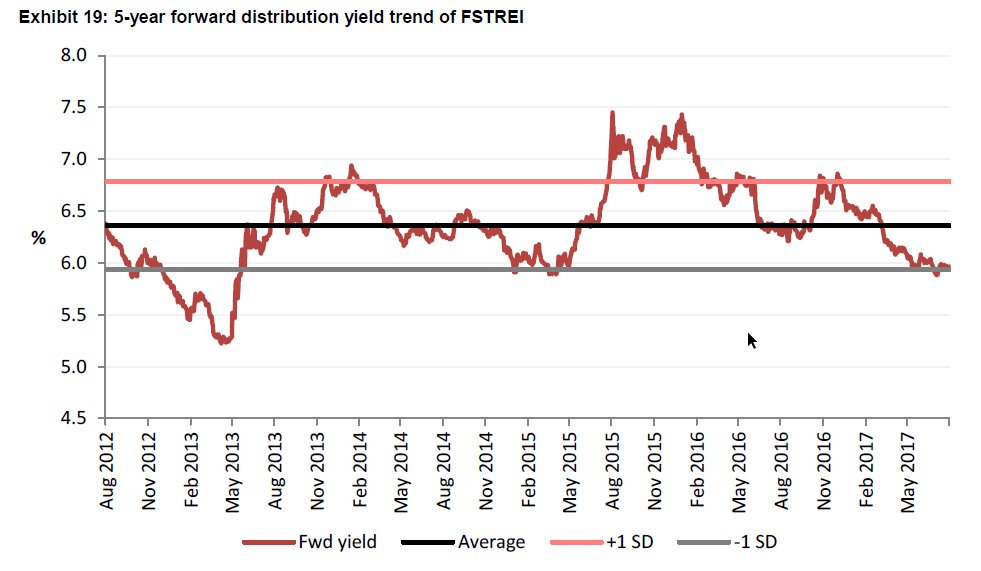
For example, you may see this kind of dividend yield chart in analyst reports. In this case, it shows the dividend yield of the Singapore REIT index from 2012 to 2017.
You would be able to assess whether the current dividend yield is high or low, relative to history.
This kind of analysis works because for an industry like this, the dynamics do not change a lot. It is a cyclical industry that is prone to swings between high supply to low supply, high demand to low demand, euphoria, and pessimism.
Over time, I tend to ask people to focus on using earnings yield or free cash flow yield.
This is because some companies may pay out more out of their earnings as dividends, some companies less.
How do you do a like-for-like comparison between two investments?
It is tough. You might as well value based on the thing that dictate everything: earnings or free cash flow.
Earnings per share or Net Income?
Another reason dividend yield is not very favored is because more and more, due to the shift in taxation rules, companies in the United States and some other countries favor stock buybacks.
When a company buy back their shares, their amount of outstanding shares get reduced.
For example a company earns $100 in a year and they have 100 shares outstanding. Their earnings per share is $1.
If the company bought back 10% of the shares within 3 years, the number of share fall from 100 to 90.
If the income remains the same as $100, the earnings per share becomes $1.11.
Just by doing a share buy back the earnings per share get boosted by 11%.
If you use dividend yield, you would have missed out on that management is value adding by buying back shares.
The next question you would ask would be: Do we use the net income or earnings per share?
Earnings per share would show the effect of buying back shares, but sometimes you would want to know whether a company is boosting it’s share price through crazy buy back.
A lot of the companies in US are doing that. If they are not buying back shares, they are doing something not right.
But you could also argue, this is financial engineering, and this is what may have gotten so many of these companies into trouble during COVID-19.
I would tell you… compute both market capitalization divide by net income or free cash flow and price per share divide by earnings per share or free cash flow per share.
The goal here is to appreciate the company for what it is. If you look at these two over 10 years, you can tell if they are doing this.
IBM was the classic case study of a business that stopped growing but due to its share buyback, the earnings per share keep growing.
Eventually, the business not growing became a bigger problem.
In this Covid-19 period Apple share price did very well, but their income growth was satisfying but not spectacular. What boosted Apple’s share price was the buyback, which boosted the earnings per share.
Apple may be a different situation compare to IBM because the quality of their business is still good.
But having an appreciation of both PE based on EPS and net income would give you an idea whether to go through with this investment or not.
Price-to-Sales (PTS) – Valuing Business with No Visible Earnings
Price-to-Sales gotten popular in recent years because technology companies are in vogue.
Majority of these technology companies reinvested whatever they earn to boost market share. The greater the market share garnered the greater the network effect, or economies of scale and scope.
They also reinvest in research and development and so the more they put the distance betweent themselves and their competitors, the more valuable they get.
Due to that, usually they are like loss-making.
Price-to-sales is the popular way and the way it is used is something like PE or EV/EBITDA.
You compute the price-to-sales by dividing the price by the revenue.
Some of the PTS can be a bit crazy like 10 times, 25 or 33 times PTS.
But like my explanation for PE, you have to relate it to the growth rate. If a business have a PTS of 30 times but in the next 2 years the revenue growth is 200% (ask yourself if this is possible at all), then a 30 times PTS becomes 10 times in 2 years.
PTS suffers from the same issue with PE: You need to know what is reasonable to compare against.
My problem with PTS is that unlike PE, there isn’t a competing asset or historical PTS that you can use to compare against.
Aside from that PTS is useful for determining if a company that became loss-making has turned around.
The Rule of 40
One of the recent arcane art introduced to us in this tech craze is the rule of 40.
The rule states that if a company can achieve year-over-year revenue growth plus profitability margin that equals 40% or more, this is a company that is reasonable to invest in.
The rule of 40 is specific for software-as-a-service (SAAS) businesses because their business is highly recurring.
Customers either pay a monthly or yearly subscription per user, or based on volumes of transaction.
The unit economics of the business dictate that a company may be better off spending ahead of the curve (the same reason as I shared in the PTS section above). They would also need capital to be available (which is available now with low interest rates).
However, at some point, these businesses will need to translate to actual profit and loss.
How do you resolve between loss-making to build their edge versus becoming profitable?
This is where the rule of 40 comes into the picture. If you are a business that do not have profitability, to be a reasonable investment, you have to grow very, very well.
If you slow down your growth, you got to make sure that your free cash flow or adjusted earnings margin shows that you have a moat or competitive advantage.
A business with a high free cash flow or earnings margin is an indicator that the business have some pricing power.
Hence it is to aggregate business who are either fast growing or have developed their edge.
Discounted Cash Flow (DCF) Model
If you go into any finance course they will teach you this valuation model call discounted cash flow model.
The discounted cash flow model calculates the intrinsic value of a company based on the discount of its aggregated future cash flow.
A business’s value is made up of what the business can earn in the future.
What it earns in the future is a stream of cash flow. This cash flow grows at a certain rate. In some years they might grow more, in some years it might not grow.
Businesses can grow at different rates.
Suppose you have a company that could grow 25% for 4 years, then maybe you believe growth will slow down to 12% for the next 10 years and then it will slow down to a terminal growth rate based on GDP growth.

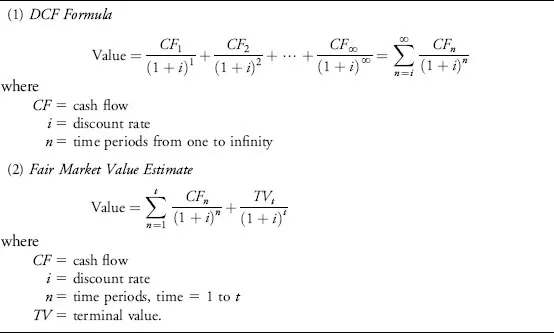
This can be reprsented in the DCF Formula above. The cash flow can be free cash flow or earnings. That is divided by a discount rate.
The discount rate is like an interest rate or hurdle rate that makes it worthwhile for you to invest your money in this business.
As you are risking your money in this business, as oppose to putting your money in a risk-free investment like a 10-year government bond, you demand a respectable return for it.
The cash flow on the denominator can grow at a certain rate like 25% for 3 years, then 12% for 10 years follow by 2% forever.
How I use DCF
I used to do a lot of DCF in the past. What I would do is use #2 the Fair Market Value estimate.
I would compute how the cash flow will grow for the first 10 or x number of years. How long I will use depends on the nature of the business.
For business that we do not know if it will last, we tend to use 3 years. You cannot see things longer than that.
For companies that have been operating for a while like a telecom business, we can use like 20 years.
After assessing the business, I will typically have an idea of the nature of the growth. It could be 5% for a long time, or very uneven growth rate.
I would then assign a growth rate to the cash flow.
The second part would be the terminal value. This would be the aggregate of its future cashflow at a terminal growth rate. The terminal growth rate could be 0% , 1%, 2% or 3% depending on the situaiton.
In summary, a period of high or possibly hopeful growth + a period of terminal growth.
What Discount Rate to Use?
Finance text book will tell you the discount rate would be the weighted average cost of capital to use. This would be the hurdle cost of the company.
In any case, the discount rate is a subject of many debate.
The way I look at it is: What would be a good rate of return to compensate me to put my money in this investment?
The more risky or uncertain the business or if there are more things I do not know about the company, I would use a higher discount rate.
Generally:
- High risk: 12%
- Normal: 10%
- Low risk: 8%
These are rule of thumb I learn from a Bruce Greenwald. I think if you can earn something higher than 10% a year it is pretty good.
Should you modify this in this low rate environment? I think you should.
How low? I have no idea. Having a high discount rate stops you from buying a lot of the investment because many would not past this intrinsic value test.
But we have to be realistic. Perhaps lower it to
- High risk: 9%
- Normal: 7%
- Low risk: 5%
Why don’t I use DCF nowadays?
I do not use it nowadays because I believe valuation shifts.
And also I believe that intrinsic value is not a number. The value changes all the time. Using DCF requires you to assume that this business grows at a terminal growth rate of X%, current growth rate of Y% and a discounted rate of Z%.
Too much assumptions.
What is DCF Suitable For?
I think DCF is suitable for business with recurring cash flows
What I still use – Reverse DCF
While I seldom use DCF, sometimes I do still use the reverse of DCF when assessing some business.
Reverse DCF means:
- I assume today’s price is the intrinic value. The market is efficient
- I input the current cash flow
- I assume different profile of cash flow growth rates
What I want to determine is that at today’s price, what is the discount rate.
I would assess if this discount rate is a good “interest rate” in this environment.
This is probably a good way to assess Cross Harbour’s (HK:0032) value. The bulk of Cross Harbour’s business lies in the ticketing revenue of the Western Tunnel, and that tunnel’s concession is ending soon. You can compute based on the current profit, and a conservative growth, over this finite term, what is the discount rate.
The last time I compute that figure, if you net off the cash on the balance sheet, is north of 10%.
That is a pretty good return for that business. Especially when it may be so hard to find competing assets yielding a cash flow as high as 10%.
Reverse DCF is equal to XIRR or Internal Rate of Return.
Your margin of safety would be how conservative your growth profile is.
As you can see, the assumptions are reduced to just one, the growth rate.
The Intrinsic Value of an Investment Will Keep Shifting
A novice mistake that I observed (but a necessary one) is that we think once you compute a PE, that PE does not change.
PE is made up of price and earnings.
The price changes because it is affected by
- The psychology of the general market
- The psychology of the people holding the stock
- The fundamentals of the business
The earnings changes because
- Earnings are affected by externalities
- Earnings is affected by business dynamics (what your competitor does, what your supplier and buyer does, what your management does)
If both of these changes, the PE changes.
The intrinsic value does not stay static.
What this means that a business with low intrinsic value would shift to a higher intrinisc value and a business with high intrinisc value may degrade.
The Danger of Having Growth as a Valuation Input
In many of these valuation models, you would notice that the growth rate is a big input.
The thing about growth rate is that…. it is less certain. In the COVID-19 age, you get some of these business with crazy high growth rate.
However, if you take out this period, traditionally, the level of growth is uncertain.
And so in traditional value investing, they tend to err on the safe side. Either they assume growth will only take place for just a few years and then it will taper off.
Or that they assume zero or 3% growth rate indefinitely.
If you bake in a lot of growth into your valuation model, do be careful if the growth rate does not lived up to expectation.
During recent earnings result, we can observe that there are some business with great growth rate. These justify high price-to-sales ratio.
However, when they give some guidance that the future growth might be more moderate, the share price took a massive hit.
This is because current price baked in a lot of growth expectations.
If for a period, the growth does not live up to expectations, the share price will get punished.
If this is just one year, that is a buying opportunity.
However, if this is the start of the business losing their edge, you will be paying for something real expensive.
This is perhaps why, even in the growth baked into the PE model, we try not to project too long out. The margin of safety would be partly in being conservative in the duration of high growth.
Qualitative Versus Quantitative Analysis – Which is more Important?
You need to have both.
Professor Damodaran have a pretty good analogy to how we should look at this:
- The qualitative part of the analysis lets you float into the air
- The quantitative part of the analysis keeps you grounded
If you have only one, you either float too high or be so grounded you won’t make a move.
So both are important.
Overtime, I feel that I may respect the qualitative part more because it determines more things.
However, eventually, the numbers must show performance.
How Important is the Risk-Free Rate in Valuation?
It is important enough.
The risk-free rate dictates two things:
- The cost of borrowing
- The risk-free rate is a competing asset
If the rate is persistently low like now, cost of borrowing is low and it affects downside risks. We are currently in an unprescedented situation where not many gets hurt by making bad decisions.
A low risk free rate also means that a fair value PE of 20 to 30 times is reasonable.
But all that could change if the risk free rate goes back up to 4%.
If the risk-free rate is 4% and your high quality stock is 3% in earnings yield, why would you invest in the stock?
You would probably do it if the growth rate is 5 to 7% a year in the long term. But if your business does not have that growth rate, your stock is going to be punished.
Valuation is Part Science and Part Art
I probably missed out price-to-book and sum-of-the-parts but after 5,000 words in one afternoon, I think I prefer to take a break.
I hope that if there is any takeaway from this article it is that what you use depends very much on the nature of the business.
We start this article off by saying the intrinsic value is a magical number.
I learn that there is no one magical intrinisc value number.
I also learn that you cannot get your assessment of the business exactly correct. For example, how many of you really believe that Amazon or Apple would grow to this size, through these few segments of businesses?
How many would know that the thing that bring down so many retailers was a pandemic?
Even if you believe that this business has potential, what would get them to where they eventually be, might be very far off from their current segment of business.
For example, a business could acquire another business, bolt it on, and that business might be the one which became its main segment 10 years from now.
Because of that, valuation is an art sometimes.
What you can try to do is to work with what you have and try to get reasonably correct. These fundamental valuation models do help in that if you layered them on top of one another, it gives you sense if this business leans closer to overvalued, fair or undervalued.
In the end, it is just a sensing.
You can learn more about active stock investing in my series below.
We talked a fair bit about earnings and cash flow. I have written an article explaining Net Profit, EBITDA, Operating Cash Flow, and Free Cash Flow in detail here. It might be complementary to this article.
I invested in a diversified portfolio of exchange-traded funds (ETF) and stocks listed in the US, Hong Kong and London.
My preferred broker to trade and custodize my investments is Interactive Brokers. Interactive Brokers allow you to trade in the US, UK, Europe, Singapore, Hong Kong and many other markets. Options as well. There are no minimum monthly charges, very low forex fees for currency exchange, very low commissions for various markets.
To find out more visit Interactive Brokers today.
Join the Investment Moats Telegram channel here. I will share the materials, research, investment data, deals that I come across that enable me to run Investment Moats.


Do Like Me on Facebook. I share some tidbits that are not on the blog post there often. You can also choose to subscribe to my content via the email below.
I break down my resources according to these topics:
- Building Your Wealth Foundation – If you know and apply these simple financial concepts, your long term wealth should be pretty well managed. Find out what they are
- Active Investing – For active stock investors. My deeper thoughts from my stock investing experience
- Learning about REITs – My Free “Course” on REIT Investing for Beginners and Seasoned Investors
- Dividend Stock Tracker – Track all the common 4-10% yielding dividend stocks in SG
- Free Stock Portfolio Tracking Google Sheets that many love
- Retirement Planning, Financial Independence and Spending down money – My deep dive into how much you need to achieve these, and the different ways you can be financially free
- Providend – Where I used to work doing research. Fee-Only Advisory. No Commissions. Financial Independence Advisers and Retirement Specialists. No charge for the first meeting to understand how it works
- Havend – Where I currently work. We wish to deliver commission-based insurance advice in a better way.
Kyith is the Owner and Sole Writer behind Investment Moats. Readers tune in to Investment Moats to learn and build stronger, firmer wealth foundations, how to have a Passive investment strategy, know more about investing in REITs and the nuts and bolts of Active Investing.
Readers also follow Kyith to learn how to plan well for Financial Security and Financial Independence.
Kyith worked as an IT operations engineer from 2004 to 2019. Currently, he works as a Senior Solutions Specialist in Insurance Start-up Havend. All opinions on Investment Moats are his own and does not represent the views of Providend.
You can view Kyith's current portfolio here, which uses his Free Google Stock Portfolio Tracker.
His investment broker of choice is Interactive Brokers, which allows him to invest in securities from different exchanges all over the world, at very low commission rates, without custodian fees, near spot currency rates.
You can read more about Kyith here.
divvy
Sunday 30th of August 2020
thanks Kyith, very helpful article!
Kyith
Sunday 30th of August 2020
Thanks.
Kh
Sunday 30th of August 2020
The content here is gold!
Kyith
Sunday 30th of August 2020
thanks