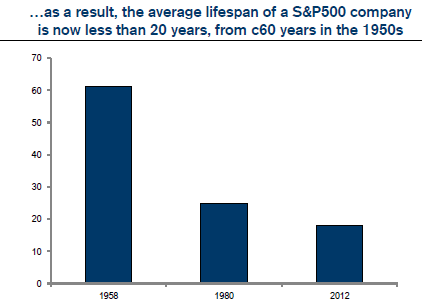

The Average Life Span of Companies is Shorter. This Affects Business Valuation
If you are trying to value a company, the lifespan of a company is rather important. If most of the value of the company lies …
If you are trying to value a company, the lifespan of a company is rather important. If most of the value of the company lies …
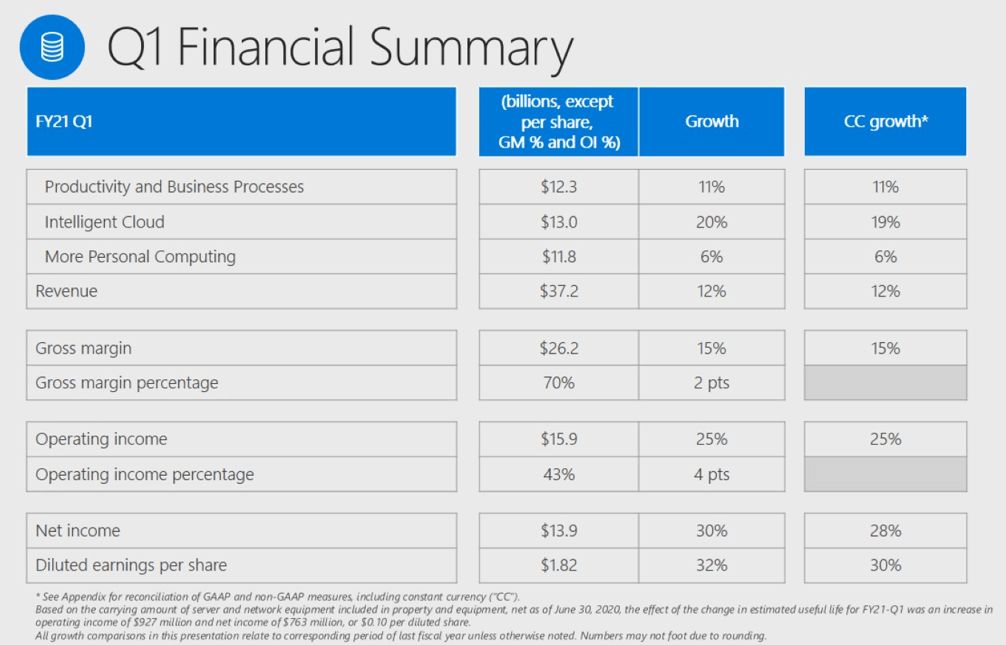
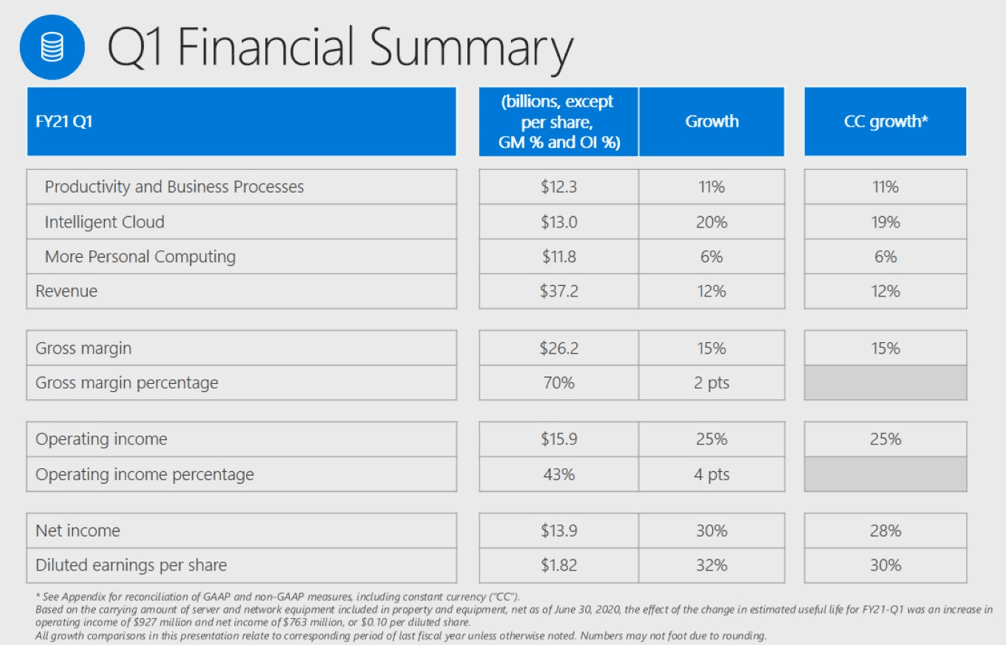
US tech giant Microsoft announced their Q1 2021 results yesterday morning. They achieve per-share profit growth of $1.82, beating analysts’ expectations of $1.54 a share. …

There are some deals that you have to treat as homework. Going through some of these deals are both a mental exercise but also whether …

In 2018, I spotted a telecom operator that has in excess of a 10% free cash flow yield. So I took a look at it. …
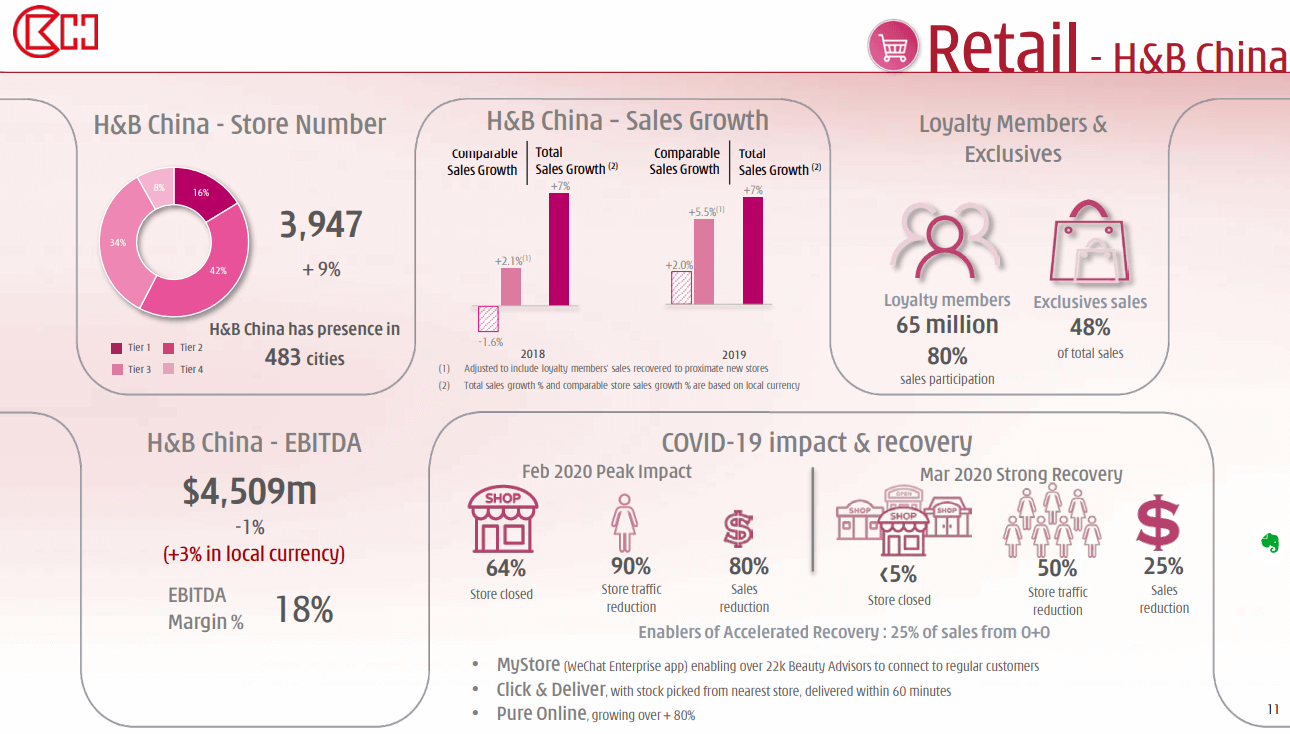
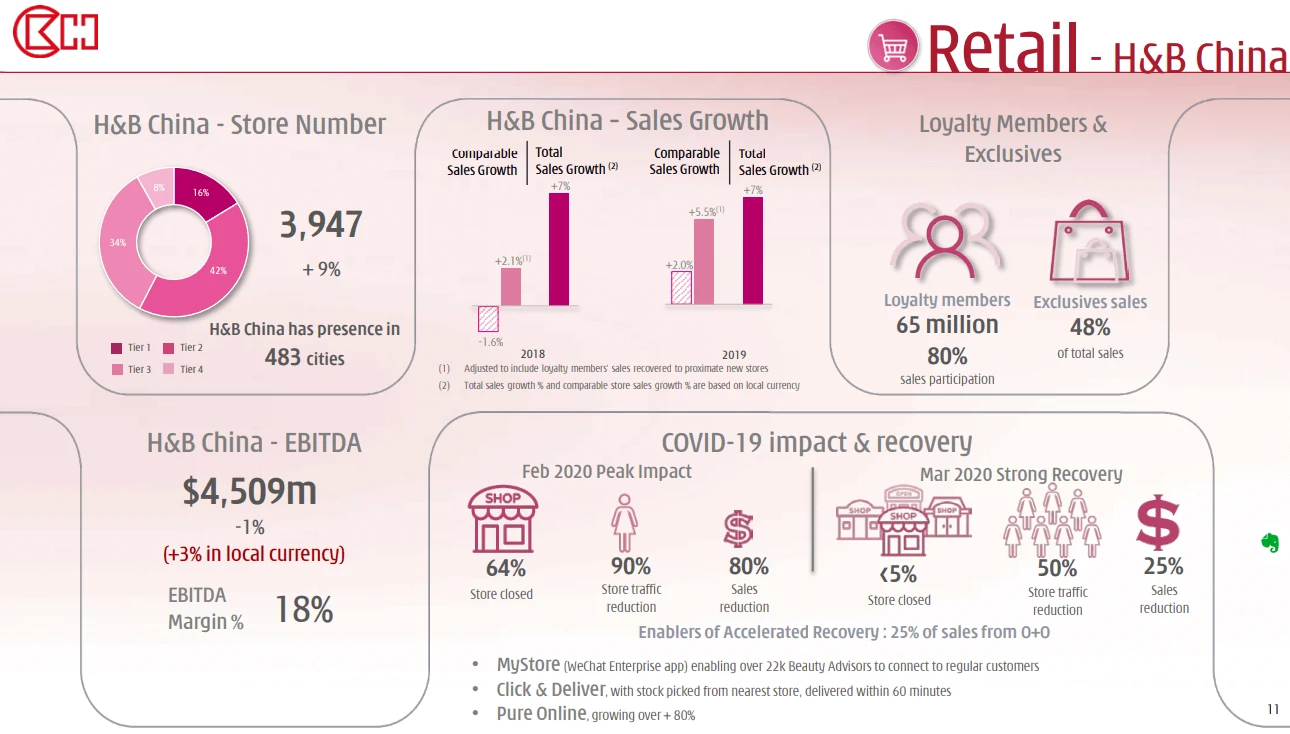
In terms of investments, CK Hutchison (0001.HK) will probably go down as one of my poorer investments. I got it at $85.90, $87.65, $81.25, $80.60, …

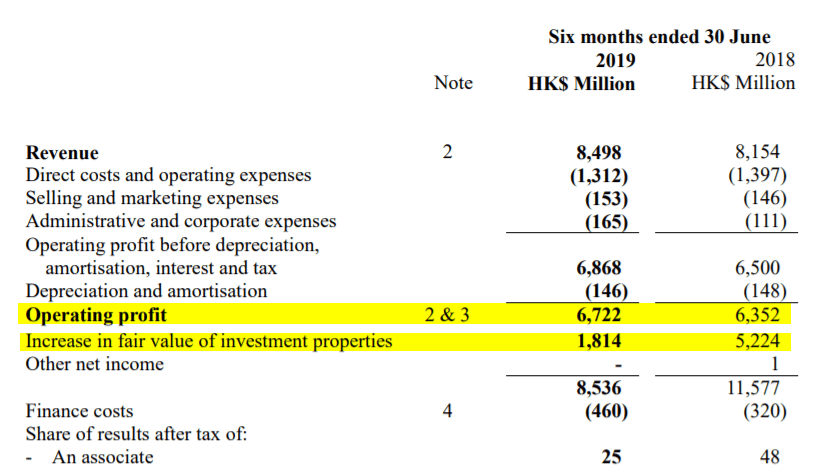
Wharf Real Estate Investment Company’s (REIC) interim results was not too bad. I first wrote about Wharf REIC here. If you are not familiar with …

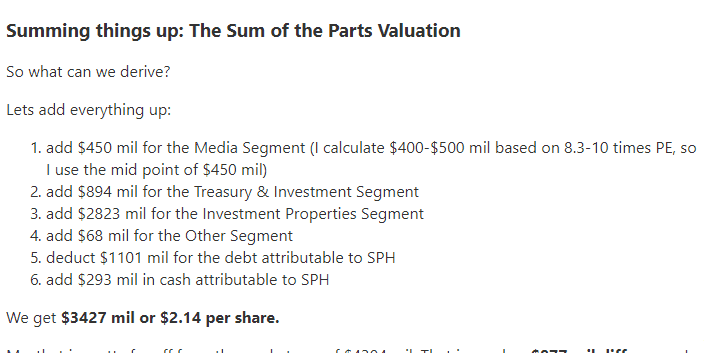
Singapore Press Holding is changing. Whether it is actions lead by new CEO Ng Yat Chung or previous management, the approach now seem to be …
SBS Transit currently has a market capitalization of $802 mil with 311 mil in outstanding shares. This is one company that I have invested in …

As active stock investors, we look for companies that can potentially be worth more than what they are selling now. These can be companies that …
Back when ComfortDelgro’s share price was around $2.04, I wrote a comprehensive analysis about it. In the article, I went through a few rounds of …