When we put our money in fixed deposits or savings account, we can reliably count on that if we put the money in on May 2018 and take it out in May 2020, we will get a certain annualized and cumulative returns.
It is difficult for a person new to investing to visualize their returns when the asset’s value or return is volatile. If you invest in individual stocks, unit trust, or ILPs, the value of your investments change over time.
With this kind of uncertainty, it is no wonder wealth builders stuck to tried and tested forms of investment.
I tried to think back to what convinced me to put my money in the stock markets instead of fixed deposit last time. At the start, I was not particularly convinced when the books showed that if you keep your money from 1929 to 2001, your wealth will compound at a 7-10% a year rate of return.
The time frame was too long and I read that the markets are always known to be uncertain and volatile.
I don’t think I would invest for 70 years. How would it fare in a shorter, but long time frame?
What if I was unlucky to put a huge chunk of my money in a time frame that was unfavorable? Would I regret my decision to take risk instead of putting my money in something else?
I viewed the markets with skepticism even as I was learning to be an individual stock investor.
What greatly convinced me was to look at the historical returns of various past long term periods. These periods are long but not super long. They are more practical and applicable because as new investors, we need to see some results in order to be convinced.
I think 5,7 and 10 years are a good time frame to judge.
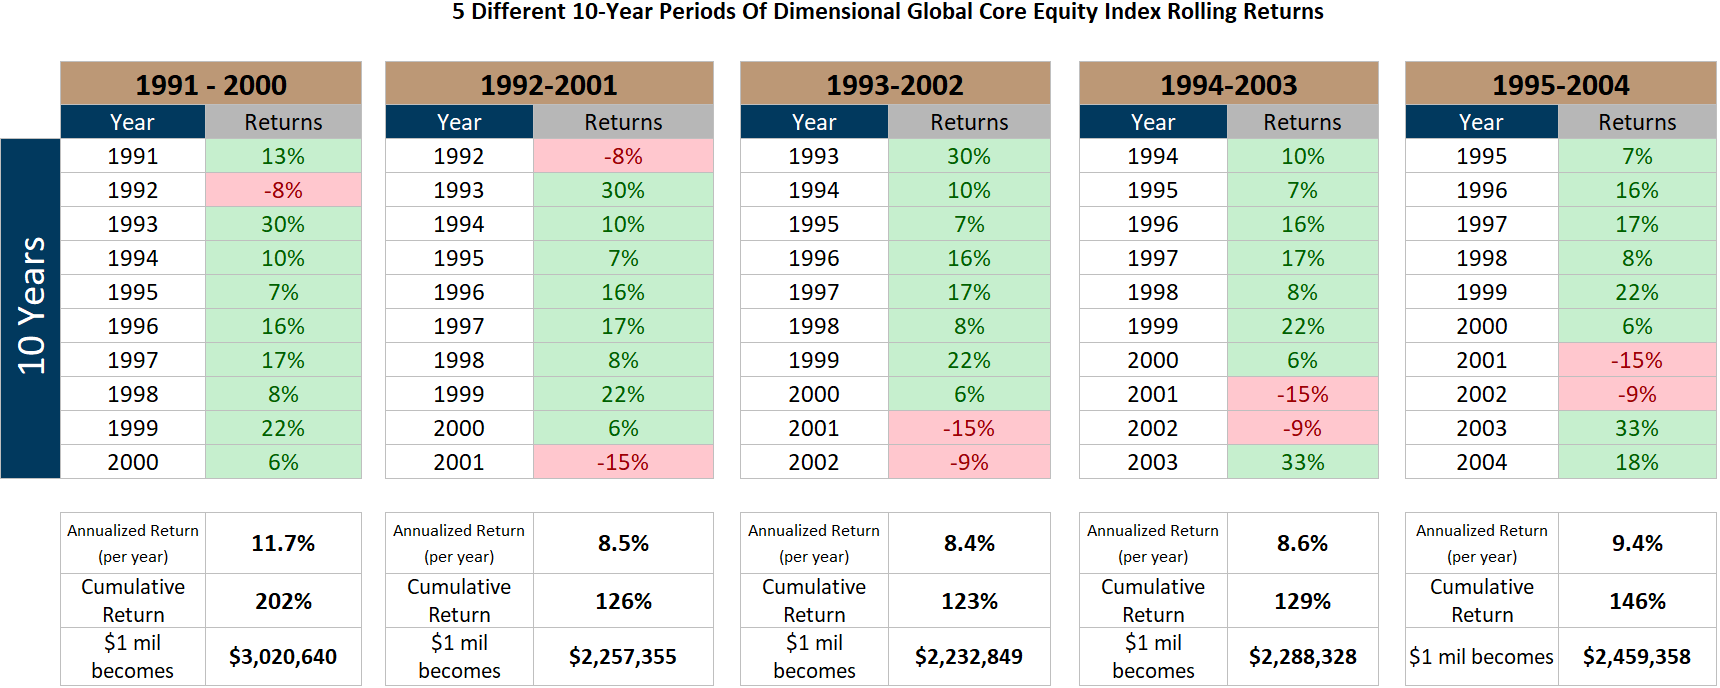
The table above was taken from a Providend article I have written this week on Rolling Returns, Conviction and Dimensional Core Equity Fund.
It shows 5 different rolling 10-year periods and they’re corresponding annualized and cumulative returns. We observe that the returns are not fixed. In some 10-year periods, the return can be very good (1991-2000) but most are close to the average.
By reviewing the rolling returns, we gain an appreciation of the range of returns we could get if we are lucky, not lucky, or when our luck is pretty even.
The article goes into more data but I would just like to highlight what is likely to happen as you lived through a 20-year investing period.

The histogram above shows the 1-year return of the Dimensional Core Equity Index from 1990 to 2019. This is a fund that tries to outperform the MSCI World index, so it is rather developed market-focused, very diversified (7000+ stocks), tilted towards value, higher profitability and smaller companies.
Each bar shows a range of returns. For example, there are 53 instances where the returns are between -0.2% to 7.7%.
In this 29 years time frame, if we break them up into months, there are 348 1-year periods. The range of returns varies wildly. The median returns is 11.5% a year. But there are some years where the returns can be negative.

If we stick with the portfolio for 5 years, you will observe the cumulative returns tends to skew towards more positive.
There are still some 5-year periods where your returns are negative. The worse will be that you invest $100,000 and 5 years later it ends up $80,000.
That is not a good feeling.
But you could also have $100,000 becoming $261,000 in 5 years.

If you managed to stick in the fund for 20 years, you can see the range of returns above. Based on this 29-year history, there are 130 20-year periods.
The most unlucky investor got only 4.2% a year annualized return after 20 years. His $100,000 grew to $221,000 in 20 years.
The investor in the middle grew his money to $419,000.
Investing in equities can be uncertain. It depends sometimes on your luck, but it tends to be positively skewed.
For the young accumulator, you can look at this in a different way: Each $12,000 that you put in each year goes through 1 of these 20-year periods. Some of your $12,000 grow at only 4.2% a year. Some $12,000 grow at 8.2% a year.
The volatility of your returns are smoothed over time.
There are data on more different time frames in the article.
Do let me know if this kind of narrative helps you as a new investor or you have other suggestions about what convinced you to put a large chunk of your net worth into something.
I invested in a diversified portfolio of exchange-traded funds (ETF) and stocks listed in the US, Hong Kong and London.
My preferred broker to trade and custodize my investments is Interactive Brokers. Interactive Brokers allow you to trade in the US, UK, Europe, Singapore, Hong Kong and many other markets. Options as well. There are no minimum monthly charges, very low forex fees for currency exchange, very low commissions for various markets.
To find out more visit Interactive Brokers today.
Join the Investment Moats Telegram channel here. I will share the materials, research, investment data, deals that I come across that enable me to run Investment Moats.


Do Like Me on Facebook. I share some tidbits that are not on the blog post there often. You can also choose to subscribe to my content via the email below.
I break down my resources according to these topics:
- Building Your Wealth Foundation – If you know and apply these simple financial concepts, your long term wealth should be pretty well managed. Find out what they are
- Active Investing – For active stock investors. My deeper thoughts from my stock investing experience
- Learning about REITs – My Free “Course” on REIT Investing for Beginners and Seasoned Investors
- Dividend Stock Tracker – Track all the common 4-10% yielding dividend stocks in SG
- Free Stock Portfolio Tracking Google Sheets that many love
- Retirement Planning, Financial Independence and Spending down money – My deep dive into how much you need to achieve these, and the different ways you can be financially free
- Providend – Where I used to work doing research. Fee-Only Advisory. No Commissions. Financial Independence Advisers and Retirement Specialists. No charge for the first meeting to understand how it works
- Havend – Where I currently work. We wish to deliver commission-based insurance advice in a better way.
Kyith is the Owner and Sole Writer behind Investment Moats. Readers tune in to Investment Moats to learn and build stronger, firmer wealth foundations, how to have a Passive investment strategy, know more about investing in REITs and the nuts and bolts of Active Investing.
Readers also follow Kyith to learn how to plan well for Financial Security and Financial Independence.
Kyith worked as an IT operations engineer from 2004 to 2019. Currently, he works as a Senior Solutions Specialist in Insurance Start-up Havend. All opinions on Investment Moats are his own and does not represent the views of Providend.
You can view Kyith's current portfolio here, which uses his Free Google Stock Portfolio Tracker.
His investment broker of choice is Interactive Brokers, which allows him to invest in securities from different exchanges all over the world, at very low commission rates, without custodian fees, near spot currency rates.
You can read more about Kyith here.
- My Dividend Experience Investing in UCITS iShares iBond Maturing in 2028. - April 23, 2024
- We Invest into Popular Funds When They Are Popular, Exactly When They Started Turning to Shxt. - April 22, 2024
- Meal Prep 2.0 – Cooking Your “Go-to” Meal that You Look Forward to Eating Everyday. - April 21, 2024