A reader wonders how well or poorly Singapore small-cap value stocks have performed as a basket in the past.
I must let him know that I probably don’t have small-cap value data for Singapore.
But I do have nice MSCI Singapore and MSCI Singapore small-cap data.
What is nice is that we can compare the performance of Singapore and Singapore’s small-cap to the glorious US blue chip index.
Mr Loo of 1M65 likes to say the STI is the Singapore terrible index so it is only right we do some data crunching.
We start off by reflecting upon how much the currency denomination matter in returns.
Performance of MSCI Singapore (SGD) vs MSCI Singapore (USD)
One very common mental misdirection comes from people comparing the returns of a USD-denominated index such as the S&P 500 to a SGD-denominated index such as the STI ETF.
Is the S&P 500 always better than a Singapore index?
I think it is a less neutral comparison if we don’t use similar currency.
But how big is the impact of the fund currency to your returns? Should you be worried about this and always find a Singapore-denominated fund?
The best way is to use one index, and reflect upon the performance of two different currency denominated fund that invest in the same region.
From 1970 to end April 2023 the annualized compounded return of the MSCI Singapore in SGD and USD is as follows:
- SGD: 7.8% a year
- USD: 9.5% a year
Some of us like to say the Singapore is a terrible index but if you look at the returns, which is more awful? Compounding at 7.8% or 9.5%?
Underlying both are the same set of companies, just that the currency measurement is different.
But if you are a Singaporean investing in a USD-denominated MSCI Singapore, you would have to convert back the value of the investments back to SGD.
There would be some losses there.
Do you disagree that the Singapore index did not help you build wealth if its in SGD? I think not. Many will be happy with 7.8% a year. The underlying businesses did their job.
How should you look at this?
It is up to you to decide.
Here is the Growth of Wealth of US$1 million or SG$1 million:

$1 million 54 years later ends up as US$128 million or SG$56 million.
This will most likely screw with your brains more.
How does the MSCI Singapore do against the glorious S&P 500?
If you are a Singaporean, let us judge in SGD for both.

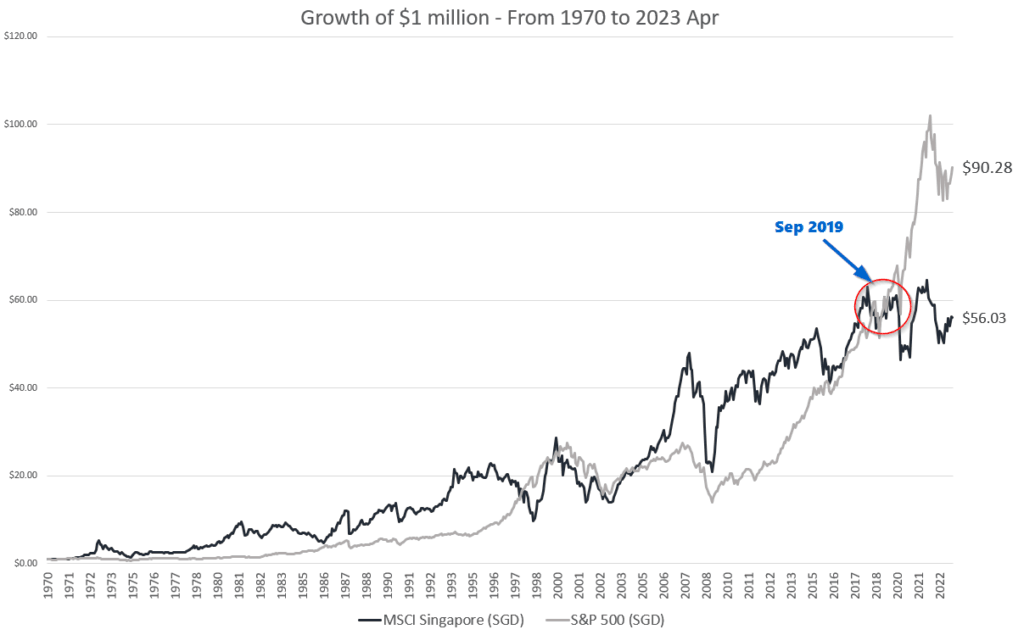
The glorious S&P 500 in SGD had to play catch-up to that terrible Singapore index.
For almost 26 years, the MSCI Singapore was way ahead of the S&P 500.
Bet many didn’t see that coming.
Here are the annualized returns (1970 to Apr 2023):
- S&P 500 (SGD): 8.8% a year
- MSCI Singapore (SGD): 7.8% a year
I can make a conclusion: whether you invest in S&P 500 or MSCI Singapore, no one is complaining when $1 million grows to either $90 million or $56 million.
But if you are bragging, then it matters.
The S&P 500 Glorious Growth Against the Singapore Small Cap
Invest in the blue-chip Singapore stocks but not the smaller Singapore companies. That has always been the advice.
Better yet, invest in the S&P 500 instead of the smaller Singapore companies…
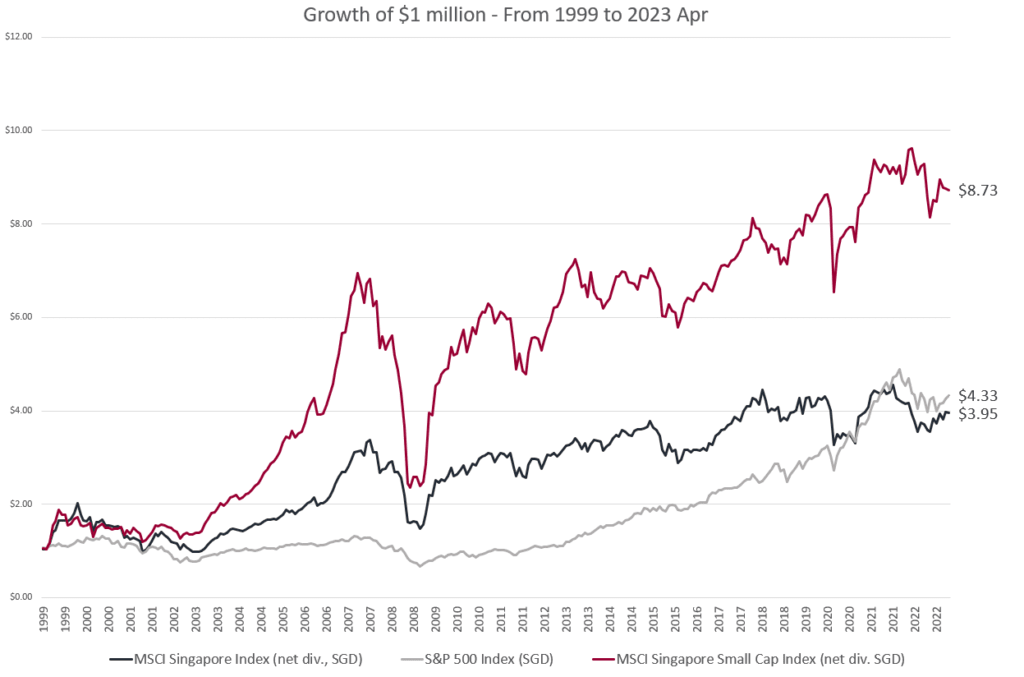
We only have about 23 years’ worth of MSCI Singapore Small Cap Index so here is how the Kachang Puteh Sing Stocks, as a cohort, compare to the MSCI Singapore and S&P 500 in SGD:

$1 million in MSCI Singapore Small Cap became $8.7 million while the S&P 500 and MSCI Singapore bluer Chips was locked around $4 million.
The Kachang Puteh Singapore companies will give you a lot of frightful episodes such as 2008 and 2020, but they generally did pretty well.
With greater uncertainty, you need higher returns to compensate for taking on the uncertain risk, and the Kachang Puteh investor is rewarded.
This despite the last 12 years of glorious US growth against that lacklustre Singapore small caps.
Here are the annualized returns (1999 to Apr 2023):
- S&P 500 (SGD): 6.2% a year
- MSCI Singapore (SGD): 5.8% a year
- MSCI Singapore Small Cap (SGD): 9.3% a year
The Minimum Duration of Singapore and S&P 500 to Break Even and Capture the Returns.
With 54 years of data, we can see roughly how long it takes for both Singapore and S&P 500 to break-even or capture the average returns.
One of the questions we asked internally is about the duration about some of our portfolios and a review of the rolling returns allow us to have insight here.
In Singapore dollars, the average compounded return is:
- S&P 500 (SGD): 8.8%
- MSCI Singapore (SGD): 7.8%
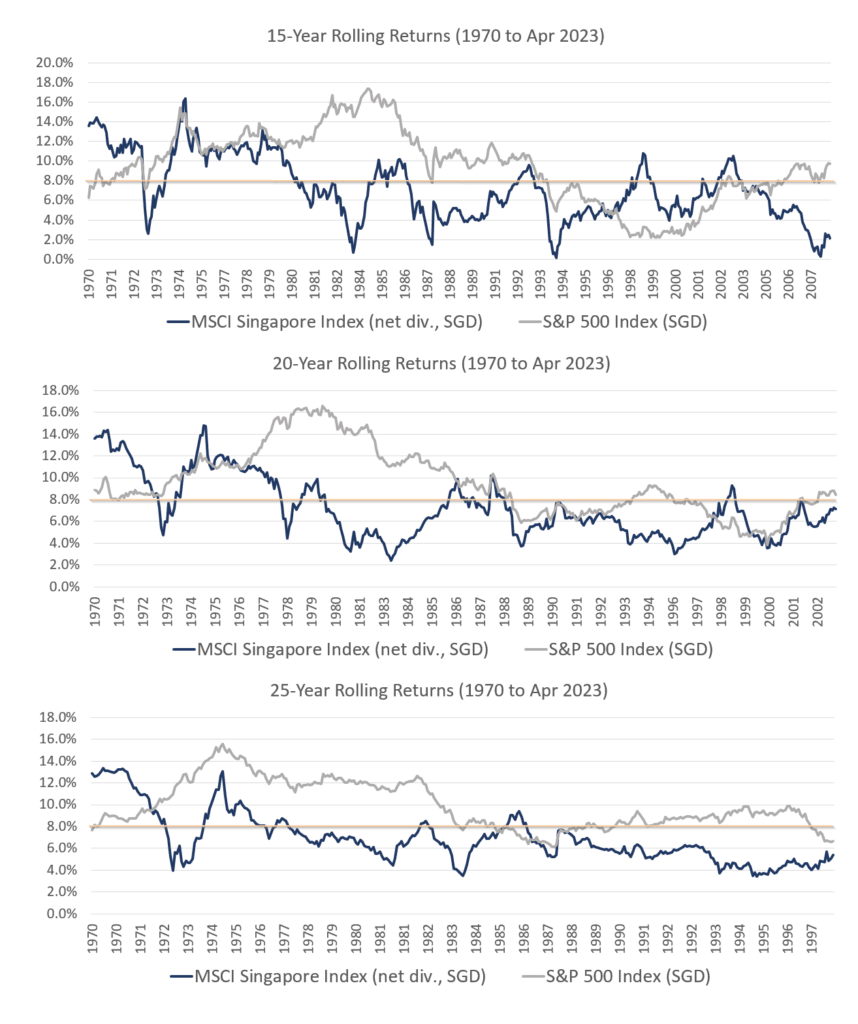
Here is the MSCI Singapore and S&P 500 over 15, 20, 25-year rolling returns from 1970 to Apr 2023:

The cream line marks the average compounded return of MSCI Singapore and S&P 500.
The first thing to note is that to break even, the duration needed for equities may need to be more than 15 years.
It will not be surprising to invest for less than 15 years and lose money.
The slight on MSCI Singapore is if we talk about 20, 25 year period, there are many 20, 25-year period where returns are much lower than average.
In contrast, if you invest in S&P 500 for 25-years, you can build wealth pretty well for the best 54 years.
If you consider 4% a year for 25-year is good, then even the terrible Singapore stocks can build wealth as well.
If you want to trade these stocks I mentioned, you can open an account with Interactive Brokers. Interactive Brokers is the leading low-cost and efficient broker I use and trust to invest & trade my holdings in Singapore, the United States, London Stock Exchange and Hong Kong Stock Exchange. They allow you to trade stocks, ETFs, options, futures, forex, bonds and funds worldwide from a single integrated account.
You can read more about my thoughts about Interactive Brokers in this Interactive Brokers Deep Dive Series, starting with how to create & fund your Interactive Brokers account easily.
- Should I Take Less Risk in My Fixed Income Allocation by Moving Away from a Global Aggregate Bond ETF? - May 5, 2024
- Singapore Savings Bonds SSB June 2024 Yield Climbs to 3.33% (SBJUN24 GX24060A) - May 3, 2024
- New 6-Month Singapore T-Bill Yield in Early-May 2024 to Stay at 3.75% (for the Singaporean Savers) - May 2, 2024

Thinknotleft
Saturday 6th of May 2023
Hi Very interesting and informative article.
My hypothesis is -- STI or MSCI (Singapore) should beat S&P in the next decade. Because every dog has its day.
A takeaway c-- when one invests in single country index, one has some chances of very good returns and some chances of very poor returns. If poor returns are anathema to one, one can diversify and hold world indices etf or multiple countries/region ETF.
It will be interesting if you can include the MSCI World Index returns in your rolling 15-/20-/25-year returns charts.
Kyith
Saturday 6th of May 2023
Hi Thnknotleft, the msci world or all country world is heavy on the US, it should be quite similar. but in any case, i need to do something internally on this perhaps i will show it one of these days.
A lot have been waiting for that reversion to the mean for hong kong and Singapore for some time.