Buy-to-let property is a wealth machine that many in Singapore or Asia think is ideal for their retirement income. (In case you are new to the concept of wealth machines, you can read it here)
I am okay with that as a wealth machine.
It is just that how do you plan your financial independence, or retirement with the income from a buy-to-let property?
There are two questions we need to contend with:
- What is the starting income that you use to plan?
- How does the income grow from the start and over time?
Answering these two questions have critical outcome to whether your plan work or not.
The very common assumptions used in planning:
- The current rental yield that the client or prospect has secured.
- An assume annual growth rate of 2-3% p.a.
Are these planning assumptions sound? I don’t know.
If we look at the data, planning like this may result in a mismatch in your expectations compare to the reality.
I realize that we have about 15.5 years of gross HDB rental income data that can help us understand the actual income growth. With this data we can see:
- Imagine someone happens not to be living in one of the HDB flats.
- Fully paid off the flat.
- Is paid an income that the homeowner needs to support him or her?
- If the homeowner imagine that they go back to year X, and lives through this income experience, how much anxiety will they feel? Or would they have peace of mind?
HDB has some historical median gross rental income data of various Singapore areas here.
I tabulated the gross rental income for five Singapore areas (Sengkang, Ang Mo Kio, Jurong West, Queenstown and Woodlands) from Q3 2007 to Q1 2024 below:
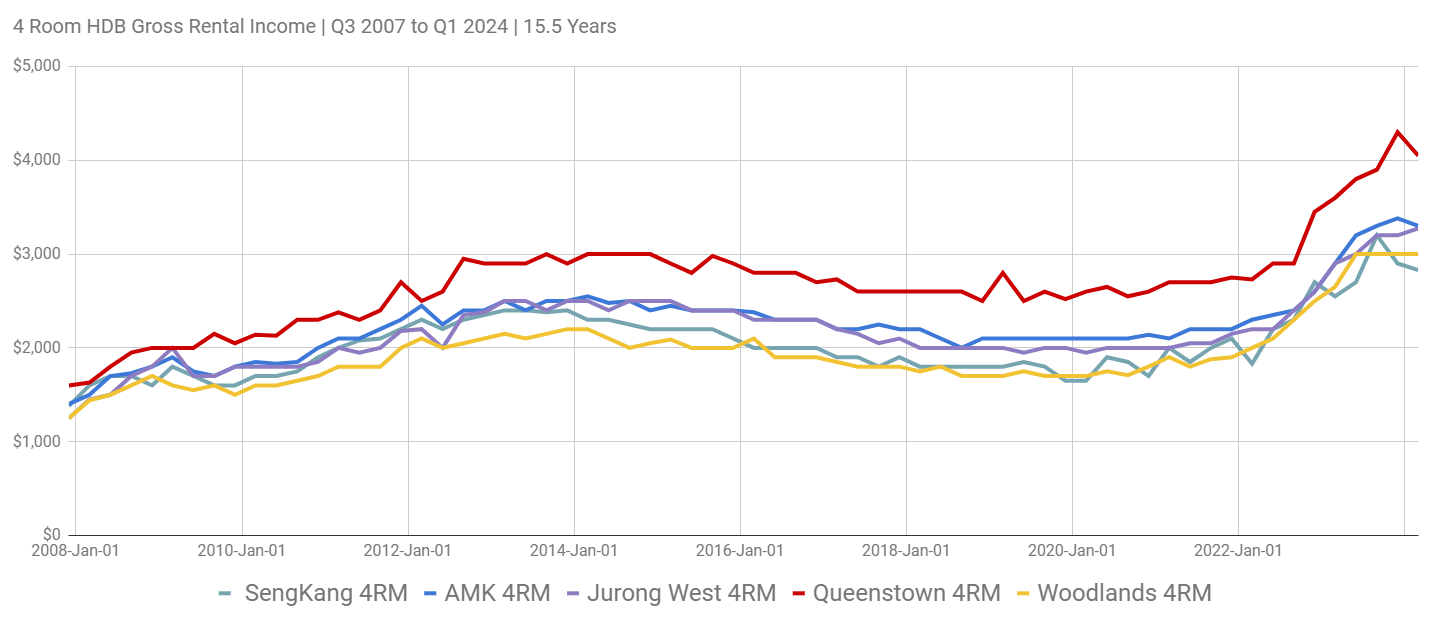
Now I know, most of us consider our HDB flat as our live-in residential and are not renting it out. However, since we have numerous HDB flats, quite a fair bit of demand and supply, this allows us to reflect on the nature of income change and if our needs can be met.
I have done it with selected private condominium rental data. The set is lesser but the nature of income change is not too different.
I selected Sengkang because I was interested in it, and then select Queenstown because by right, it is near town and we may see a different price trend. I selected Woodlands because the rent is the lowest.
Although I present only 4-room HDB, the rental income trend for 3 and 5-room is not too different.
We observe that Queenstown and Woodlands most often are the highest and lowest respectively. The income of all five regions go up and down in relative lock-steps.
These are the main trend:
- Rental income does not go up from the bottom left to top right in a straight line.
- There is no area that is special that goes against the trend.
- From 2007 to 2013 (7 years), rental income appreciated.
- From 2013 to Sep 2020 (7 years), rental income went down.
- Sep 2022, rental income really shot up.
If we think from a person that requires income, your experience will be rather different:
- The retiree in 2007 saw his or her income go up and then down and in Sep 2020 or 13.5 years later, his or her income is just higher than where they started off, before seeing the income triple.
- The retiree in 2013 will see the income drop by 30% in Sep 2020 before the income recover and went higher in 2024.
- The retiree in 2020 will see their income almost up 80% in 2024.
What we should reflect about is:
- There are times when the cost of your spending line items go up with inflation, but based on rental income and supply, your income might be going down instead. If so, what would you do?
- Yet for some, they will have large income surpluses due to favorable demand and supply.
Here is a table showing the range of income:
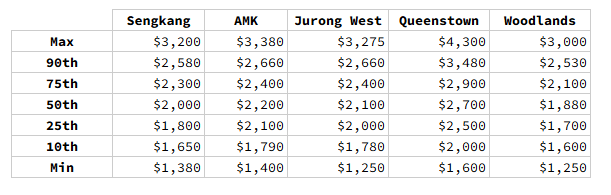
Here is a summary of the rental income growth over this period:
- Sengkang: 4.6% p.a.
- Ang Mo Kio: 5.4% p.a.
- Jurong West: 5.9% p.a.
- Queenstown: 6.0% p.a.
- Woodlands: 5.5% p.a.
If you plan using this average rental income growth, your actual income experience may… not exactly match what you see.
I separated out the rental income for Sengkang on it’s own for your appreciation:
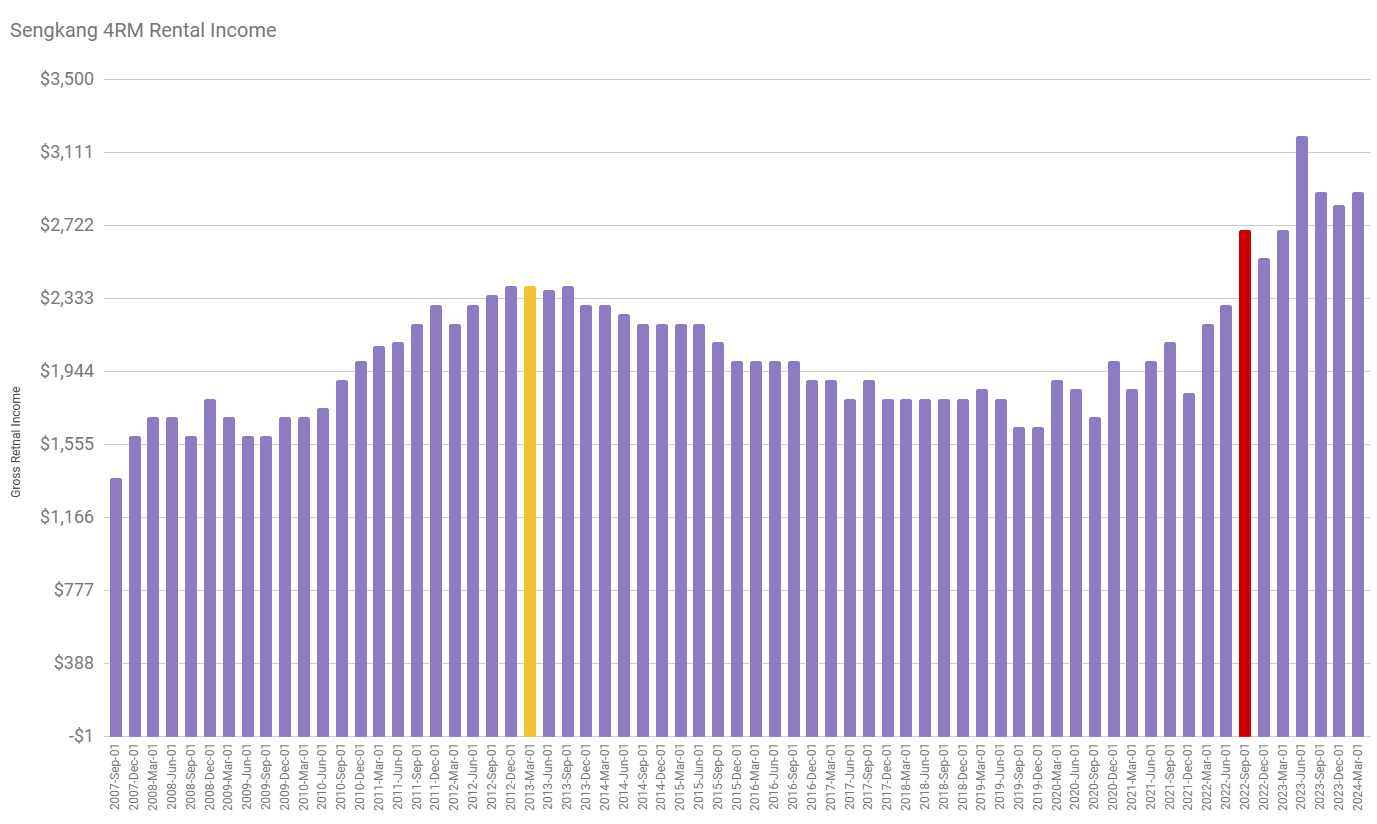
The yellow bar shows the rental peak in Mar 2013 and the red bar shows the greatest spike in Sep 2022.
Here is Queenstown:
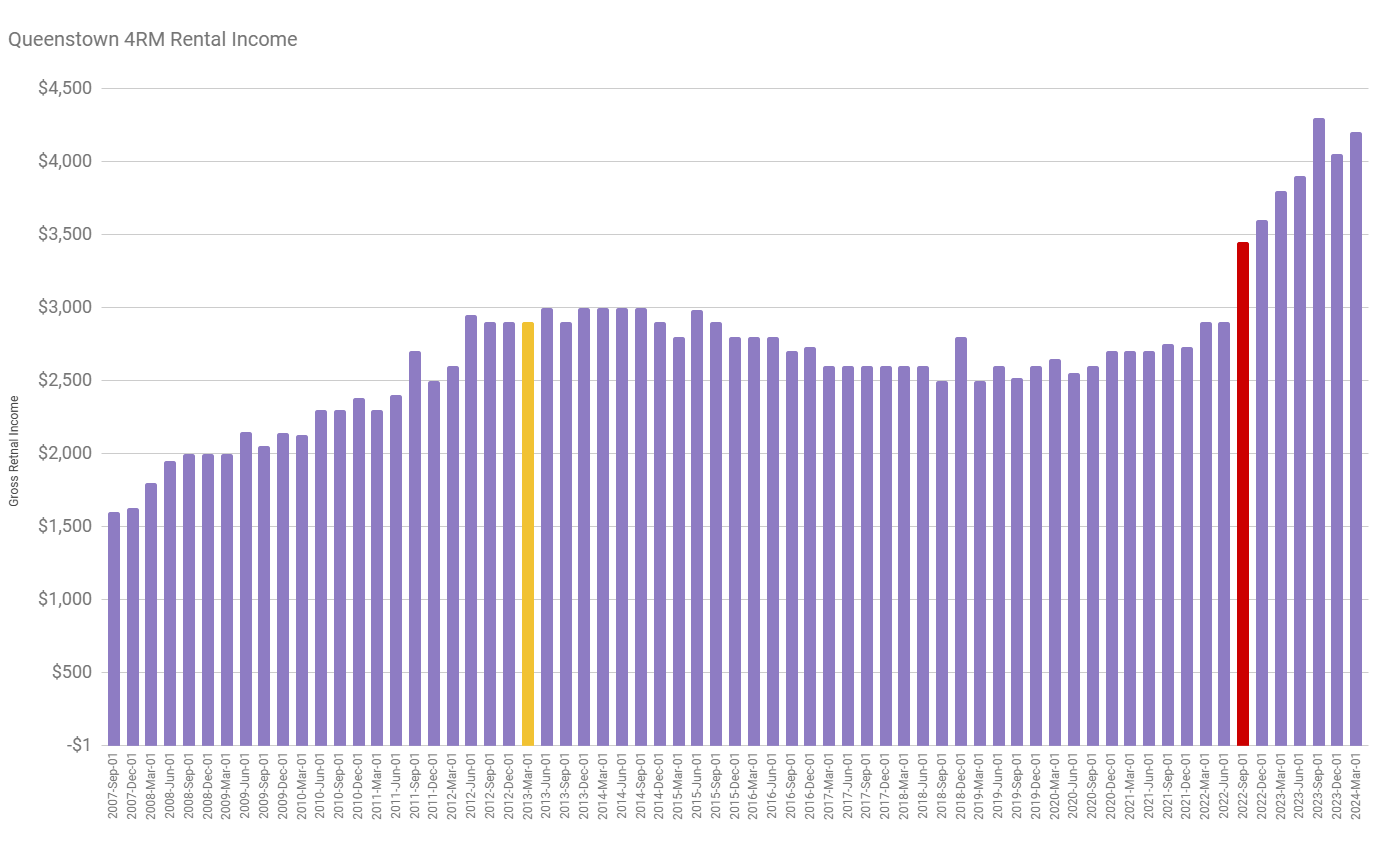
We observe that since the peak in 2013, the rental income show a smaller fall compare to Sengkang, Jurong West and Ang Mo Kio.
And here is Woodlands:
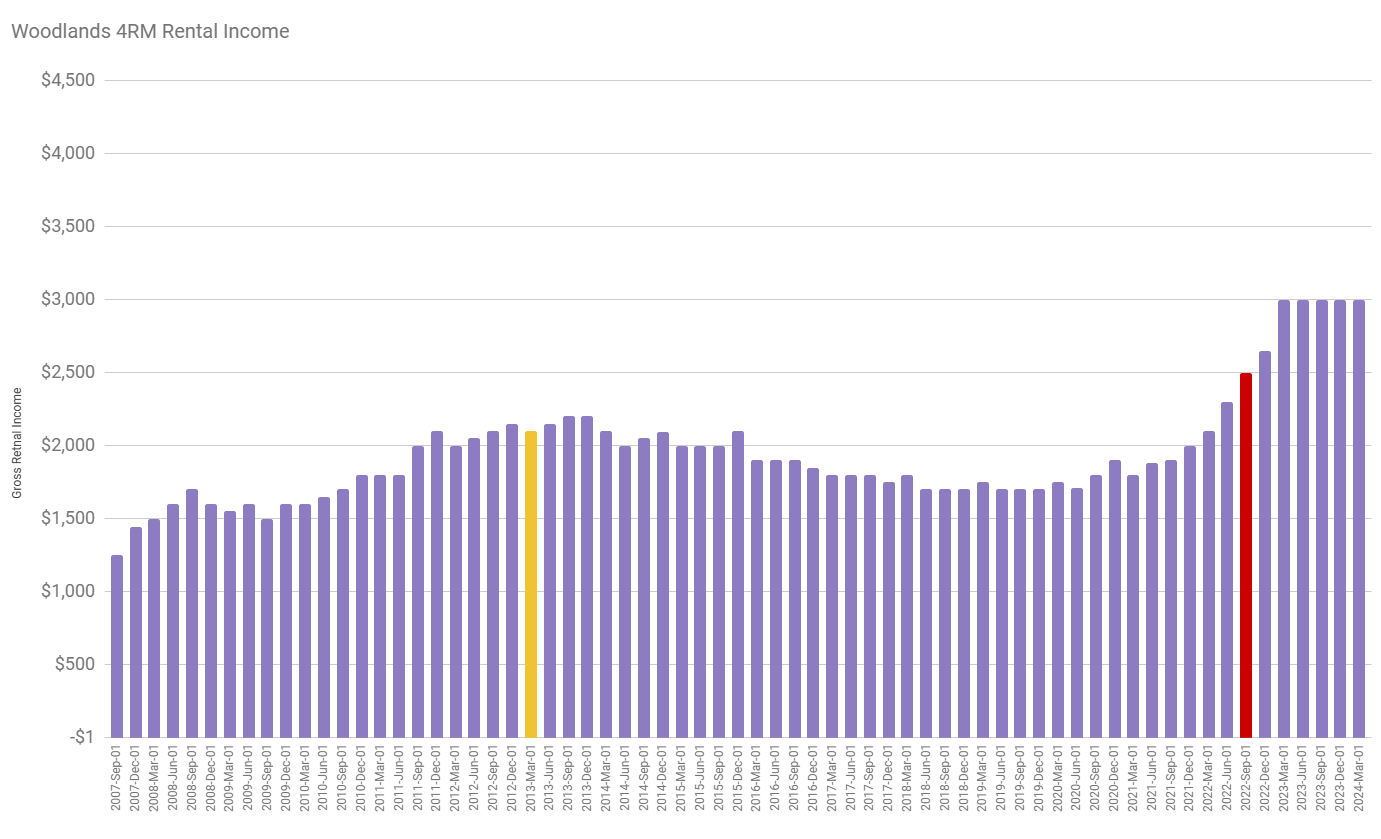
Woodlands have the lowest gross rental income but strangely the median gross rental income recently is the most stable.
Conclusion
Now that you have seen this data does it change how you would answer these two questions:
- What is the starting income that you use to plan?
- How does the income grow from the start and over time?
If you are retiring today, and depending on the rental income, what would be the income that you use in your planning?
Currently, the income is $3,300 monthly. You would most likely have to include the expenses incur because you are renting it out to be realistic but let us just imagine cost is not an issue.
Has the demand and supply of properties change so much in 2022 that it is different from the past?
If yes, then as more supply comes online, would rental income moderate like 2013 to 2020?
If no, then there is no issue planning with $3,300 monthly.
The more prudent people may realize that they need a buffer between their spending needs and the income due to the income volatility.
But how much?
The past data might provide you some hints. The income volatility can be as much as plus/minus 30%.
So if the net rental income is 9.5 months of $3,300 ($31,350), I would visualize that a conservative income is $31,350 x 70% = $21,945 ($1,828 monthly).
This income looks low, until you see how possible the income is in those charts.
I invested in a diversified portfolio of exchange-traded funds (ETF) and stocks listed in the US, Hong Kong and London.
My preferred broker to trade and custodize my investments is Interactive Brokers. Interactive Brokers allow you to trade in the US, UK, Europe, Singapore, Hong Kong and many other markets. Options as well. There are no minimum monthly charges, very low forex fees for currency exchange, very low commissions for various markets.
To find out more visit Interactive Brokers today.
Join the Investment Moats Telegram channel here. I will share the materials, research, investment data, deals that I come across that enable me to run Investment Moats.


Do Like Me on Facebook. I share some tidbits that are not on the blog post there often. You can also choose to subscribe to my content via the email below.
I break down my resources according to these topics:
- Building Your Wealth Foundation – If you know and apply these simple financial concepts, your long term wealth should be pretty well managed. Find out what they are
- Active Investing – For active stock investors. My deeper thoughts from my stock investing experience
- Learning about REITs – My Free “Course” on REIT Investing for Beginners and Seasoned Investors
- Dividend Stock Tracker – Track all the common 4-10% yielding dividend stocks in SG
- Free Stock Portfolio Tracking Google Sheets that many love
- Retirement Planning, Financial Independence and Spending down money – My deep dive into how much you need to achieve these, and the different ways you can be financially free
- Providend – Where I used to work doing research. Fee-Only Advisory. No Commissions. Financial Independence Advisers and Retirement Specialists. No charge for the first meeting to understand how it works
- Havend – Where I currently work. We wish to deliver commission-based insurance advice in a better way.
Kyith is the Owner and Sole Writer behind Investment Moats. Readers tune in to Investment Moats to learn and build stronger, firmer wealth foundations, how to have a Passive investment strategy, know more about investing in REITs and the nuts and bolts of Active Investing.
Readers also follow Kyith to learn how to plan well for Financial Security and Financial Independence.
Kyith worked as an IT operations engineer from 2004 to 2019. Currently, he works as a Senior Solutions Specialist in Insurance Start-up Havend. All opinions on Investment Moats are his own and does not represent the views of Providend.
You can view Kyith's current portfolio here, which uses his Free Google Stock Portfolio Tracker.
His investment broker of choice is Interactive Brokers, which allows him to invest in securities from different exchanges all over the world, at very low commission rates, without custodian fees, near spot currency rates.
You can read more about Kyith here.
lim
Tuesday 28th of May 2024
If you pay off your housing loan several years before you retire, the net rental income is basically going towards your retirement savings (since salary will cover current expenses). This is your buffer until age 65.
At age 65 your $3,330 /mth CPFLife ERS payments will start adding to your income flow.
Of course, there is at least one local blogger that achieved "FIRE" even with a mortgage loan (I believe he viewed it as leveraging his investments and using the cashflow to pay the mortgage loan), but I am old fashioned and prefer to have zero debt when I retire.