So after I wrote the Lippo Malls Retail Trust Proposed Purchase of Puri article, some more astute readers in the REIT Telegram group commented that their latest distributable income is much much lower than previous quarter.
Indeed they are right.
Figuring out these rights issue stuff is rather challenging so I based a lot of my figures on the guidance in the announcement. They used a distributable income and so I based my analysis off it.
Totally didn’t check if that income is sustainable.
And that really impacts because for the past years, LMIR’s cash flows have been volatile.
Their Q4 DPU is 0.30 cents so if we annualized it, its 1.20 cents. If we take it that LMIR operations do not improve, and conservatively they can at most pay out this amount, then the dividend yield would be 1.2 /19.9 = 6%.
This is nowhere near the 10.3%, as stated in the announcement (this is not wrong either. LMIR just summed up all 4 quarter’s distribution)
Given this, acquiring a 9.41% NPI yield property should be accretive.
Man, if they present this way, I might not shoot them down so much. But I can understand why they won’t present it this way. The REIT manager’s usually illustrate based on historical and it is not always easy to forecast the dividend yield going forward. So LMIR is not doing something wrong here.
My question for those interested is that should we use 0.30 cents x 4 quarters. I think we should, conservatively, but I think you should also shoot some questions to the management via the investor relations to get a sensing why the distributable income drop so much and whether it will be like this going forward.
This is only fair and it may affect your buy, sell and hold decisions.
I would like to try and figure out how sustainable is the dividend, whether it is really going to be a 6% dividend yielder.
Assessing the Distributable Income
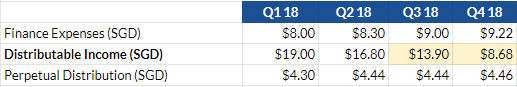
You would have realize that the distributable income have been dropping every quarter. And you should be asking the management some questions to figure out the operating environment.
However, the Q3 to Q4 drop off looks especially drastic (a 37.5% drop!). Now what would cause this?
Assessing the Revenue and Net property income in Rupiah
We try to assess the situation based on the operations, by taking out the currency fluctuations.
It would also be good to take stock whether the business is actually thriving.
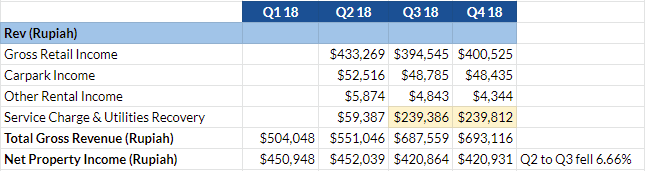
In Q1 there was no break down in Rupiah. From Q2 to Q3 we see a significant fall in gross retail income. The carpark income looks OK. We also see gradual weakness in other income.
It is at Service Charge & Utilities that we see the greatest boost from Q2 to Q3.
This is due to a change in business and tax environment that resulted in LMIR discontinuing a contract with a third party and taking on the work themselves.
Here is the note with regards to this:
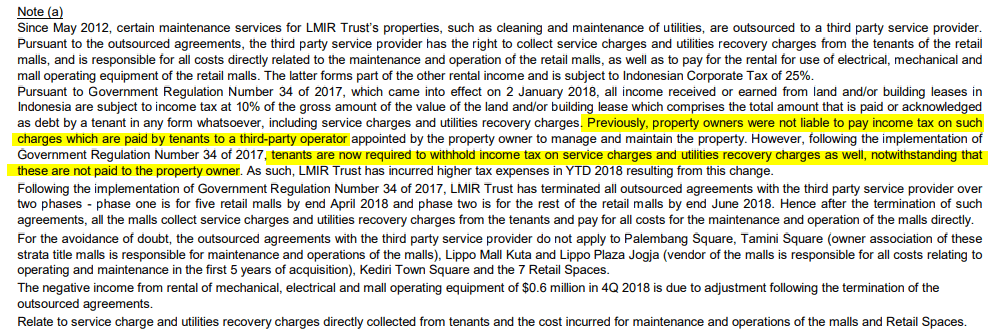
This increase in tax payable looks to be permanent, and cause LMIR price to go down drastically when announced.
So LMIR will collect these service and utilities as revenue and later expense them accordingly in the expenses section.
Net property income was stable for Q1 and Q2, then the NPI dropped 6.6% to $420 mil in Q3 and Q4.
What is interesting to note is that Q3 and Q4 revenue and NPI in Rupiah is rather consistent.
This seem to indicate to us that business was affected by the tax expense changes, but largely remain OK.
Assessing the Revenue and Net property income in SGD
Given the currency depreciation of Rupiah versus SGD, we should see a weaker set of Revenue and NPI figures in SGD.
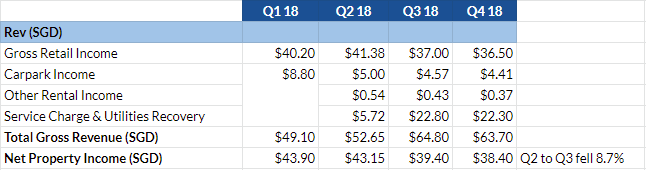
And you can see it is largely the same. There is a fall in revenue and NPI from Q2 to Q3. However, Q3 to Q4 figures are rather consistent.
The NPI fell more between Q3 and Q4, probably due to the currency depreciation, but not to such an extend that will impact a 5 mil drop in distributable income from Q3 to Q4.
Assessing the Cash Flows
The cash flow portion of the financials probably will tell us whether LMIR can sustain the dividend or not.
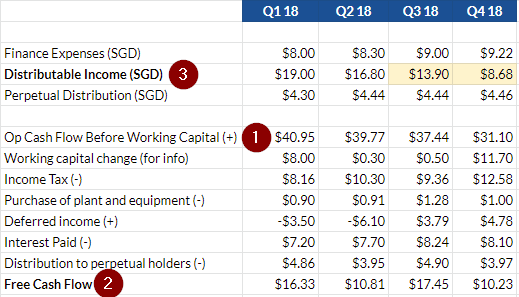
In the table above, I tried my best to compute a reasonable free cash flow without including the change in working capital (#2). It is erratic. Q1 was $16 mil, then 11 mil, then 17 mil then 10 mil. There are some things that it will be quite challenging to read into quarter to quarter results and free cash flow is probably one of those.
This is because management could choose to pay certain expenses in particular quarters, be it income tax, or some one offs. So if we compare quarter by quarter it will be rather meaningless.
However, if you look at the operating cash flow before working capital (#1), Q1 to Q3 looks pretty close, then in Q4 it fell off the cliff.
I realize a lot of the attribution for this is down to the Other Net Gain/Loss in the Statement of Total Return. The rest looks largely inline.
Assessing Other Net Gain/Loss
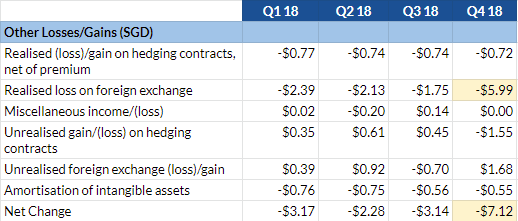
The net change for Q1 to Q3 was rather consistent, with Q2 being lower, but it shot up in Q4.
The realised loss on foreign exchange in Q4 is roughly $4 mil higher than in Q1 to Q3.
We might have found the major culprit.
We are still missing around $1 mil, but that could be a mixture of other factors, which is smaller than this realised loss on foreign exchange.
So how permanent is this?
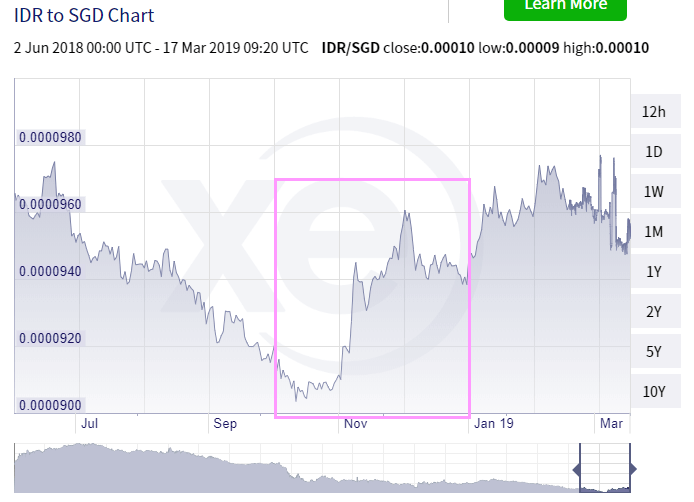
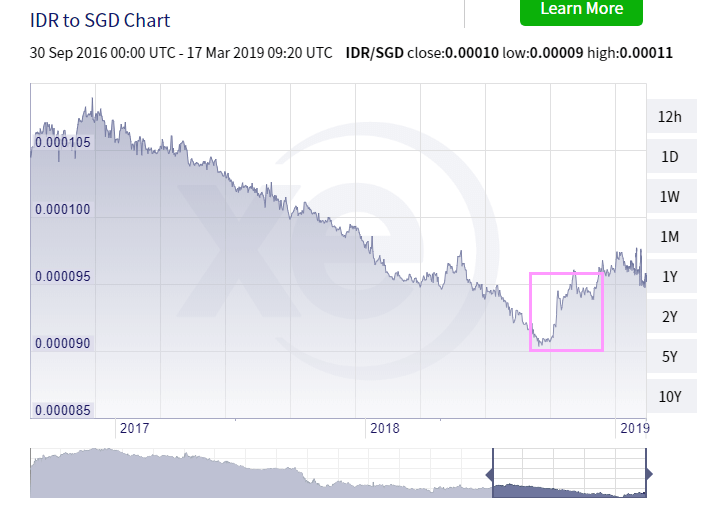
The two chart above shows the Rupiah versus SGD in two different time frames.
Don’t tell me some hedging gone super wrong there???
Even if it is, if its a short term currency fluctuation, LMIR should be able to find the resources to make up for that currency short fall and pay a lower dividend but not 37.5% lower.
The Dividend Yield Going Forward
So what is the dividend per unit going forward? I have no idea.
If my analysis is correct and its due to the currency stuff, then it might not be so permanent. However, I find it unsettling that they cut the dividend so much. Was it some cash flow issue?
In any case I think it might not make sense to compute with Q4’s distributable income.
What would be the yield if we use Q3’s distributable income? Q3 is good because it reflects the extra income tax expense that they have to pay.
So Q3 is 0.49 cents and if we annualized it the dividend yield is (0.49 x 4)/19.9 = 9.84%.
That is pretty close to my previous analysis figure.
If you want to be more conservative, perhaps take Q3 and Q4 DPU and average them. We will get like 0.395 cents. The dividend yield would be (0.395 x 4)/19.9 = 7.94%.
The Impact to the Yield Accretiveness of Proposed Acquisition
Originally, I thought that if the dividend yield is 6%, it should be accretive. If it is at 7.94% or 9.84%, then not so much.
I have reworked the data for the 2 capital financing structure with income support.

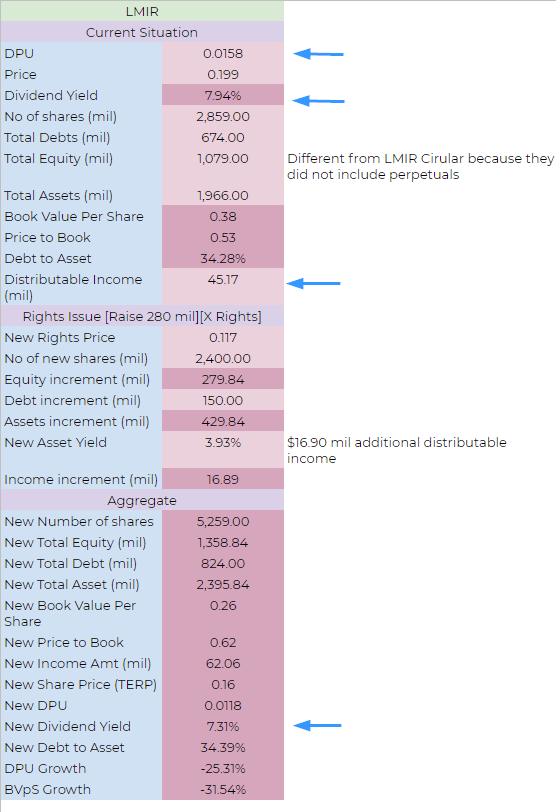
The yield accretiveness improved by 2 to 3% points. However, likely it will be not accretive still.
It can be quite befuddling.
How can a 9% NPI property get reduced to a yield of 2.6%-3.93% after factoring AUM fees, interest expenses??
Did I fuck up the numbers somewhere? I just used what was illustrated in their guidance of the new distributable income.
Anyway, that is enough work for a Sunday.
I have more case study in my REIT Training Center in the Learning about REITs section below. It is free. No upsell. Just to get you level up.
Do Like Me on Facebook. I share some tidbits that is not on the blog post there often.
Here are My Topical Resources on:
- Building Your Wealth Foundation – You know this baseline, your long term wealth should be pretty well managed
- Active Investing – For the active stock investors. My deeper thoughts from my stock investing experience
- Learning about REITs – My Free “Course” on REIT Investing for Beginners and Seasoned Investors
- Dividend Stock Tracker – Track all the common 4-10% yielding dividend stocks in SG
- Free Stock Portfolio Tracking Google Sheets that many love
- Retirement Planning, Financial Independence and Spending down money – My deep dive into how much you need to achieve these, and the different ways you can be financially free
Kyith is the Owner and Sole Writer behind Investment Moats. Readers tune in to Investment Moats to learn and build stronger, firmer wealth foundations, how to have a Passive investment strategy, know more about investing in REITs and the nuts and bolts of Active Investing.
Readers also follow Kyith to learn how to plan well for Financial Security and Financial Independence.
Kyith worked as an IT operations engineer from 2004 to 2019. Currently, he works as a Senior Solutions Specialist in Insurance Start-up Havend. All opinions on Investment Moats are his own and does not represent the views of Providend.
You can view Kyith's current portfolio here, which uses his Free Google Stock Portfolio Tracker.
His investment broker of choice is Interactive Brokers, which allows him to invest in securities from different exchanges all over the world, at very low commission rates, without custodian fees, near spot currency rates.
You can read more about Kyith here.
- My Dividend Experience Investing in UCITS iShares iBond Maturing in 2028. - April 23, 2024
- We Invest into Popular Funds When They Are Popular, Exactly When They Started Turning to Shxt. - April 22, 2024
- Meal Prep 2.0 – Cooking Your “Go-to” Meal that You Look Forward to Eating Everyday. - April 21, 2024