I have been looking at the financial independence retire early space for a while and one of my pet projects is to study how to create this perpetual income portfolio that provides a consistent inflation-adjusted income stream in a passive manner.
So far, here is how we set it up based on my years of looking into this:
- Delegate the management of the portfolio to someone. This is how you make it passive. If you are doing a lot of the job of the securities selection, rebalancing, adjustment during key market events, accounting for dividends, your solution is not truly passive.
- The portfolio needs a certain level of return which is related to how long you wish the money to last. If you require the income to last a long time, due to the unpredictability of the world, you will need a buffer for returns. This affects your required allocation to higher risk, higher return assets like equity. If you need the money to last perpetually, you may need to allocation 60-80% of your assets to equity to ensure that the potential return of the portfolio to be higher.
- The initial amount you design to take out of your portfolio needs to be conservative relative to the capital of your portfolio. For subsequent years, you will adjust your income taken out by last year’s inflation or the prevailing inflation needs. What kills a perpetual income plan is spending too much relative to the current portfolio value, especially when the portfolio is severely down. But the bigger issue is the need to ramp up your spending during high inflation years and you have no way of capping it.
- Your portfolio cannot be too volatile. All-in equities or cryptos with high returns may not mean you can take out a larger initial income relative to your portfolio value because volatility does matter.
How to Create a Perpetual, Passive, Inflation-adjusted Income Solution
So given the principles that we mentioned before, the ideal solution up to now is:
- A portfolio that is largely managed by the fund manager(s) with an investment philosophy you understand and believe can capture the return, in a low-cost manner. This can be an indexed portfolio, a smart beta portfolio, a boutique risk-parity or an all-weather strategy.
- You will manage the assessment of how much income to take out from the portfolio, how to take it out yourself if you are sophisticated about retirement spending down, or have a sophisticated adviser specialised in income spend-down strategy to manage this.
- Have at least 70%-80% of your money in higher potential assets like equities. Due to the future low return potential of bonds, the equities and equivalent will have to do more heavy lifting. If you have a managed solution that can give (with strong evidence) equity-like returns but lower volatility that is a consideration.
In the end, it boils down to these principles.
I accidentally chanced upon the working of Breaking the Market which explains the “Your portfolio cannot be too volatile” part of the perpetual income principle in math.
How Spending Too Much Creates High Stress on Your Income Portfolio
A lot of people will agree that spending income plus having a negative sequence of return (read sequence of return and possible solutions) in the market kills the portfolio but we will always talk about the exact historical sequence.
Breaking the market tries to look at things from random sequences.

In the table above, he showed 22 different sequences of return. Each of these sequences has the same standard deviation and the compounded rate of return.
The starting amount is 500 and ends with 304.
The growth rate is -2.46% due to volatility drag. It is a bit complicated but you can read up on it but I don’t want to discuss this today.
The returns are geometric returns, which means you multiply the returns instead of adding the returns.
The 22 portfolios are without spending.
So let us spend 5 from our initial portfolio of 500 each year. That is equivalent to 1% of the initial portfolio value.

If we factor in spending, you will observe in column 20, the ending portfolio value is different.
Row 21 has a cluster of downward moves from 4 to 11 which make this the worst sequence.
Row 22 has a cluster of upward moves early which makes it the best sequence.
He also showed that if the return is arithmetic and you spend from it, the sequence of return does not matter. The problem of sequence occurs due to this mixture of multiplication and subtraction.
Interestingly, the solution to pushing your returns from too geometric to become arithmetic seems to be constant rebalancing.
Why Volatility and Spending too much together Stresses the Income Portfolio
The main reason how volatility and high spending is a potent, negative combination is that together they increase the number of returns your portfolio needs to break even.
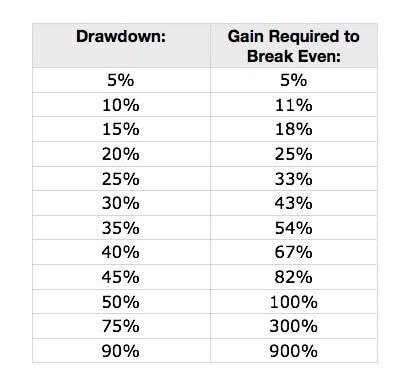
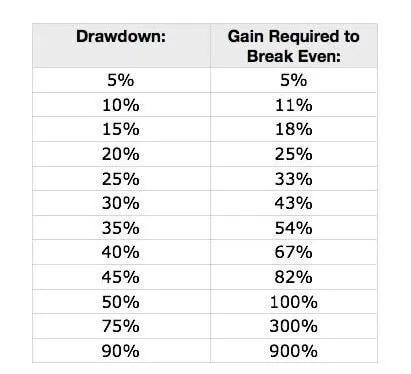
A lot of us know the table of how much return you need to return to break even for different portfolio drawdowns.
Most of us do not handle a big portfolio drawdown well. We start having second thoughts, strange thoughts about the portfolio. A lot sell out hoping they can buy in cheaper.
But most do not.
So they get the drawdown, but they miss the return.
When you take out an income from the portfolio, that is like an additional drawdown.
For example, suppose going back to the same example, you will spend 10% of your portfolio.
If the portfolio is down 20%, in theory, you will need a 25% gain to break even. But you subtract another 10% for your spending, your portfolio is down 30%.
So we need 90%/70% = 28.6% to break even, which is greater than the 25%.
If the portfolio volatility is halved.
If the portfolio is down 10%, in theory, you will need 11% to break even. If you subtract another 10% for the spending, your portfolio is down 20%.
You will need 90%/80% = 12.5% to break even. It is still a drag but lesser versus 11%.
Now imagine this taking place over a few years.
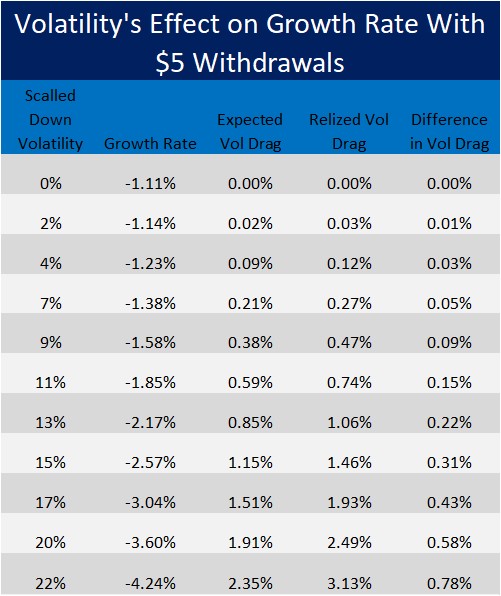
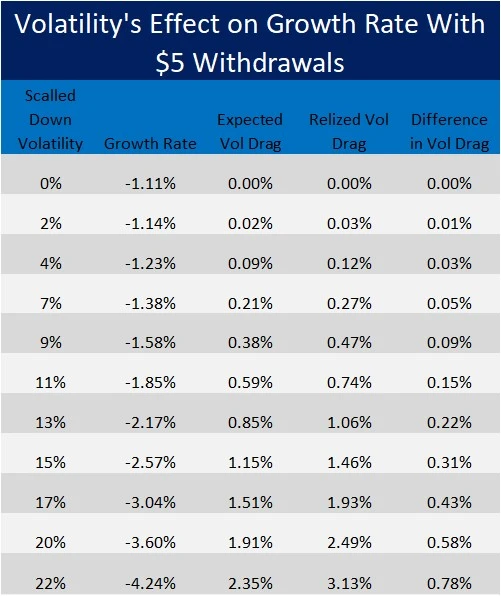
Breaking the Market has this table where he shows the effect of different portfolio volatility and the difference in growth rate.
In the first column, you can imagine your small-cap value fund having portfolio volatility of 22%. You have various ways to dampen the losses with a high-quality bond portfolio (not your junk bonds or investment-grade bond) such that the volatility is scaled down.
The negative growth rate in the second column can go down accordingly.
The third to fifth column probably shows as you get up to 13% volatility, that drag on volatility becomes significant.
How Different Spending Rates and Volatility Impact your Income Portfolio
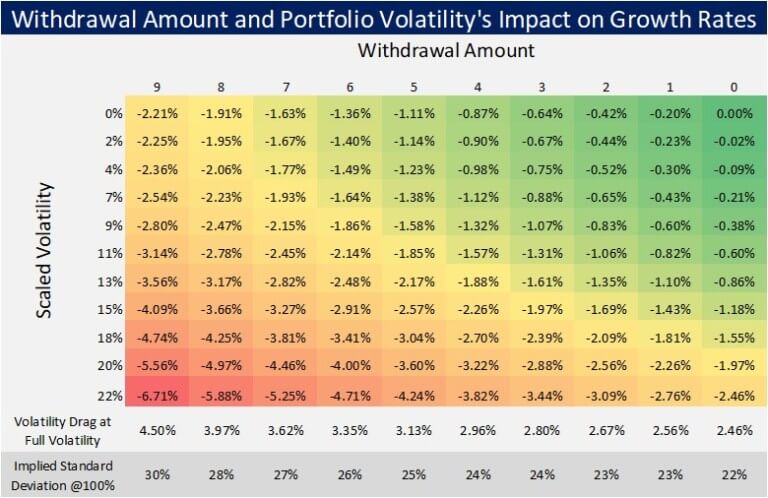
So he provides this table showing the negative return depending on the volatility (0 to 22% on the vertical) and withdrawal amount (0-9% on the horizontal).
The common idea is that if you have a portfolio of 100% growth stocks or small-cap value, it should give you a higher withdrawal amount.
But if you look at the columns 7 to 9 and the last three rows, those are some big drags.
If your high return comes without volatility, you could in theory spend that 7-9% without worry.
But with volatility coming into the picture, that becomes a problem.
If we were to look at our plan, which is to go 70-80% equities, that will not dampen volatility much.
But if we spend between 2-3% (horizontal axis), the drag is between -2.88% to -2.56%. It is still high but not as bad as if you take out 8-9% of your initial portfolio.
Having 10% more bonds/cash dampen the volatility but in real life at the cost of return.
We could have a 60% equity portfolio and 40% bonds and that may bring down the volatility to the 11% to 15% volatility range, but the portfolio returns might be too low.
We need a reasonably high return, lower volatility portfolio strategy
At the end of the day, the math shows that there is this delicate dance between the return you need, volatility and your spending.
My solution is to have a portfolio that has the expectations of a high return but lower the initial income taken out so that it buffers for negative sequences. If we avert that negative sequence, we can scale up the income accordingly.
This 2% to 3% initial income range makes planning during your accumulation years easier.
If someone has a solution for a high return, lower volatility portfolio strategy, that may be ideal.

The risk-parity and permanent portfolio look ideal due to their lower volatility but in my past testing, it shows that it will fail, most likely due to not having enough returns. (Read The Permanent Portfolio Might Do Worse in Retirement than the Traditional Equity Bond Portfolio)
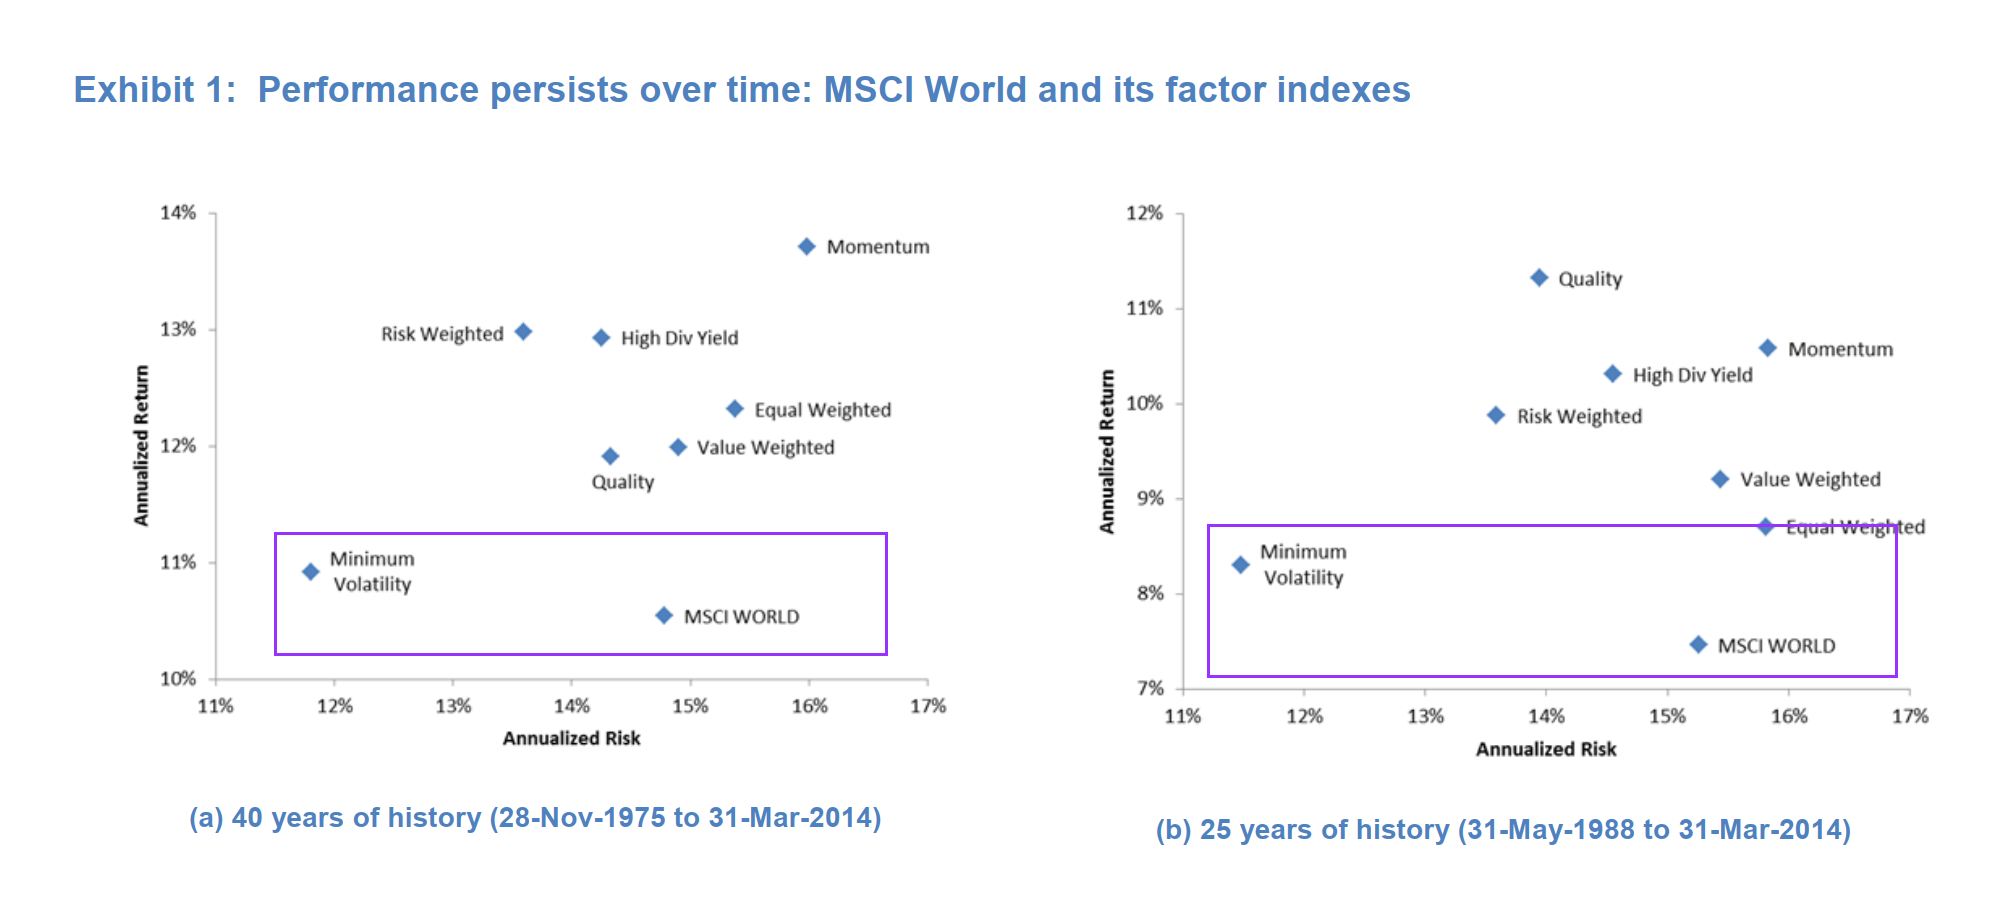
The research from the Smart Beta factor world shows that we could dramatically reduce the volatility and have a higher expected return with a minimum volatility strategy.
This is historical returns, but MSCI’s research shows two different time periods.
Currently, there is an Irish-domiciled UCITS ETF listed on the London Stock Exchange called the iShares Edge MSCI World Minimum Volatility UCITS ETF (MVOL).
Do check out Breaking the Market. He has a lot of nice content in this area if you are a math and investing nut.
Past performances are not indicative of future returns but we really do not have much to work with.
I write about similar retirement, financial independence research under Retirement Planning, Financial Independence and Spending down money section below.
I invested in a diversified portfolio of exchange-traded funds (ETF) and stocks listed in the US, Hong Kong and London.
My preferred broker to trade and custodize my investments is Interactive Brokers. Interactive Brokers allow you to trade in the US, UK, Europe, Singapore, Hong Kong and many other markets. Options as well. There are no minimum monthly charges, very low forex fees for currency exchange, very low commissions for various markets.
To find out more visit Interactive Brokers today.
Join the Investment Moats Telegram channel here. I will share the materials, research, investment data, deals that I come across that enable me to run Investment Moats.


Do Like Me on Facebook. I share some tidbits that are not on the blog post there often. You can also choose to subscribe to my content via the email below.
I break down my resources according to these topics:
- Building Your Wealth Foundation – If you know and apply these simple financial concepts, your long term wealth should be pretty well managed. Find out what they are
- Active Investing – For active stock investors. My deeper thoughts from my stock investing experience
- Learning about REITs – My Free “Course” on REIT Investing for Beginners and Seasoned Investors
- Dividend Stock Tracker – Track all the common 4-10% yielding dividend stocks in SG
- Free Stock Portfolio Tracking Google Sheets that many love
- Retirement Planning, Financial Independence and Spending down money – My deep dive into how much you need to achieve these, and the different ways you can be financially free
- Providend – Where I used to work doing research. Fee-Only Advisory. No Commissions. Financial Independence Advisers and Retirement Specialists. No charge for the first meeting to understand how it works
- Havend – Where I currently work. We wish to deliver commission-based insurance advice in a better way.
Kyith is the Owner and Sole Writer behind Investment Moats. Readers tune in to Investment Moats to learn and build stronger, firmer wealth foundations, how to have a Passive investment strategy, know more about investing in REITs and the nuts and bolts of Active Investing.
Readers also follow Kyith to learn how to plan well for Financial Security and Financial Independence.
Kyith worked as an IT operations engineer from 2004 to 2019. Currently, he works as a Senior Solutions Specialist in Insurance Start-up Havend. All opinions on Investment Moats are his own and does not represent the views of Providend.
You can view Kyith's current portfolio here, which uses his Free Google Stock Portfolio Tracker.
His investment broker of choice is Interactive Brokers, which allows him to invest in securities from different exchanges all over the world, at very low commission rates, without custodian fees, near spot currency rates.
You can read more about Kyith here.
- My Dividend Experience Investing in UCITS iShares iBond Maturing in 2028. - April 23, 2024
- We Invest into Popular Funds When They Are Popular, Exactly When They Started Turning to Shxt. - April 22, 2024
- Meal Prep 2.0 – Cooking Your “Go-to” Meal that You Look Forward to Eating Everyday. - April 21, 2024
Leong
Sunday 10th of October 2021
Agree with your article. An interesting thought here, taking an extreme example, why not have 100% S-REITs? Through-cycle, S-REITs have about 4.5% yield at entry. And after entry, reasonable to assume dividends will grow with inflation. That enables 4.5% withdrawal rate, without ever touching principal.
Besides S-REITs, may also add SG Banks into the allocation with its high and stable dividends. Example: OCBC never decreased dividends, save for the recent covid period where it was MAS-mandated. May also add China Big-4 Banks into the allocation. China Banks may be (very) poor in terms of capital price gains, but they pay high dividends. Amongst the Big-4 Chinese, in the past 10 years, they average increased dividends for 8 years and decreased dividends for 2 years.
Thus, an practical asset allocation may look like: 60% Yield (REITs, SG Banks, CN Banks if suits), 20% ETF global equities (IWDA), 20% ETF bond (MBH). 60% yield to anchor income for withdrawal. 20% global equities for growth returns. 20% bonds to rebalance into growth equities during sharp market sell-offs.
KLKK
Friday 15th of October 2021
@Leong,
I have also thought about this S-Reit+Chinese Bank to satisfy the income portion before.
For Reits, I would probably buy ETF (either Lion or NikkoAM-STC Asia Reit) rather than individual reits when I retire. I would rather pay the management fees (60bps?) and sacrifice some growth for peace of mind rather than getting individual reits that can bombed out (Eagle, Lippo anyone?).
For Chinese banks, I am a bit hesitant as they are called by CCP to do national service every now and then (i.e. to prop up any ailing sector not too different from our local banks). But I will buy the Big 4 should market goes into tailspin. I own the Big 4 Chinese banks at different points in time and still have some CCB and ICBC and their gross dividends can reach 6-8% (but share price falls hard ex-div). Do take note of the 10% HK withholding tax and admin charges (for dividend processing) regardless of the platform you use (I use Vickers).
In any case, it pays to differentiate between buying for income or income growth as the growth part can be limited (especially for reits because of 90% payout and shares get diluted from private placement or rights offering ever so often).
Kyith
Friday 15th of October 2021
I think the time period is too short to conclude they never cut dividends. For a long while, the banks have been paying lower dividends, and it's only recently they raised it. What we are coming from is to look at the returns as total returns. within these IWDA, there are stocks that have so much free cash flow that in theory... they can pay an inflation-adjusted 3% dividend yield but they choose not to. I came from a dividend investing background so I know that model. I think its a dream of many that dividends do not get cut and you still get inflation-adjustment. That model... requires an active management of a few selected dividend stocks. That is something to think about. During our course of work, we have to do some pro-bono cases to advise on widows whose husband have left them with a group of dividend stocks. They have no idea what to do with it. The husband did not leave the instructions, and instill enough confidence for the wife to manage it. Some things to think about.