My co-worker shared with me a 2023 Morningstar Investor Returns Around the World report.
This report should rename how investors often invest exactly at the wrong time.
The Mind the Gap report measures the investors’ returns against the performance of the fund or ETF. This is the more international edition. If you are interested, you can fill in your details and get the report here.
Here is some information about the methodology used by the Morningstar team:
- Morningstar (MS) measures based on total returns (capital gains + dividends) published by funds on their factsheets and website.
- They measure investors returns which are money-weighted returns against fund returns which are time-weighted returns. Money-weighted returns is your IRR returns which means that if there is large fund inflows into the fund or large outflows into the funds, the impact of those flows impacts the investors return.
- What #2 means is that this is not measured based on each individual investors of the fund’s returns but the returns as a collective. This means that if you made shrewd decisions, it would not show up easily in this data.
- MS does not collect the actual fund flows of the company but the flows that can be estimated as the change in assets. I suspect it is based by the month by month change in AUM from the factsheets.
- A Behavior Gap is calculated as the difference between the investor return and the total return averages within a group.
In general, based on the fund flows, the investors as a cohort did worse than the fund performance.
I don’t think we can conclude that a single investor in the fund is poor, and thus, an investor would be better off with an adviser.
However, the fund flows of certain funds do show that investors tend to be attracted to funds that have performed outstandingly recently and would pile into the investment at the wrong time.
Even though the fund returns, as shown in factsheets, look decent or good, the investor’s personal returns look poor because they invested when the funds became popular, which usually coincides with lower expected future returns.
This is not always true but in many of the case study, we see a substantial rise in AUM from smaller AUM at exactly the wrong time.
Essentially, it is not just the fund; investors partly bear the blame for poor performance.
Funds mentioned:
- iShares Global Clean Energy ETF
- abrdn Global Absolute Return
- Allianz Income & Growth
- Baillie Gifford
- JPMorgan China Pioneer
- JPMorgan Pacific Technology
- iShares Barclays Cap High Yield
- First Sentier Bridge.
The iShares Global Clean Energy ETF (INRG) Case Study
This is a GBP-denominated ETF that you can invest into that is listed on the London Stock Exchange. MS use this as an example of bad timing in the popular energy transition space.
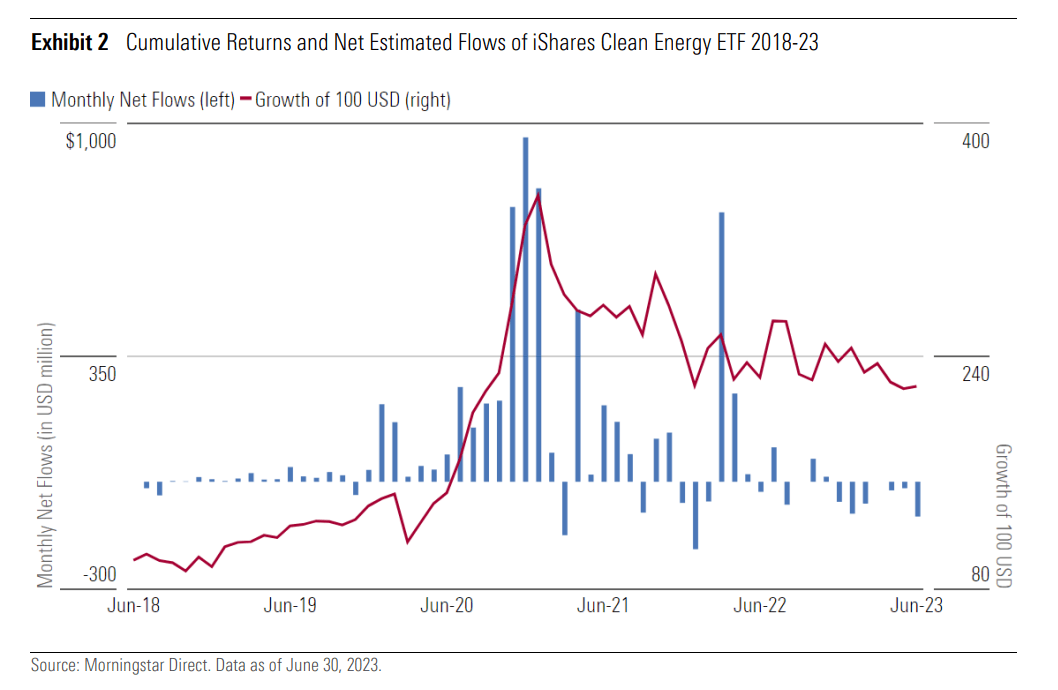
“Money pouring into one of the largest funds in the alternative energy Morningstar Category, iShares Global Clean Energy ETF INRG, caused its fund size to double through 2020 to over USD 6 billion in January 2021 (Kyith: the flows depicted in blue bars).
After the whopping 140% return in 2020 (in USD), the ETF experienced two consecutive calendar years in the red, and flows have dissipated.
As a result, while total returns showed the funds performing 17% annualized over the 2018 to 2023 period, the estimated investor return was negative 3.0% as most investors had entered the fund only after its strong returns, just in time to experience the subsequent underperformance.”
The abrdn Global Absolute Return (GARS) Case Study
MS also highlighted that there is a positive behavioural gap (good) in the UK Alternative funds segment, a fund that contributed to the fall from grace.
“One of the contributors was the fall from grace of the abrdn Global Absolute Return Strategies (GARS) fund (GB00B28S0218).
The lacklustre performance profile started to see investors exit, but the bulk of the outflows occurred at the start of the period, and most investors thus avoided the larger losses incurred in the most recent years (2022, 2023).
Assets under management in the U.K.-domiciled version of the fund stood at GBP 17.1 billion at the start of the analysis period (Jun 30, 2018) and give years on capitulated to GBP 860 million.
The firm has since announced it will be merging the fund’s remaining assets into another strategy.”
Most investors cannot sit in a fund with poor performance.
The Allianz Income and Growth Case Study
Even my “favorite” Allianz Income and Growth gets a mentioned:
“Compared with other asset classes, multi-asset fund investors were better off in the cross-border market, losing only slightly to the returns of a hypothetical buy-and-hold investor.
One of the major headaches was Allianz Income and Growth (LU06852299519), Europe’s largest allocation fund, which hand more than USD 40 billion of assets at the end of June 2023.
The fund’s assets rose rapidly over 2020 as investors were swayed by its high returns and income distributions.
Unfortunately, most investor flows entered the fund just before a more difficult period, leading investor returns in the fund to lag total returns by 1.2 percentage points asset-weighted.”
The Baillie Gifford Case Studies
If we stay in the United Kingdom, sometimes returns look better than those bought and held due to short-term luck. If you sell out, it may avert you from some large draw downs:
“In a comparison between UK’s equity asset managers, Baillie Gifford is among the managers with an overall negative gap.
Counterintuitively, however, the company’s most volatile fund, Baillie Gifford Long Term Global Growth (GB00BD5Z0Z54), in fact, had a positive gap.
The fund had outflows in each of the last five calendar years. Its investor base is biased toward institutions and pension funds, and the largest outflows came in the second half of calendar-year 2020.
As outflows continued in 2022, a much smaller proportion of assets went through the near-40% drawdown in 2022.
In contrast, two Baillie Gifford funds, International (GB0005941272) and Global Alpha Growth (GB00B61DJ021), saw gaps deep in negative territory.
Their performance profile was similar to the Long Term Global Growth fund, but the flows profile was strikingly different: Positive flows in 2020 were loaded toward the later part of the year when performance started to turn, and large inflows continued in 2021 despite the sharp decline in these funds’ values.”
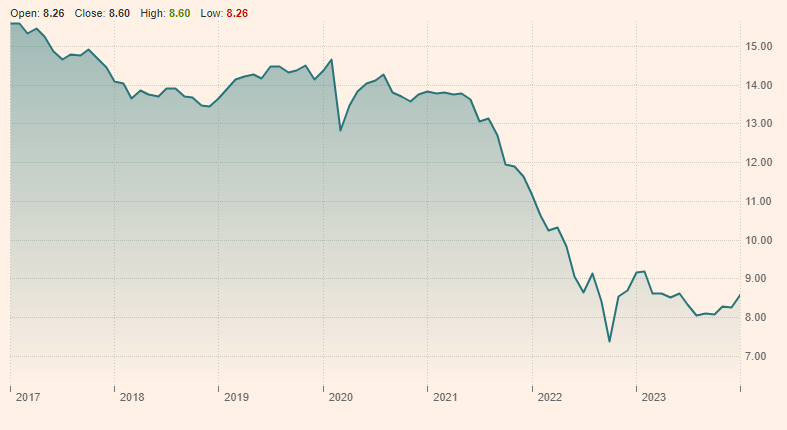
The JPMorgan China Pioneer A-Share and JPMorgan Pacific Technology fund Case Study
“Generally, these major index-trackers experienced more steady flows over time, in part because they benefited from the regular contributions of the Mandatory Provident Fund scheme, a compulsory pension system in Hong Kong.
In contrast, flows of popular active funds were often more erratic. Active funds are typically sold by distributors as stand-alone products in Hong Kong rather than as building blocks to construct a diversified portfolio.
This creates incentives for performance-chasing behaviour and ill-timed decisions.
For example, the largest active China A-shares equity fund – JPMorgan China Pioneer A-Share (HK0000055621) – showed a negative gap of 3.8 percentage points per year, with poor timing fully eliminating the 3.43% annualized total returns and then some.
Investors who redeemed money prior to the sharp rally in 2020 and subsequently poured new money into the fund right before the market selloff that began in mid-2021.
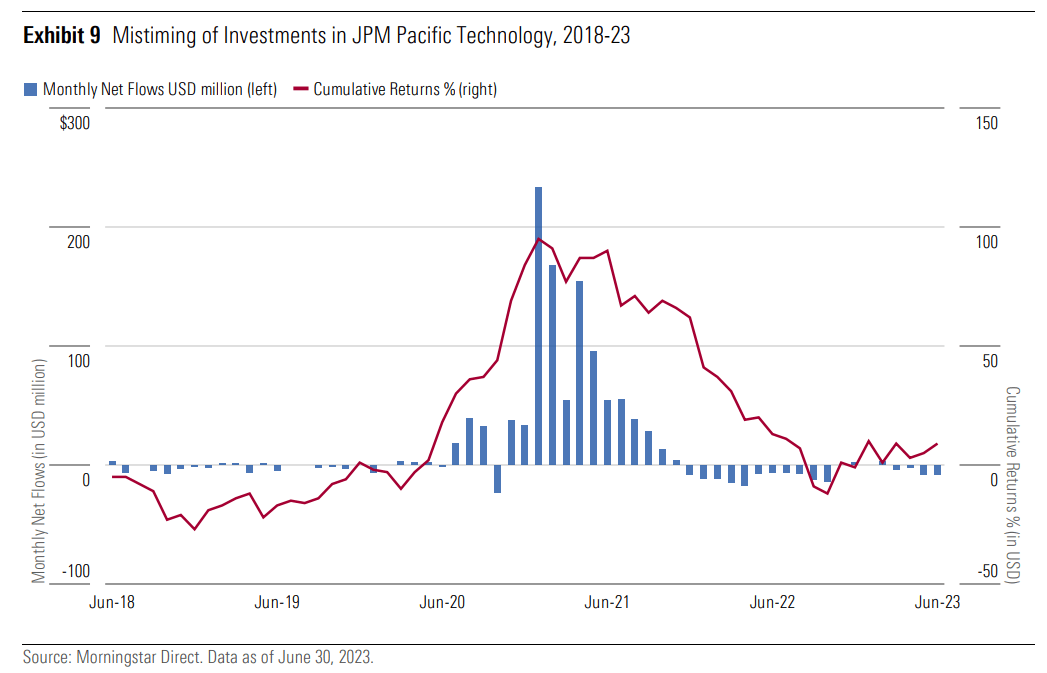
An even more striking example for the harmful impact of flows is the sector equity technology Morningstar Category, which exhibited the widest negative gap of 17.2 percentage points per year among all equity categories.
This was predominantly due to the JPMorgan Pacific Technology fund (HK0000055761), which saw deeply negative investor returns. This fund’s 82% returns in 2020 fueled skyrocketing inflows between late 2020 and early 2021, meaning an average investor likely missed out on the prior rally and suffered an ensuing peak-to-through drawdown of 55% through October 2022.”
iShares Barclays Cap USD Asia High Yield Bond ETF and First Sentier Bridge Fund Case Study
“In the Asia high-yield bond category, iShares Barclays Cap USD Asia High Yield bond ETF (ISIN: SG2D83975482) suffered a large gap of 12.3 percentage points due to substantial inflows into the fund following its peak in May 2021, which bloated its assets from below USD 400 million to over USD 2 billion, only to see the returns plummet after.
About 80% of allocation fund assets resided in the Asia allocation category, which fared worst among allocation categories.
This was driven by the largest fund, First Sentier Bridge Fund (SG9999002067), which saw large inflows following its strong performance between 2019 and 2021 before returns trended downward.”
If you want to trade these stocks I mentioned, you can open an account with Interactive Brokers. Interactive Brokers is the leading low-cost and efficient broker I use and trust to invest & trade my holdings in Singapore, the United States, London Stock Exchange and Hong Kong Stock Exchange. They allow you to trade stocks, ETFs, options, futures, forex, bonds and funds worldwide from a single integrated account.
You can read more about my thoughts about Interactive Brokers in this Interactive Brokers Deep Dive Series, starting with how to create & fund your Interactive Brokers account easily.
Kyith is the Owner and Sole Writer behind Investment Moats. Readers tune in to Investment Moats to learn and build stronger, firmer wealth foundations, how to have a Passive investment strategy, know more about investing in REITs and the nuts and bolts of Active Investing.
Readers also follow Kyith to learn how to plan well for Financial Security and Financial Independence.
Kyith worked as an IT operations engineer from 2004 to 2019. Currently, he works as a Senior Solutions Specialist in Insurance Start-up Havend. All opinions on Investment Moats are his own and does not represent the views of Providend.
You can view Kyith's current portfolio here, which uses his Free Google Stock Portfolio Tracker.
His investment broker of choice is Interactive Brokers, which allows him to invest in securities from different exchanges all over the world, at very low commission rates, without custodian fees, near spot currency rates.
You can read more about Kyith here.