The concept of the safe withdrawal rate (SWR for short) framework is something that I find challenging to explain to my readers, friends, and co-workers. To get them to understand is equally difficult. Getting them to accept, which means to relegate their existing income strategy to a lower importance, is even more difficult.
I had this lively debate with someone regarding how important is asset allocation in our income strategy.
My exact words:
“Asset allocation doesn’t matter at all.”
That is probably taking things a little too super far.
Whether we put in cash, or bonds, or equity, or a different percentage of the allocation does matter to a certain degree.
Asset allocation determines your return:
- Equity historically has given higher realised return but is highly volatile.
- Fixed income historically has given decent returns, but lower than equity, and has lower volatility.
- Cash is not volatile at all, but the returns are low.
Your asset allocation affects your return.
When I talk to someone whose worldview is that asset allocation is the most important when it comes to income planning, then the statement above means I am trying to reason asset allocation is not the most important factor to an income strategy.
For sure, asset allocation fxxking matters to certain degree la.
However, if we ask ourselves:
What is the most critical factor when determining if our income strategy is conservative enough?
Would asset allocation rank all the way at the top?
What does rank all the way at the top means?
This means that if:
- I have an asset allocation that leans more sound, my income plan becomes more conservative.
- I have an asset allocation that leans more risky, my income plan becomes more risky, or less conservative.
This means that asset allocation make or break the plan.
Let Us Test This with A Plan to Have a Consistent, Inflation-Adjusted Income Stream for Thirty Years on a $1 Million Dollar Portfolio.
Suppose Kyith wants an income of $50,000 a year and Kyith wants this to last for thirty-years. Kyith wants this income to preserve his real purchasing power. This means if inflation goes up 10%, Kyith will adjust his spending upwards. If the next year inflation is -4%, Kyith will adjust his income for next year by (100%+(-4%)).
We have 96 years of US inflation, equity, fixed income and short-term bond data from 1928 to 2023. This allows us to simulate if Kyith lived through a thirty-year period that is like the past, would Kyith have an income stream that last that long and preserve his purchasing power.
With 96 years of data, we can have 67 unique 30-year periods.
Again, these are historical data, there is no projected inflation rate nor projected returns. We are just simulating what if the future kind of mirrors one of the 67 unique thirty periods in the past.
Why did I use $50,000 a year?
Because enough novice think 5% is a good ball-park figure that is conservative enough (I was one of those if you don’t know). And I know if we use $50,000, we will definitely run out of money in some of these thirty year periods.
But if asset allocation is so steady, asset allocation will fixed this problem isn’t it?
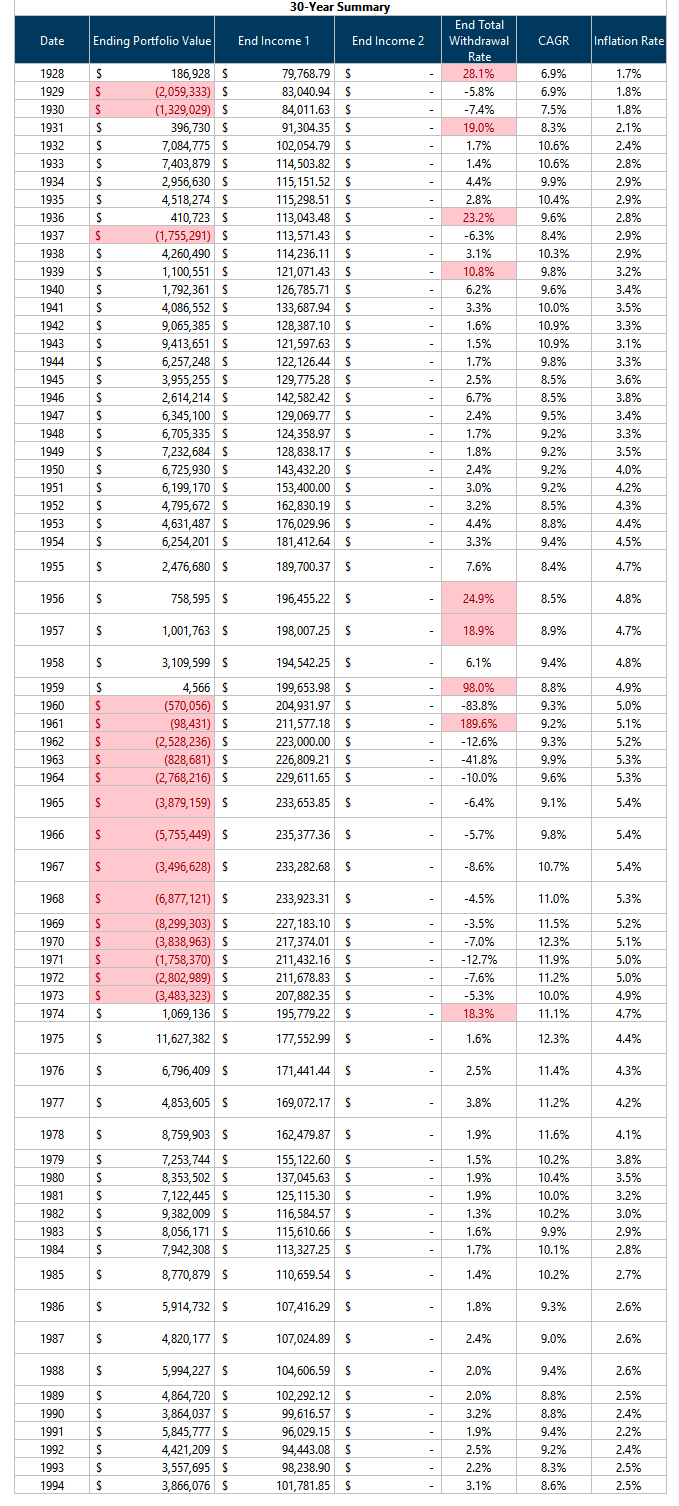
Let’s Start with a 100% Bond Allocation.
If we spend on a portfolio that is 100% in US Five-year treasury, how would the results be?
The table below summarizes the result of making Kyith live through 67 unique 30-year historical sequences:
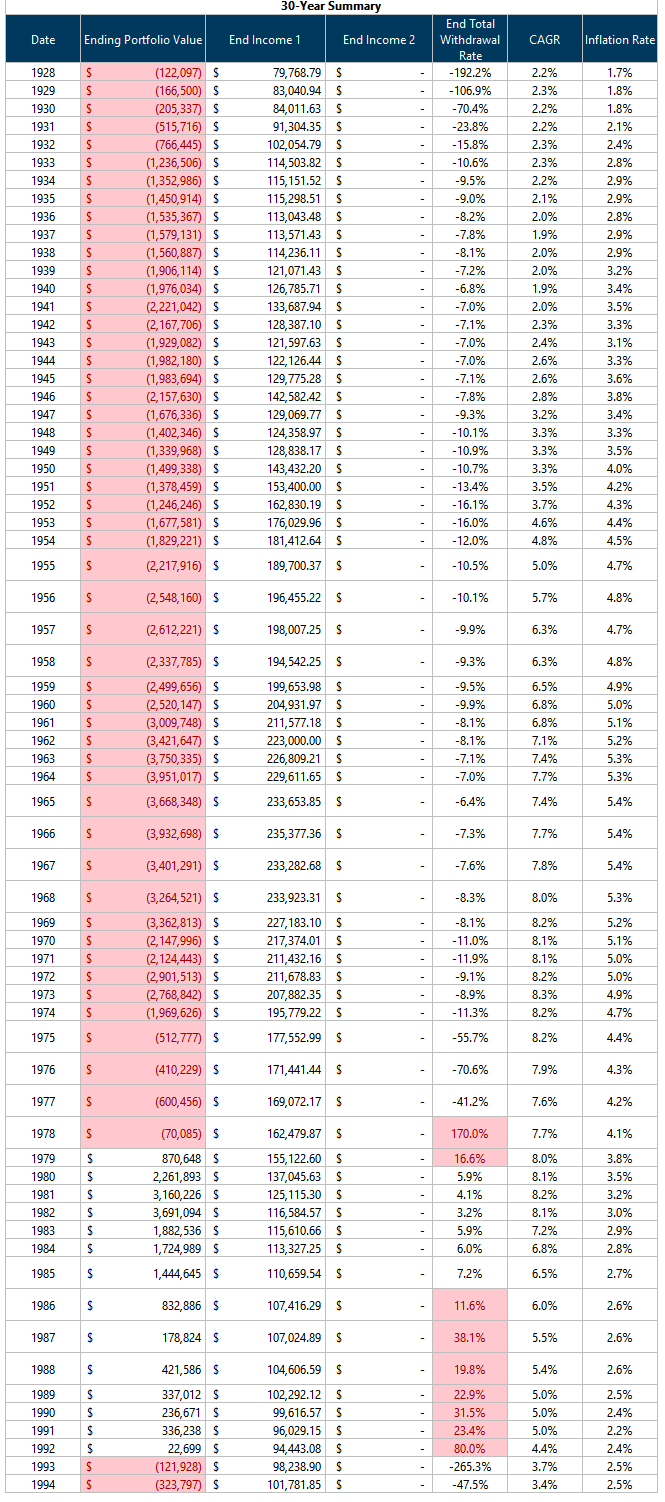
Let me guide you through how to read the table.
There are 67 rows, which represents simulating 67 unique 30-year periods.
- The date shows when the period started. For example, 1928 means the thirty-year period starting in 1928 and ending in 1957. 1929 means the thirty-year period starting in 1929 and ending in 1958 and so forth.
- Ending portfolio value shows the portfolio value at the end of each thirty year period. Red and bracket means the portfolio ran out of money prematurely. White shows how much value is left. For example the 1984 one shows that the Kyith living through 1984 to 2013 has an inflation-adjusted income AND eventually still left with $1.7 million after that.
- End Income 1 shows the income at year 30. Why is the income not $50,000? Because of inflation, you need inflation adjusted income. So in the years of high inflation such as 1966 to 1995, you need $235,377 to preserve the purchasing power of $50,000.
- End Withdrawal rate shows at year 30, if we take the income at year 30 divide by the portfolio value in year 30, what is the withdrawal rate. If this withdrawal rate is still very low (like the 1982 sequence), then it indicates Kyith can still spend the income for many more years.
- CAGR shows the compounded growth rate of that thirty-year sequence. You can see there is NO standard growth rate assumed. The CAGR are all different because returns are always different.
- Inflation rate shows the inflation rate of that thirty-year sequence. Just like CAGR, observe that there are NO STANDARD INFLATION RATE assumed. This is because the inflation you assume is always different.
Now that we got that out of the way, why is there so much red patches in ending portfolio value?
This means that on a 100% fixed income portfolio, unless your inflation and economy is in a very, very sweet spot, Kyith is going to run out of money pre-maturely.
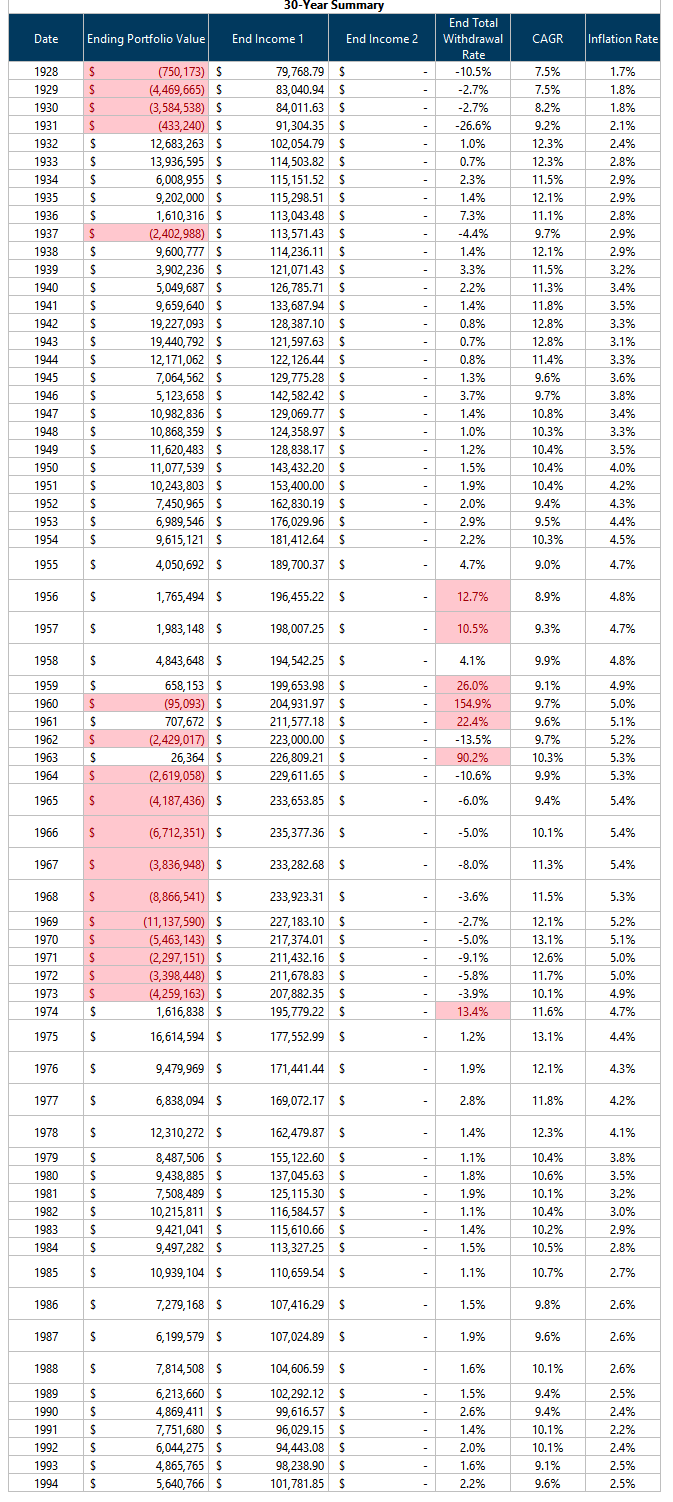
Let’s Increase the Equity Allocation to 20%.
Now let us allocation 20% of the fixed income to S&P 500.
The result is as follows:
By allocating more to equities, you will realize that the money last if Kyith lived through some of those thirty-year sequence.
Those are the periods starting in 1928, 1975 to 1978.
There are still a chunk of outcomes that cannot be saved by shifting the asset allocation.
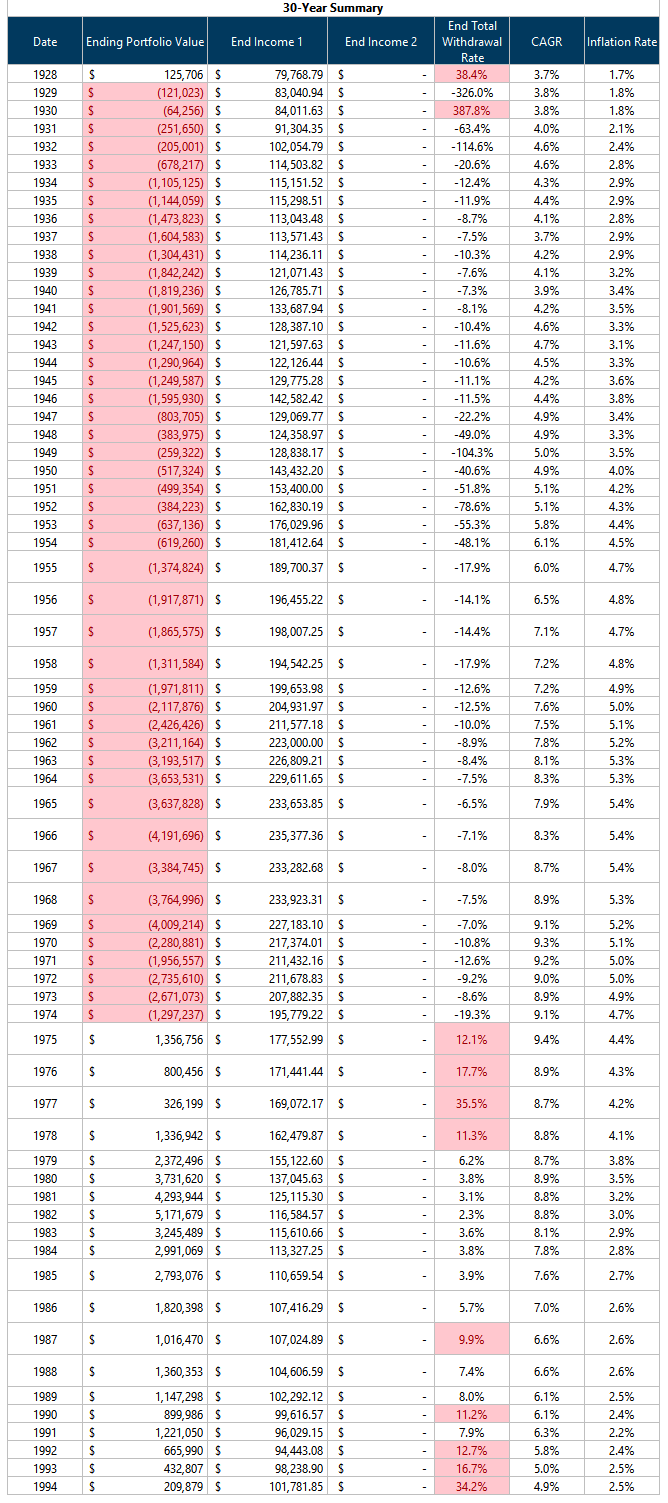
Let’s Increase the Equity Allocation to 40%.
The results:
Much better than 20% equity allocation.
We see that the periods of 1947 to 1954. the 1931 to 1933 having better outcomes.
Let’s Increase the Equity Allocation to 60%.
The legendary 60/40 portfolio:
We have better results, but you may realize that the very deflationary 1929 and the high inflation periods starting in 1960s stubbornly cannot get addressed.
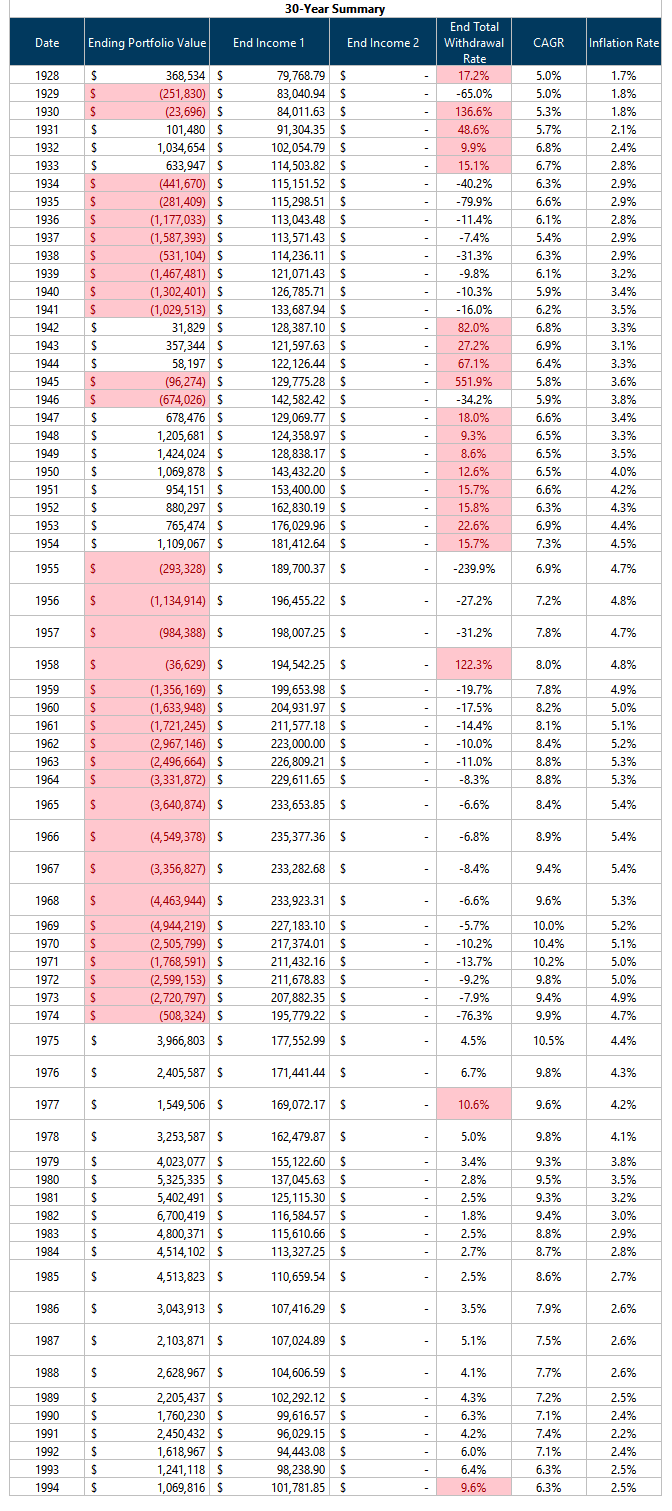
Let’s Increase the Equity Allocation to 80%.
May be it is not enough returns therefore more failure right? So let us just boost the equity allocation to a high 80%:
Not much improvements.
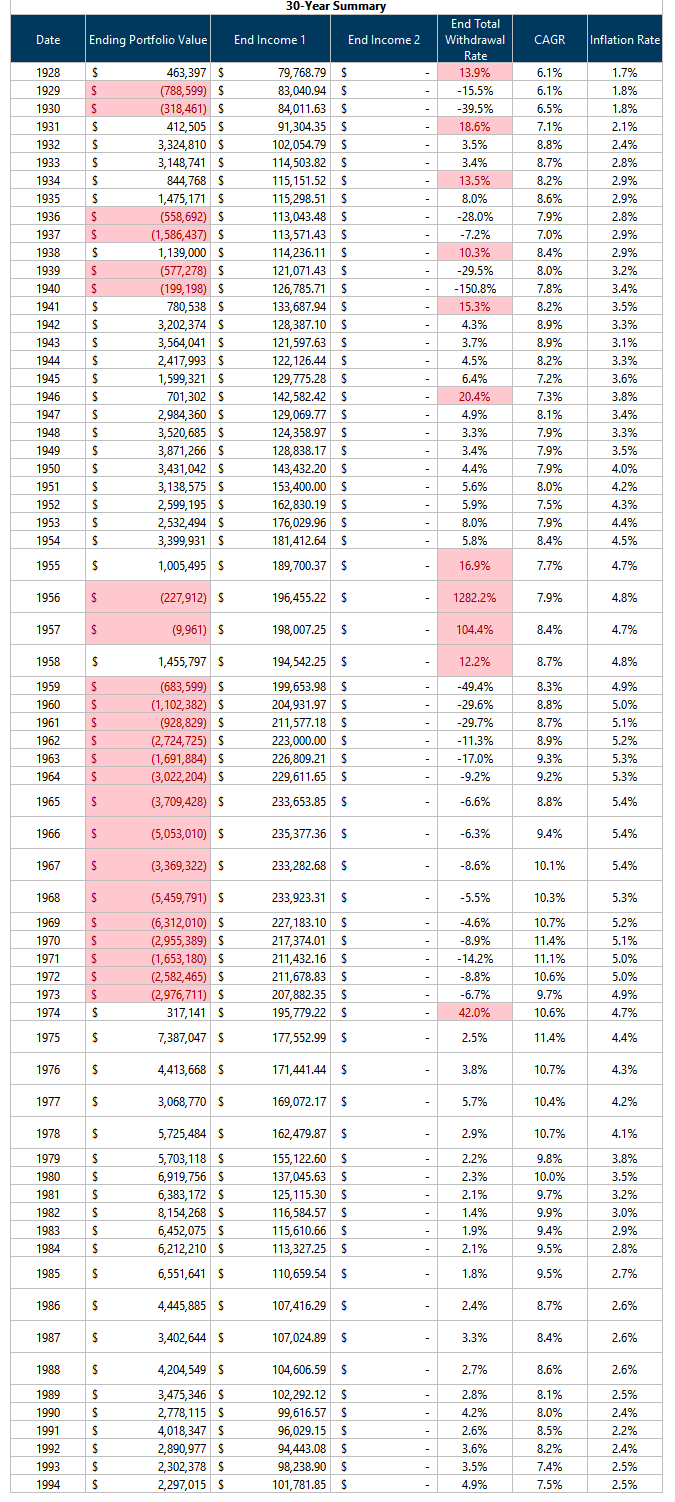
100% Equity Allocation
We tuned the return expectation to the highest:
A 100% equity allocation looks worse than a 80% equity allocation due to the higher volatility.
Returns are not everything.
Changing the equity allocation from 0% to 100%, did not address many of those sequences.
What if We Just Spend an Initial $20,000 instead of $50,000 on a $1 Million 100% Fixed Income Portfolio
Let us go back to our 100% fixed income portfolio allocation, but instead of starting with $50,000, we start with $20,000 instead.
By spending lesser, we are respecting the income-to-portfolio capital ratio by not overspending to remain conservative. This is also call the safe withdrawal rate (SWR).
Here are the results:
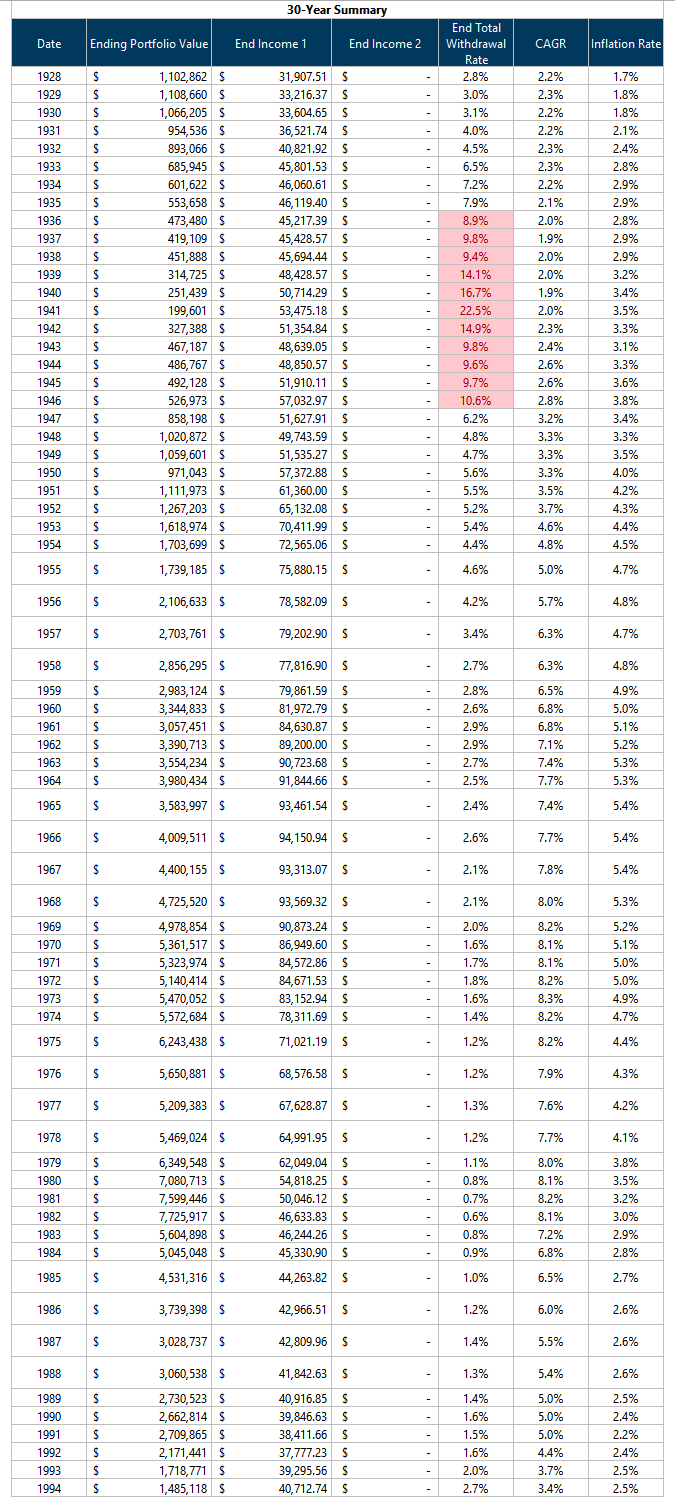
100% of all the Kyith end up with inflation-adjusted income, and still have money left over.
Of course those red patch for the sequence starting in 1936 to 1946 indicates that the portfolio may not last for another 5-10 years.
You might say “Kyith, this is a bit unfair for you to lower the income requirement to that low.”
I don’t dispute that, but the truth is that the SWR ends up being the most critical factor isn’t it?
If I lower it to 0.5% of the portfolio and you cannot do shit with that income, but the portfolio lasts, it still shows that perhaps the SWR is a more critical factor to the safety of your income instead of asset allocation.
By tuning the initial income to $100,000, I can show that all 67 unique sequences will fail.
Data Mining to Prove Asset Allocation Matters
I don’t want to be that guy who just play on availability bias to drive home an argument.
I know what are some of the higher historical return indexes. We could do some sort of data mining to find out the best combination of asset allocation that would make all the 30-year sequences work out.
Well apparently this is the best that I could do:
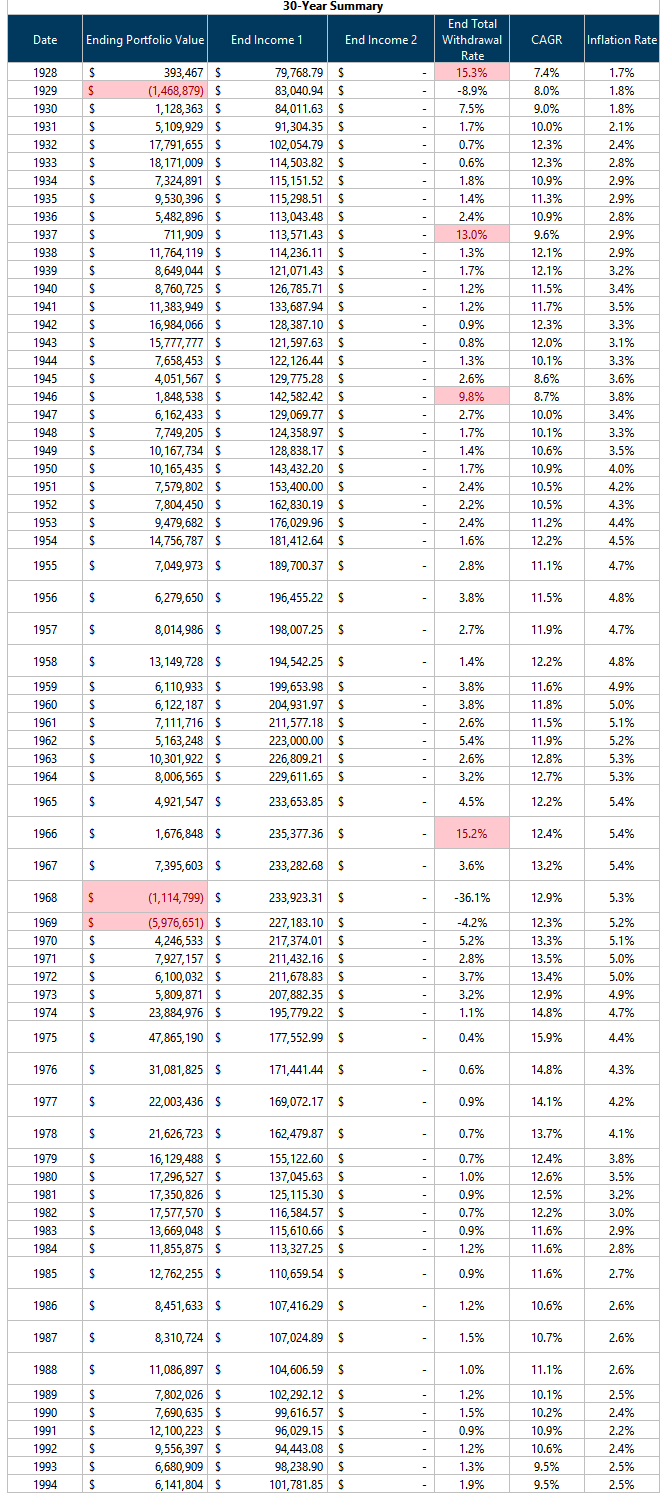
Despite how hard I try, there are STILL three unique 30-year sequences that a retiring Kyith will still run out of money. In many of the other cases, Kyith ended up with $5 million or $10 million even after spending.
What is this asset allocation that is closer?
- Five-year US Treasury: 30%
- Dimensional US Adjusted Market 2 Index: 40% (The 2 in the index means it is a variant of Dimensional’s back-tested index that is more tilted towards value, size and profitability)
- Dimensional US Small Cap Value Index: 30% (Small-cap value is one of the most potent but also violent shit out there historically)
Conclusion
The very fact that if we shift the asset allocation from 100% bonds to some equities improves some of the outcome, some of you may justify that asset allocation makes a difference. The very fact that if Kyith data-mines and can a pretty good outcome, it means asset allocation does matter.
Asset allocation does make a difference but in the grand scheme of things, not as much as respecting the income-to-capital ratio or the safe withdrawal rate.
If we chart it out in order of criticality it would look like this:
- SWR or income-to-portfolio value ratio
- Diversification.
- Reconstitution or rebalancing of the portfolio.
- Asset allocation.
- …
So that settles whether asset allocation matters.
Some may ask: Do we really have the capital or the strategy to take care of all possible 30-year challenging situations?
No, but now that you have seen things, can you unsee things?
Some might just take a chance with that and just decide to retire. I am fine with that because we only have one life and we cannot plan for all scenarios.
I am big on knowing roughly what you cannot guard against.
I think it will still be a good outcome if you kinda know you can spend this much, but that if you experience a Great Depression, or high inflation in the initial years and you cannot adjust, your plan may not work out very well.
I invested in a diversified portfolio of exchange-traded funds (ETF) and stocks listed in the US, Hong Kong and London.
My preferred broker to trade and custodize my investments is Interactive Brokers. Interactive Brokers allow you to trade in the US, UK, Europe, Singapore, Hong Kong and many other markets. Options as well. There are no minimum monthly charges, very low forex fees for currency exchange, very low commissions for various markets.
To find out more visit Interactive Brokers today.
Join the Investment Moats Telegram channel here. I will share the materials, research, investment data, deals that I come across that enable me to run Investment Moats.


Do Like Me on Facebook. I share some tidbits that are not on the blog post there often. You can also choose to subscribe to my content via the email below.
I break down my resources according to these topics:
- Building Your Wealth Foundation – If you know and apply these simple financial concepts, your long term wealth should be pretty well managed. Find out what they are
- Active Investing – For active stock investors. My deeper thoughts from my stock investing experience
- Learning about REITs – My Free “Course” on REIT Investing for Beginners and Seasoned Investors
- Dividend Stock Tracker – Track all the common 4-10% yielding dividend stocks in SG
- Free Stock Portfolio Tracking Google Sheets that many love
- Retirement Planning, Financial Independence and Spending down money – My deep dive into how much you need to achieve these, and the different ways you can be financially free
- Providend – Where I used to work doing research. Fee-Only Advisory. No Commissions. Financial Independence Advisers and Retirement Specialists. No charge for the first meeting to understand how it works
- Havend – Where I currently work. We wish to deliver commission-based insurance advice in a better way.
Kyith is the Owner and Sole Writer behind Investment Moats. Readers tune in to Investment Moats to learn and build stronger, firmer wealth foundations, how to have a Passive investment strategy, know more about investing in REITs and the nuts and bolts of Active Investing.
Readers also follow Kyith to learn how to plan well for Financial Security and Financial Independence.
Kyith worked as an IT operations engineer from 2004 to 2019. Currently, he works as a Senior Solutions Specialist in Insurance Start-up Havend. All opinions on Investment Moats are his own and does not represent the views of Providend.
You can view Kyith's current portfolio here, which uses his Free Google Stock Portfolio Tracker.
His investment broker of choice is Interactive Brokers, which allows him to invest in securities from different exchanges all over the world, at very low commission rates, without custodian fees, near spot currency rates.
You can read more about Kyith here.
- My Dividend Experience Investing in UCITS iShares iBond Maturing in 2028. - April 23, 2024
- We Invest into Popular Funds When They Are Popular, Exactly When They Started Turning to Shxt. - April 22, 2024
- Meal Prep 2.0 – Cooking Your “Go-to” Meal that You Look Forward to Eating Everyday. - April 21, 2024
Revhappy
Monday 18th of March 2024
You might have heard the 3 golden words; need, willingness and ability to take risks which determines asset allocation. Here you are mainly focussing on the need part. I think most savvy followers of your blog would have already taken care of the need part. We already have a healthy savings rate and will be most likely targeting something like a 2% SWR.
So, then the question is about ability and willingness. I personally like the 60/40 legendary allocation and I wont tweak it too much based on age or anything. I will most likely just keep it at 60/40, while keeping my SWR at 2%. Any thoughts?
Kyith
Tuesday 19th of March 2024
I wouldn't say asset allocation affects only the need. At Providend, the willingness is affected by our risk tolerance and that determines the asset allocation. The ability is also affected by the asset allocation because if the time horizon is short, we have a shorter break even and therefore cannot deploy so much into equities.
I don't think all my readers know the stuff i just wrote. If they know already, perhaps i would write less of.
Thinknotleft
Sunday 17th of March 2024
Maybe inflation rate should be between (2) - (4) in your list. Inflation may affect a person's withdrawal e.g. one need to withdraw more to have same standard of living if inflation is high.
Most people (including myself) may under-estimate the impact of inflation on the required income to maintain the same standard of living X years later. (This is similar to the usual under-appreciation on the power of compounding.)
Kyith
Monday 18th of March 2024
Hi Thinknotleft, perhaps it is on the list but I am going a fast version with the goal to give people an idea what is important.
To be honest, if you get the SWR right, it does factor in inflation already implicitly. But i get your point.
kklk3
Sunday 17th of March 2024
1) Have you added the dividends generated by S&P every year to your math exercise?
2) What if the annual dividends declared were used to buy more S&P units (instead of cash distributions) every year?
Kyith
Monday 18th of March 2024
Most of the data presented here on investment moats, otherwise stated, are based on total returns. this means dividends are reinvested and factored in and so they considered the dividends already.
kklk3
Sunday 17th of March 2024
Interesting study. 2 questions
1. What is the sweet spot for SWR in a US 80%S&P/20% bond portfolio where all periods are positive (no single cohort runs out of money after 30 years)?
2. Have you tried replicating the same in SG's context? e.g. Pairing a 80% ES3 (STI ETF) with 20% Singapore Bond ETF/Fund and using SG's inflation over last 30~50 years (I don't think we have market return history going back to 1928). Thanks.
Kyith
Monday 18th of March 2024
Given a 0.5% p.a. assume cost the SWR should be somewhere slightly lower than 2.8%.
For number 2, it is not very useful. We have to understand what causes the SWR to be this low. It is having situations such as a depression, or recession plus high inflation. The data we have only extends Singapore in the period where non of these things happen. If we simulate that, it may lead us to a false sense of security.