I posted in my Telegram group regarding a particular recession in the past that kind of reminds me a little of what we are currently going through.
And some members were asking if I would do a deep dive about it.
There is roughly nothing much to analyze as it is just some data but I thought I would present what I tabulated. I got to thank Sean Cheng from Dimensional for pointing me to the Dimensional article that provided a good summary of the 16 US recessions that happen since 1926.
Here is the summary of the US recessions:
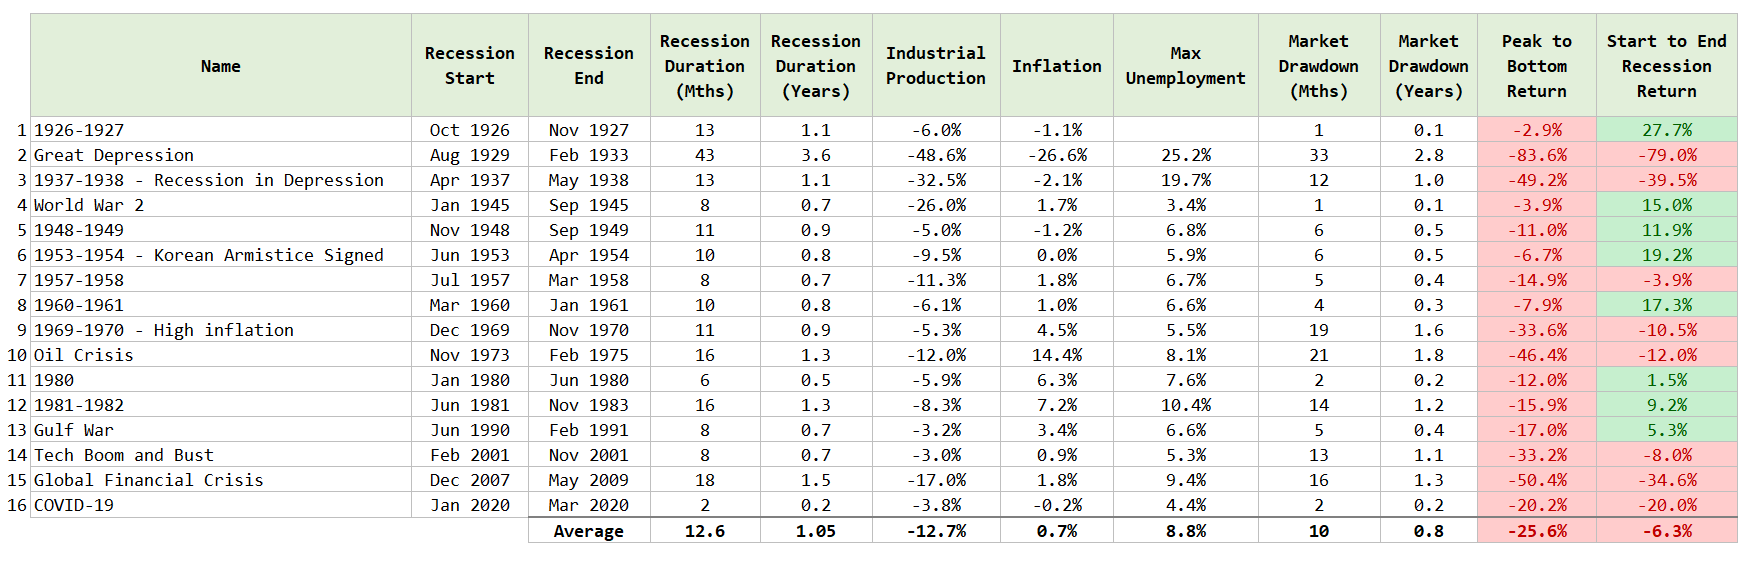
You can see when they started and end. On average, each recession lasted for 1 year with the longest being 3.6 years (Great depression).
For those in retirement planning, you would also notice that during the recessions, there is seldom deflation. This means that your real spending might not stay stagnant or decline during those periods.
A recession does not mean a bear market. The peak-to-bottom return during a recession varies. Some are really tough with 83%, 49%, and 50% falling while others are less than 20%.
If you wait until the recession to exit the market, you would realize that in some years that decision work out well for you but in other years, you missed out on returns.
Here are more data:
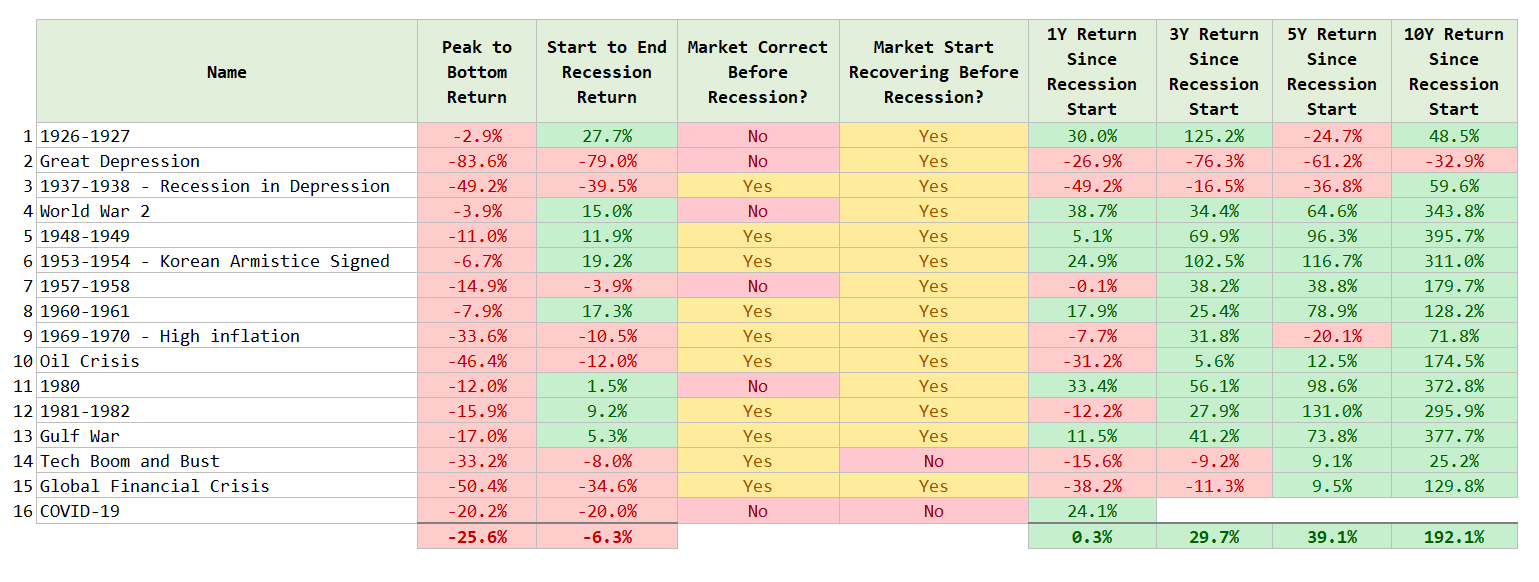
The market data is based on Fama/French Total US Market Research Index. Some correction starts before the official recession, while others start after.
During the majority of the recession, the market started recovering before the end of the recession. Markets are forward-looking most of the time when it comes to light at the end of the tunnel.
I have also tabulated the cumulative 1-year, 3-year, 5-year and 10-year returns since the recession started. There are 1-year periods where you would still be down since the start of the recession. There are periods where you would still be down after 3 and 5 years.
There is even one recession where you would still be down after 10 years.
This is if you are in 100% equities.
Buying and holding is a slow grind of the morale sometimes. Some have asked me what I am more sure of as I get older and I would tell them I am more sure that I am unsure about the sequence of returns that we would live through as I reviewed more data.
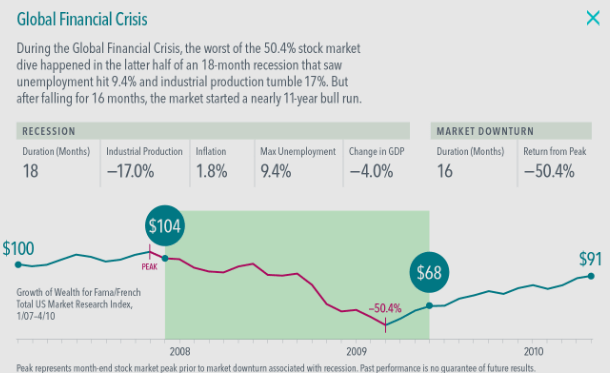
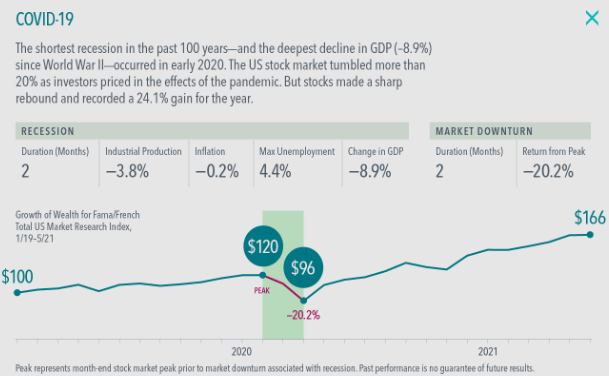
I have a screenshot of each recession for you to appreciate:
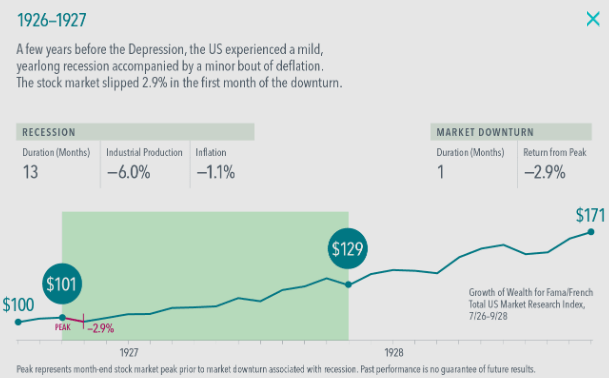
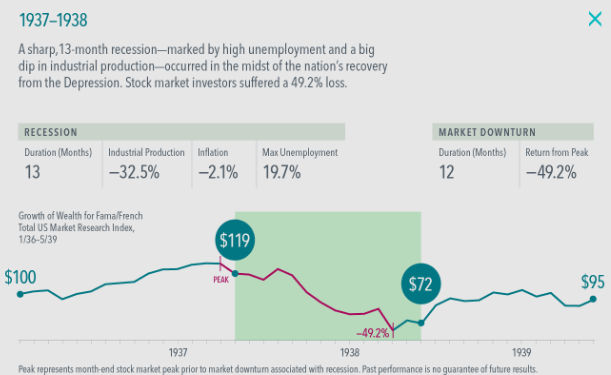
This was a small recession before… the big one. It feels like COVID before… perhaps a bigger one?
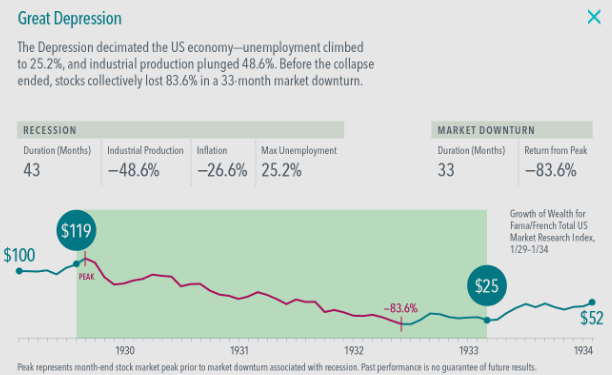
The great depression is brutal. Some would say that this would not happen again and that this is a great outlier. I would say… this is as likely as oil going to be negative and a pandemic happening.

A tiny recession near the end of World War 2.
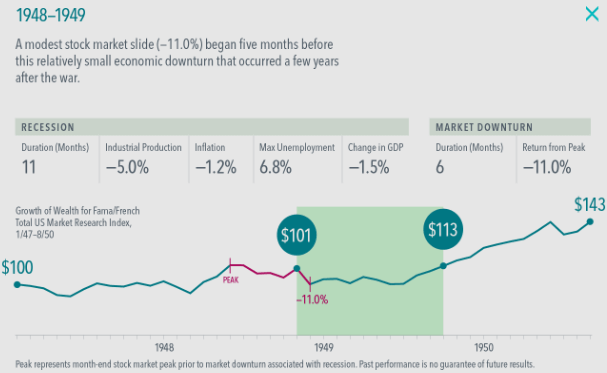
One of the corrections before the recession. Didn’t even turn into an official bear market.

If you decide to sell at the start of this recession, you would look pretty stupid.
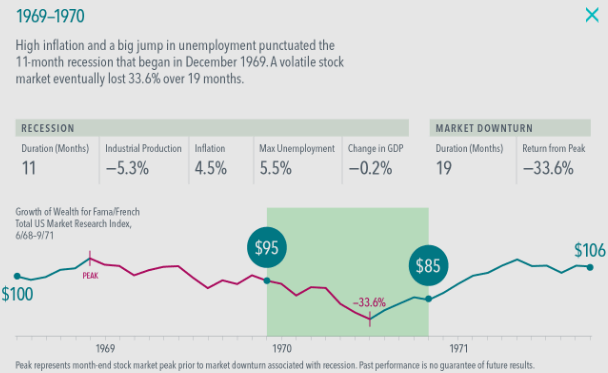
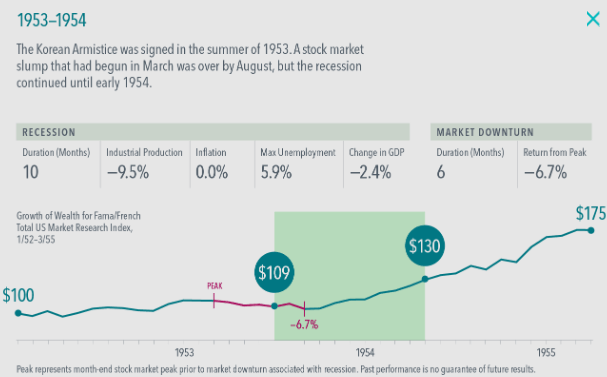
The market started falling long before the recession. The drawdown eventually became 33%.
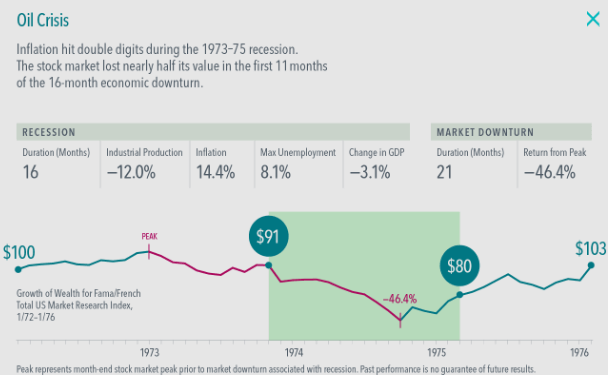
4 years later, we had an oil crisis and inflation of 14%. This is when the US is much more dependent on oil and inflation was manageable at 8%. After that 33% fall, we had a 46% fall this time around.

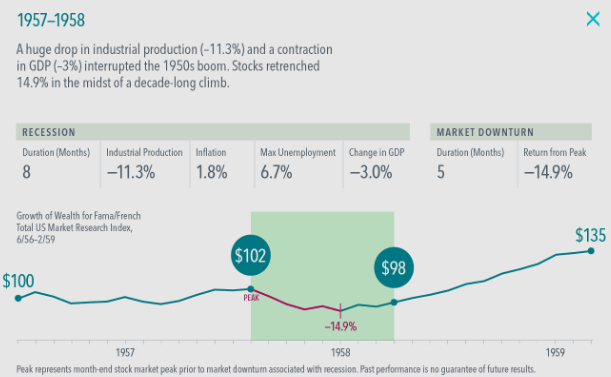
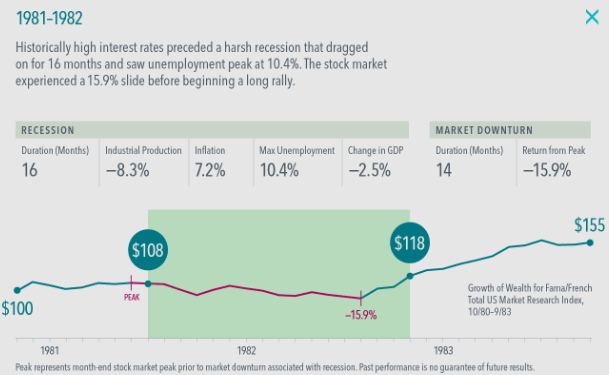
We enter the year I was born with relatively high inflation but lower than the 1970s with a small correction in the recession.
After the recession ended, we had another recession.

Gulf War was manageable.
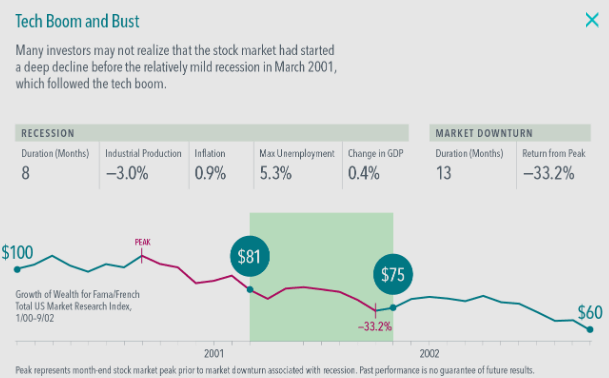
The prices started falling before the recession came about during the Dot Com bust. The index went down 33%.
The drop started quite close to the start of the recession.
You guys should remember this one quite well.
I invested in a diversified portfolio of exchange-traded funds (ETF) and stocks listed in the US, Hong Kong and London.
My preferred broker to trade and custodize my investments is Interactive Brokers. Interactive Brokers allow you to trade in the US, UK, Europe, Singapore, Hong Kong and many other markets. Options as well. There are no minimum monthly charges, very low forex fees for currency exchange, very low commissions for various markets.
To find out more visit Interactive Brokers today.
Join the Investment Moats Telegram channel here. I will share the materials, research, investment data, deals that I come across that enable me to run Investment Moats.


Do Like Me on Facebook. I share some tidbits that are not on the blog post there often. You can also choose to subscribe to my content via the email below.
I break down my resources according to these topics:
- Building Your Wealth Foundation – If you know and apply these simple financial concepts, your long term wealth should be pretty well managed. Find out what they are
- Active Investing – For active stock investors. My deeper thoughts from my stock investing experience
- Learning about REITs – My Free “Course” on REIT Investing for Beginners and Seasoned Investors
- Dividend Stock Tracker – Track all the common 4-10% yielding dividend stocks in SG
- Free Stock Portfolio Tracking Google Sheets that many love
- Retirement Planning, Financial Independence and Spending down money – My deep dive into how much you need to achieve these, and the different ways you can be financially free
- Providend – Where I used to work doing research. Fee-Only Advisory. No Commissions. Financial Independence Advisers and Retirement Specialists. No charge for the first meeting to understand how it works
- Havend – Where I currently work. We wish to deliver commission-based insurance advice in a better way.
Kyith is the Owner and Sole Writer behind Investment Moats. Readers tune in to Investment Moats to learn and build stronger, firmer wealth foundations, how to have a Passive investment strategy, know more about investing in REITs and the nuts and bolts of Active Investing.
Readers also follow Kyith to learn how to plan well for Financial Security and Financial Independence.
Kyith worked as an IT operations engineer from 2004 to 2019. Currently, he works as a Senior Solutions Specialist in Insurance Start-up Havend. All opinions on Investment Moats are his own and does not represent the views of Providend.
You can view Kyith's current portfolio here, which uses his Free Google Stock Portfolio Tracker.
His investment broker of choice is Interactive Brokers, which allows him to invest in securities from different exchanges all over the world, at very low commission rates, without custodian fees, near spot currency rates.
You can read more about Kyith here.
- My Dividend Experience Investing in UCITS iShares iBond Maturing in 2028. - April 23, 2024
- We Invest into Popular Funds When They Are Popular, Exactly When They Started Turning to Shxt. - April 22, 2024
- Meal Prep 2.0 – Cooking Your “Go-to” Meal that You Look Forward to Eating Everyday. - April 21, 2024
Sinkie
Monday 27th of June 2022
2 things to note: The official declaration of recessions in US is done by NBER and is a VERY LAGGING info. E.g. They only declared the start of the GFC recession as being Dec 2007, only in Dec 2008 --- ONE YEAR LATER --- by then stocks had tanked -50% and close to the bottom liao.
Even using 2 successive quarters of -ve GDP growth is very dated & lagging. And some US recessions didn't meet this criteria.
My rule of thumb is to monitor unemployment rate. When unemployment rate has increased by 50bps from the business cycle low, a recession is either at hand or on the way soon. Note that in some historical cases, S&P 500 had already dropped -20% by the time this signal occurred. So this is not high frequency data LOL.
The 2nd point is that a 2009 study suggested that the recovery from Great Depression crash was "only" 4.5-5 years.
Caveat is that it's in real terms i.e. deflation adjusted, includes dividends, and using a broader index than the price-weighted DJIA.
https://www.businessinsider.com/henry-blodget-new-study-stocks-only-took-5-years-to-recover-after-1929-2009-4
But I would guess that the first 2 years would still be HELL, as it takes time for everyday prices to capitulate & deflation to really lower the cost of living.
PS: The above article was written in Apr 2009, just after the bottom of GFC, when people were still talking about L-shape depression 2.0 or W-double dip recession. The author humorously (on hindsight) warns readers not to be too optimistic about stock recovery from GFC. In reality, it took about 3 years for the S&P 500 to recover on nominal basis, including dividends.