Drizzt: long term market analysis is a series once or twice a month where we take a look at longer term trends in the market to get our bearings right on the general direction of prices.
I wasn’t going to do a long term market analysis series so soon but when the DOW fell by more than 500 points and STI fell by 100 points it is better that we take stock of where we are.
The Dow Industrials DJIA finished Friday up 60 points, but fell 5.8% for the week, the worst weekly performance since the week of March 6, 2009, when it dropped 6.2%
The S&P 500 SPX ended slightly lower on the day, but fell 7.19% for the week, the worst performance since the week of Nov. 12, 2008 when it fell 8.4%.
Ignoring the noise on the street
Many of my friends have reasoned why this crash happen or the weakness in the markets is due to the debt ceiling problems in the US and debt problems in Europe. I would say I really do not have a great idea what are the decision making.
To me price is the summation of all market behaviors, the demand and supply of how people as a crowd votes whether they like the situation or not.
The news do not create the price. The price creates the news.
How true is this? The debt crisis have in US and Europe have been going on for months yet look at the price charts below. They have been going up and going down. People made money by being nimble.
1 Day before this plunge the US settled on the resolution on this debt ceiling. What happened next is that instead of market surging due to this the market plunges.
People vote with their money. And the price shows their consolidated opinion. Markets move up and down not because of the decisions but the consolidated opinion
Inflection Point
As mentioned in the last long term market analysis we are still at an inflection point where the market could consolidate here and then move upwards, or that this is a narrowing of price range forming a long term toppish condition.
S&P500
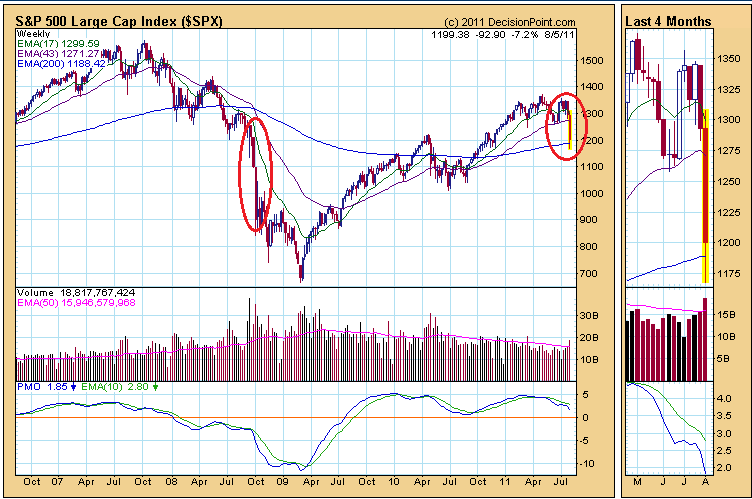
We talked a fair bit of using the 17 and 43 weekly EMA as the price signals whether we are neutral, bullish or bearish on things. The 17 EMA and 43 EMA have been consolidating and narrowing.
This does not indicate a top in the market since in Apr-Jul 2010 we see a similar formation which presents a resumption.
Should it consolidates further this might turn down to be the market top many were anticipating.
Note that 17 and 43 Week EMA are quite long term averages and do not turn based on 1 or 2 days news. The summation and the crossing to the downside or to the upside more or less means a bull for 2 months or a bear for 2 months.
STI

The STI looks much healthier from the longer term perspective. You can see the narrowing of the 2 EMA and that we could well stay like this or go in either direction. Still difficult to call.
Big Market Drops
Many of my friends were say this is a big drop and that they have never seen such a big drop.
Well, in the 2007-2009 recession, most of the drop daily is so big.
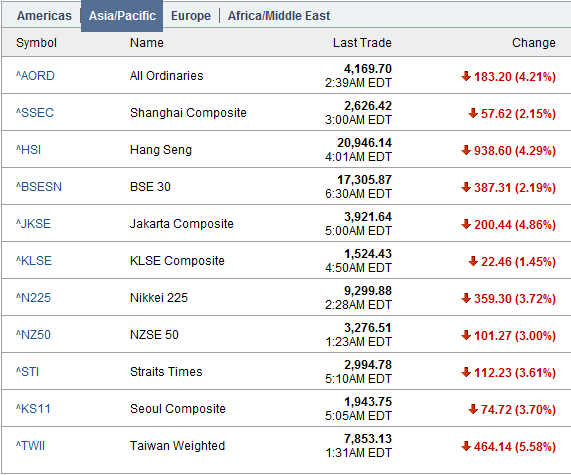

This is yesterday’s Asia Markets Summary

This is a typical day in 2008.
By no means are today’s drop big. But what is important is we take into context this price movement, the sentiments behind this and what it means.
What I notice is the markets making 1% to 2% drops for 4 or more days. Normally this is already an oversold condition and a market rebound is likely. Yet after a day where the market rally 1% it ended up nearly back to where it was on the same day.
These are very negative sentiments.
The bigger fall yesterday took me by surprise really. It happened after a sort of better news was announced. We were expecting things to be delayed and back to normal yet it went in the opposite direction.
Had this be a long term bull market we shouldn’t see it being littered by 5% down days but smaller down days. More of these negative shocks are the behavior of a bear rather than bull.
Social Mood reinforces and strengthens. To the upside its all good. To the downside it becomes dangerous because we will be expecting margin calls which will make the situation worse.
All this when taken into context means a probable change in volatility.
Portfolio Movement
Its Ex Dividend Week this week for me, but since I was on the edge for most of the year, I have cleared majority of my holdings 2 days before this big correction. It is important to understand how you are wired and always analyze the stupid things that you do last time.
It is not easy for me to do this since the last few times I did, I missed out on accumulating Starhub or First REIT at a low price. However, I am more risk adverse and have programmed myself to swing in should the map becomes clearer.
My plan is to let the map (my long term analysis) tell me where we are and continue to find those fundamental good income yielding stocks so that in the event that the trend goes up or volatility reduces, I know which are the stocks to venture into and not go into panic buying and panic selling mood.
My transactions can be reviewed here.
This did not stop me from trying to accumulate good shares and my venture into SIA Engineering a day before this crash cost me a cut loss of $750 =( . Falling knives are dangerous to catch!
For those interested in tracking my most current holdings, you can review my portfolio over here. Learn to use our Free Stock Portfolio Tracking Google Spreadsheet to track stock transactions.
Kyith is the Owner and Sole Writer behind Investment Moats. Readers tune in to Investment Moats to learn and build stronger, firmer wealth foundations, how to have a Passive investment strategy, know more about investing in REITs and the nuts and bolts of Active Investing.
Readers also follow Kyith to learn how to plan well for Financial Security and Financial Independence.
Kyith worked as an IT operations engineer from 2004 to 2019. Currently, he works as a Senior Solutions Specialist in Insurance Start-up Havend. All opinions on Investment Moats are his own and does not represent the views of Providend.
You can view Kyith's current portfolio here, which uses his Free Google Stock Portfolio Tracker.
His investment broker of choice is Interactive Brokers, which allows him to invest in securities from different exchanges all over the world, at very low commission rates, without custodian fees, near spot currency rates.
You can read more about Kyith here.
- My Dividend Experience Investing in UCITS iShares iBond Maturing in 2028. - April 23, 2024
- We Invest into Popular Funds When They Are Popular, Exactly When They Started Turning to Shxt. - April 22, 2024
- Meal Prep 2.0 – Cooking Your “Go-to” Meal that You Look Forward to Eating Everyday. - April 21, 2024
toiletsiao
Saturday 6th of August 2011
I think US's credit rating cut is the real reason behind all this selling .... the powers that be out there got wind of it and starting selling like banshee this past week... Monday will be interesting... got a feeling who panick sell on monday morning will regret...just a gut feel..
Wj888
Saturday 6th of August 2011
Actually we are at the moment of November 2007 - Feb 2008. Look at the striking similarity on the head and shouldee formation. The news and behavior of the crowd then was strikingly similar.
Anyway, it's good to clear some and start afresh. I almost fell in love with my stocks till yesterday jolted me up.