The long-term bond yields have been climbing which creates an overhang on longer duration bond prices. The 20 and 30-year Treasury bond price chart at this point look like any equity price chart that you do not wish to own.
And since the 10-year treasury is the discount rate used to value other risk assets such as stocks, the prices have come down. With Treasury bills and cash yielding so much, you can’t find many people wanting to invest in stocks or very cautious to take on longer data bonds.
Judging by equity risk premium, or the spread of dividend yield over 10-year government bonds, it doesn’t make any sense to own equities or REITS.
Yet I wonder whether now is the time to think in terms of the commodities market. When supply and demand dynamics is favorable that is where the prices start to turn down and when supply and demand looks shitty that is where you get in.
There is enough bearish sentiments in the market but so much so, last week’s price action has made some bearish people… rather bullish right before a possible recession (that still has not come).
What to make of all this?
These kind of signals are always about probabilities and they are true until they become false. What would you do if you are the unlucky ones who encounter when the signals are false? If you are a trader concentrating your portfolio into very potent trades, then you live and die by the signals, but if you hold a strategic portfolio, and are trying to find an optimal time to add on to the portfolio, then you add on at a bad time but in the grand scheme of things, if the strategy means 18-23 years later, you get a positive compounded return regardless, then I guess psychologically it hurts but looking back, you may learn a lesson that these stuff matters less to your wealth building in the grand scheme of things.
The Zweig Breadth Trust
On Friday we also see the trigger of the rare Zweig Breadth Trust. Stocks went from very oversold (< 40%) to overbought (>61.5%) in less than 2 weeks. These are price momentum signals.
A breadth thrust involves the following conditions:
- Usually an oversold market where sentiment becomes washed out.
- A sudden violent market recovery and buying stampede with broad participation.
- The momentum from the buying stampede eventually pushes prices higher and usually marks the start of a new bull phase.
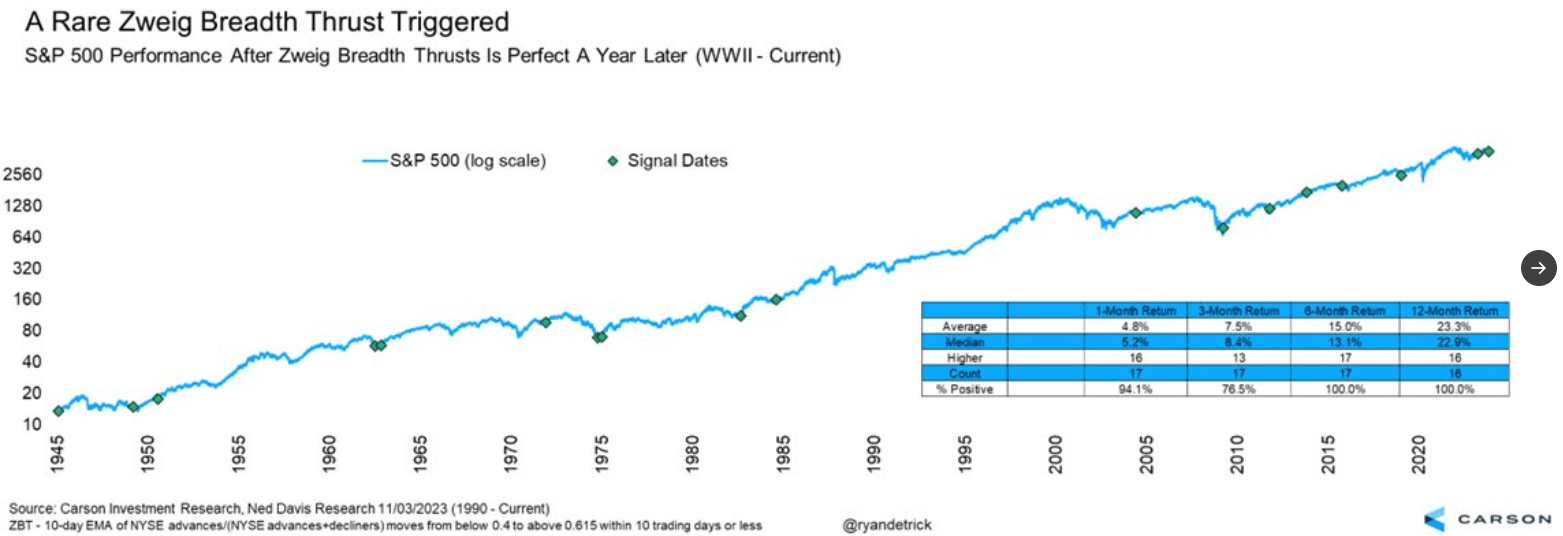
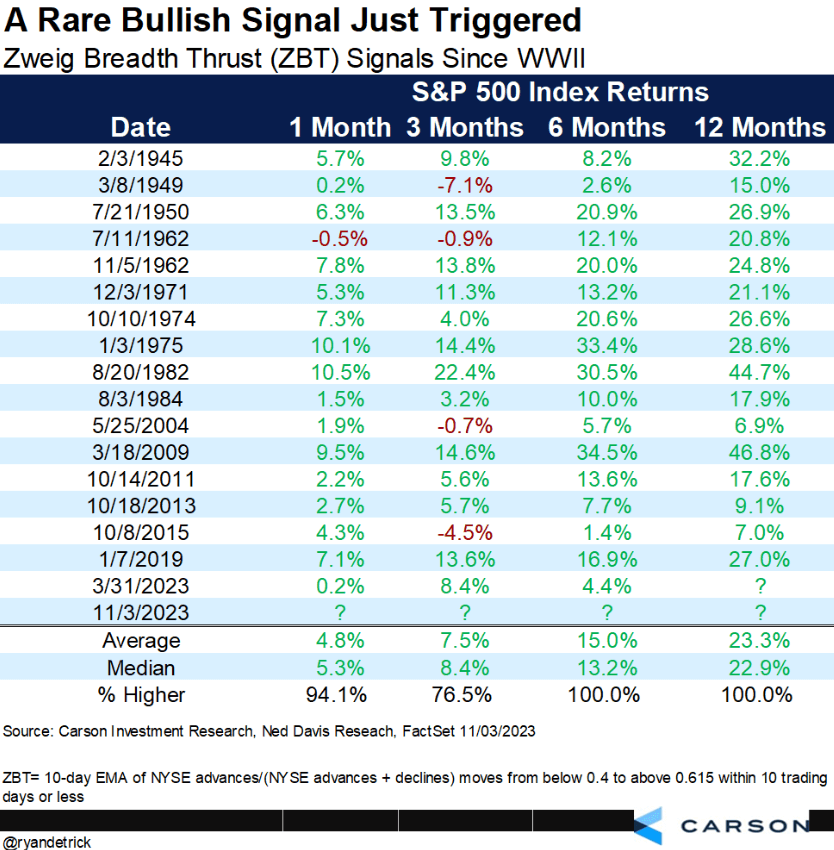
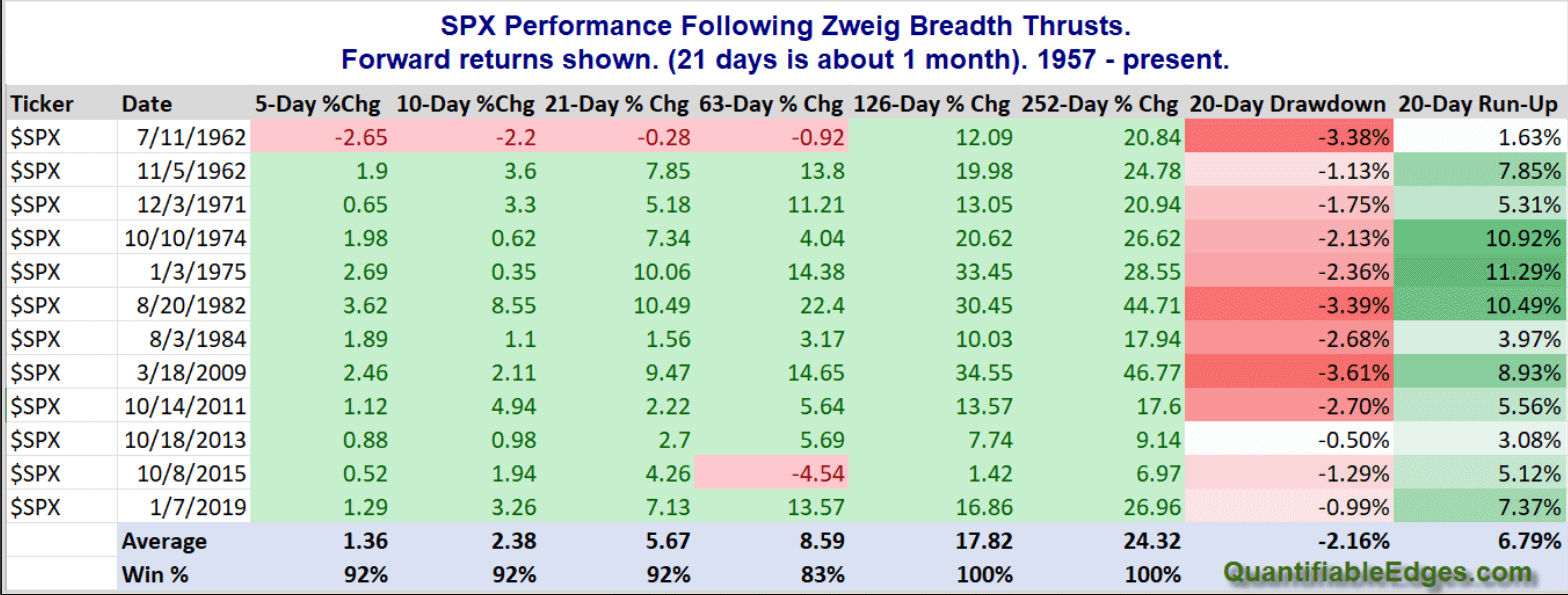
Since World War II, the S&P 500 have been higher a year later every time.
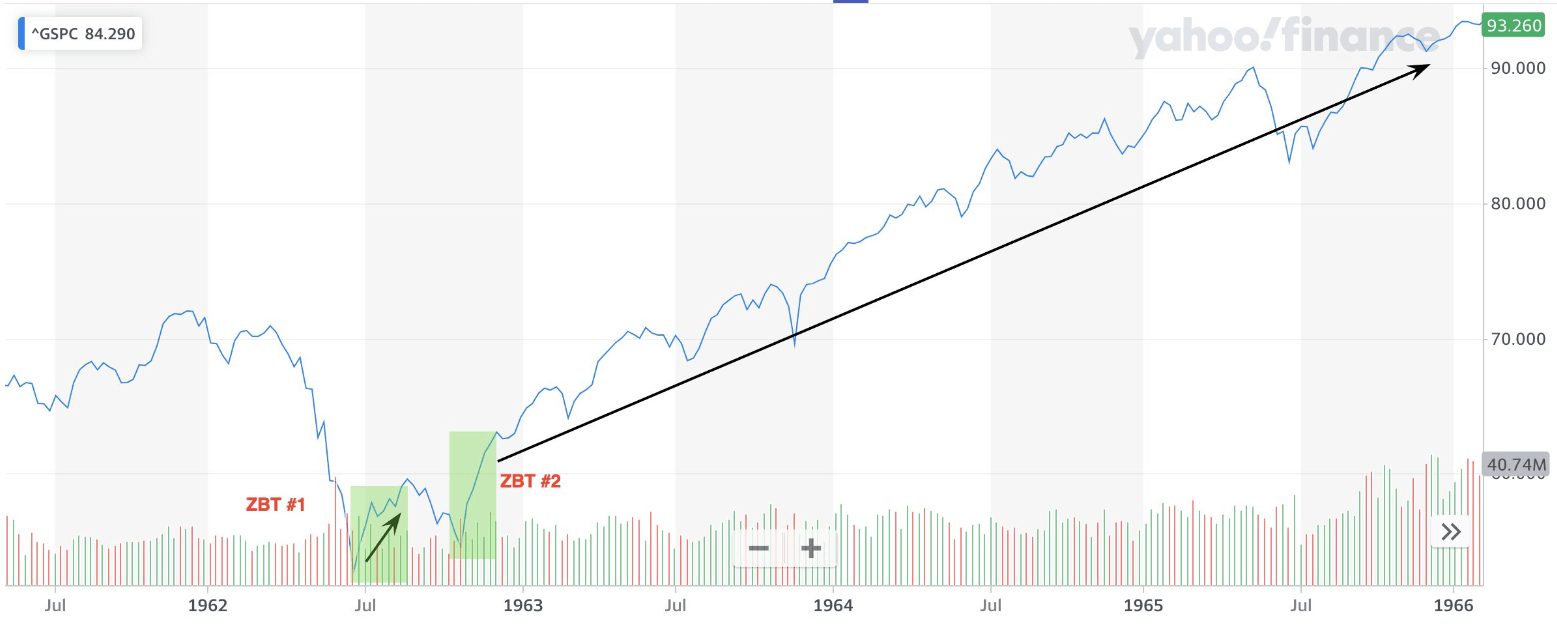
In 2023, we had 2 Zweig Breath trusts. The last time we have this in 1963:
More Zweig Breadth Trusts Charts
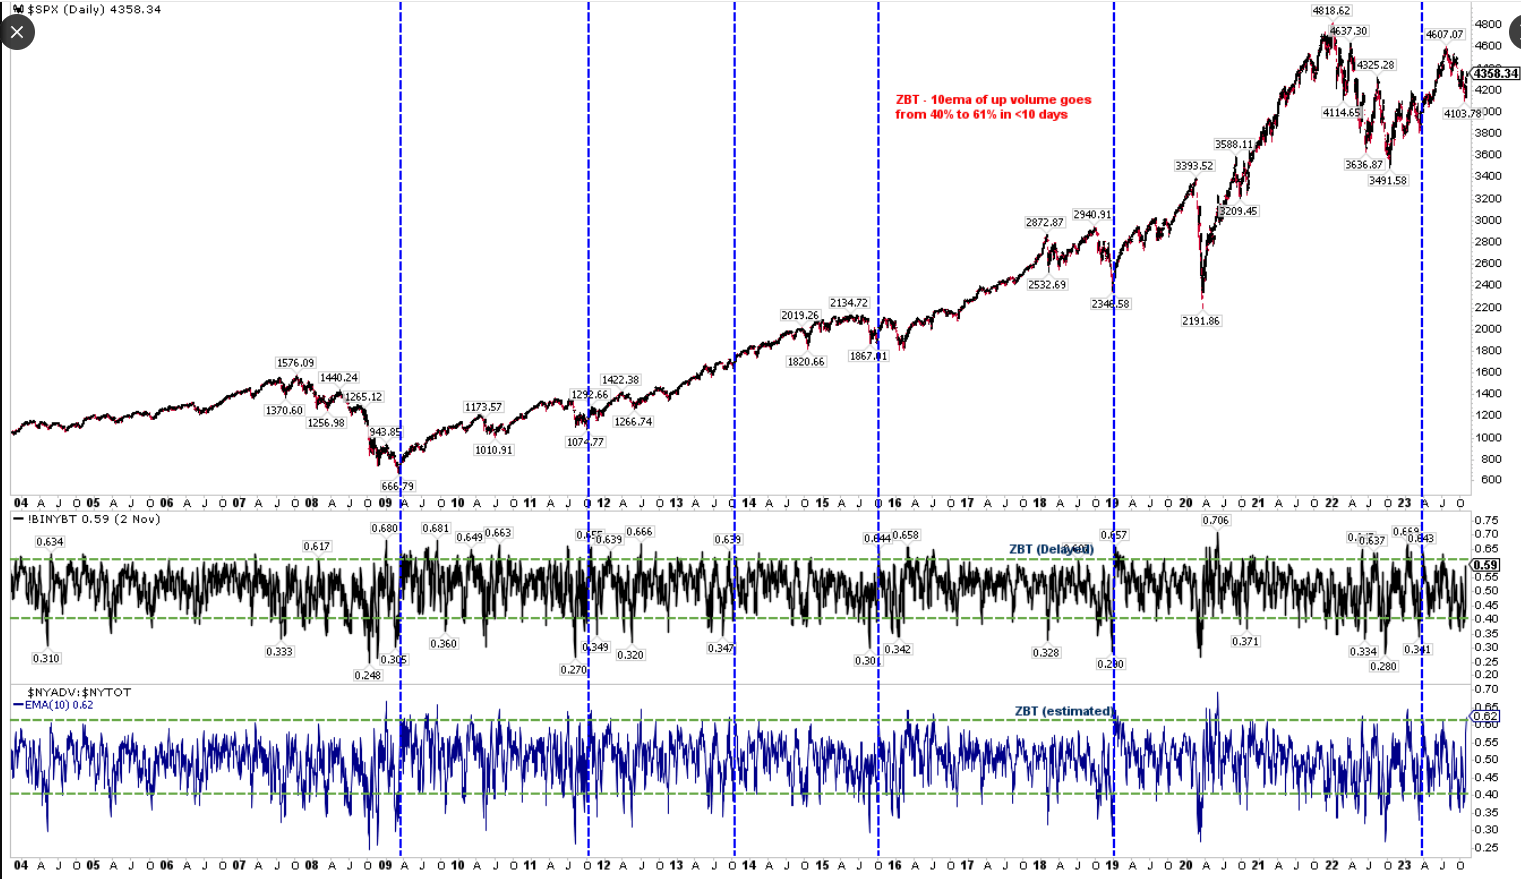
The bottom blue breadth shows the Breadth Trust.
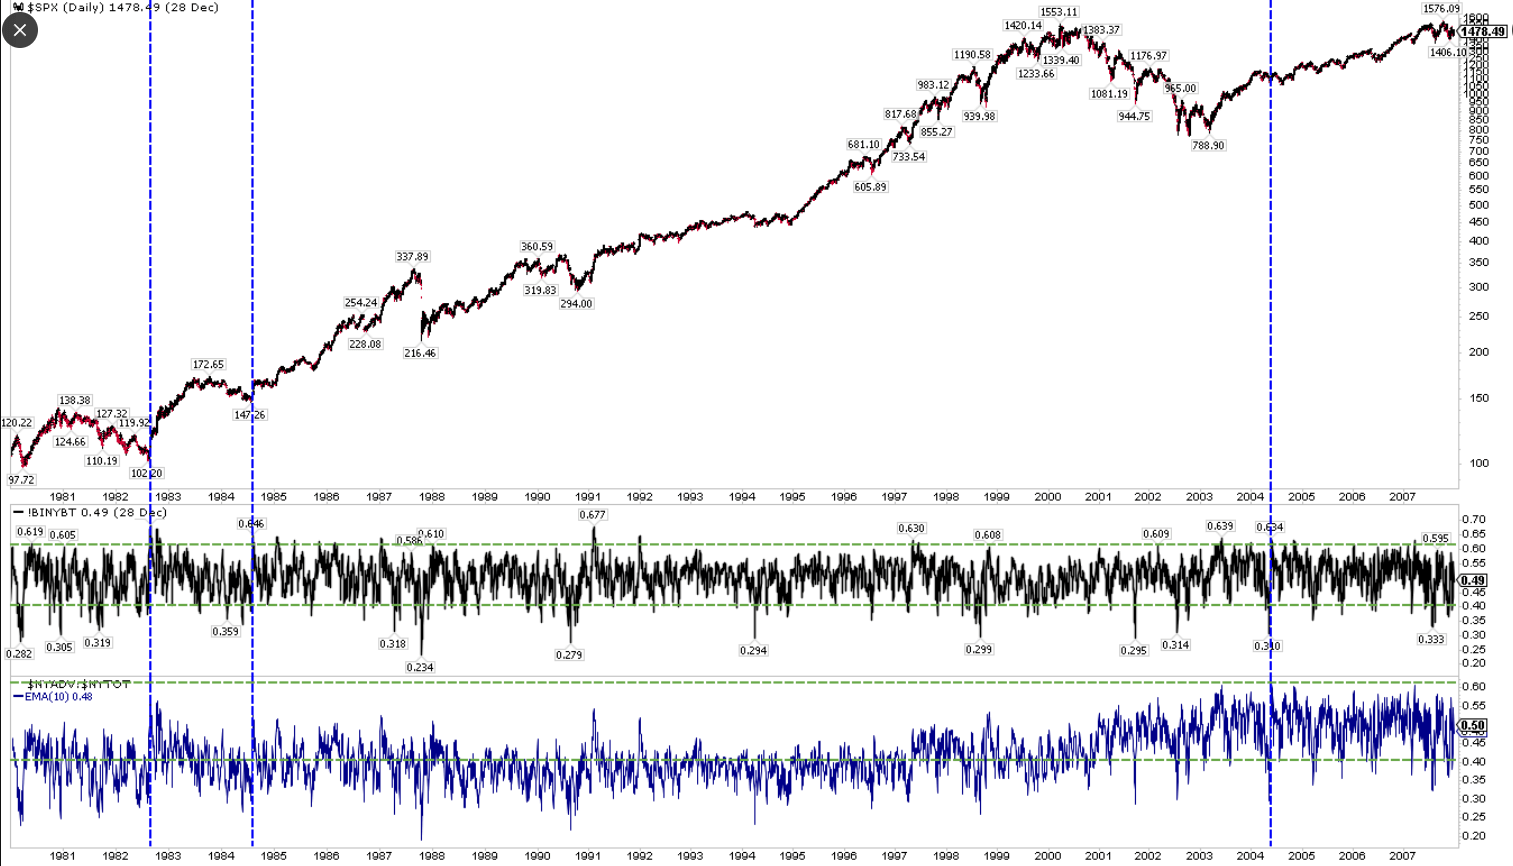
Prior to that, this signal is rarer.
The quantitative data:
For some like Oversold/Overbought momentum specialist like Cam Hui, he was rather cautious on the March Zweig Breadth Trust but feel more bullish about the breadth trust this time around:
The market triggered a ZBT buy signal on March 31, 2023 and my reaction was cautious (see Why I am fading the latest breadth thrust). This time, the tone is far more bullish and I am inclined to adopt a YOLO (You Only Live Once) to portfolio positioning.
I wrote in early April that I was cautious, but not outright bearish. I was mostly correct. Instead of a price surge, the S&P 500 traded sideways for two months after the buy signal, rallied and topped out in late July, and pulled back to the approximate level of the buy signal in late October.
The Whaley Breadth Trust
There is a different kind of Breath Trust, compare to the Zweig Breadth Trust. This too also flashed a signal.
We get a Whaley Breadth Trust if the total advances is greater than 73.66% of the total advances + declines.
We got 75.96% on Friday.
Here is the paper behind the Whaley Breadth Trust Signal.
Psychological Pessimism
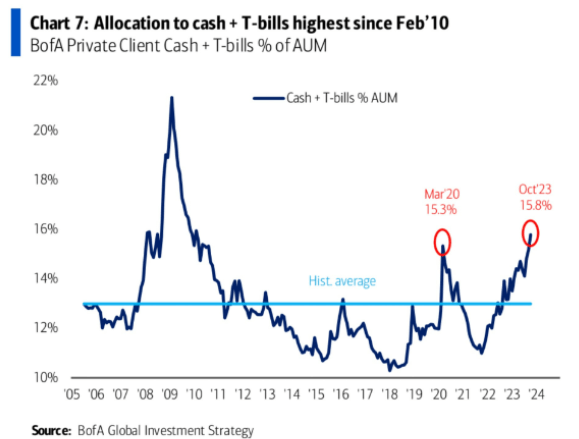
Given how reasonable the rates on short-term notes are, we are seeing some of the highest levels of cash + treasury bills in almost 14 years. This could potentially be a tailwind for stocks if there is a rotation back into equity markets.
Bank of America’s Savita Subramanian cites a rather reliable contrarian indicator:
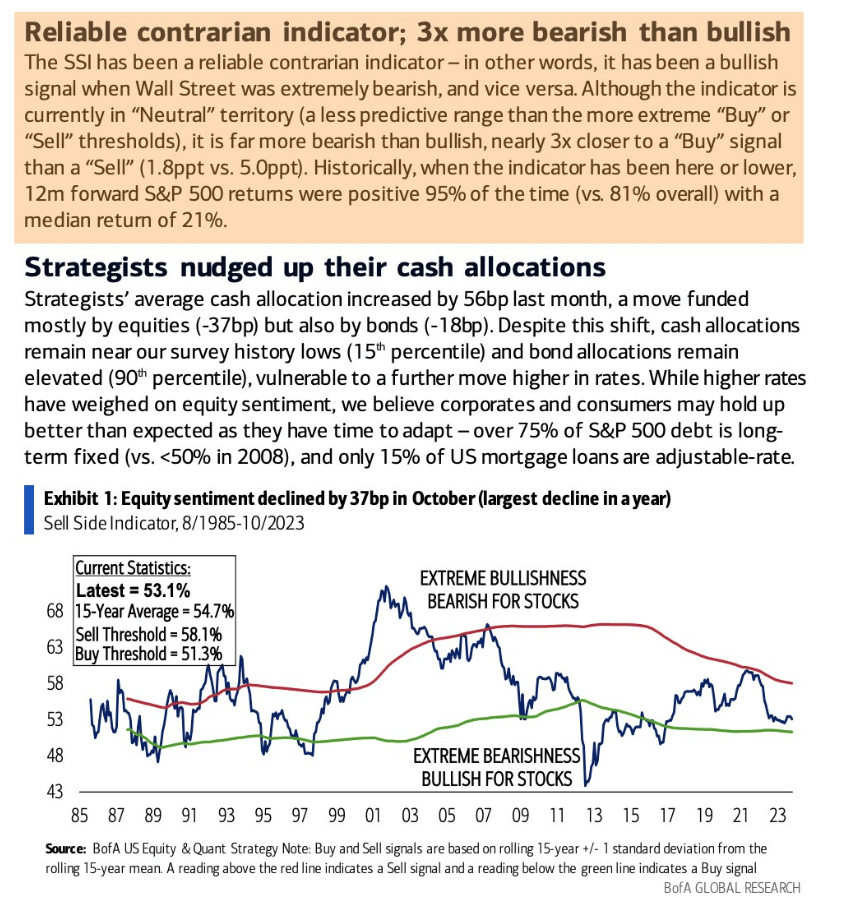
At this level, the forward 12-month positivity rate is 95%, median return is +21%.
If you want to trade these stocks I mentioned, you can open an account with Interactive Brokers. Interactive Brokers is the leading low-cost and efficient broker I use and trust to invest & trade my holdings in Singapore, the United States, London Stock Exchange and Hong Kong Stock Exchange. They allow you to trade stocks, ETFs, options, futures, forex, bonds and funds worldwide from a single integrated account.
You can read more about my thoughts about Interactive Brokers in this Interactive Brokers Deep Dive Series, starting with how to create & fund your Interactive Brokers account easily.
Kyith is the Owner and Sole Writer behind Investment Moats. Readers tune in to Investment Moats to learn and build stronger, firmer wealth foundations, how to have a Passive investment strategy, know more about investing in REITs and the nuts and bolts of Active Investing.
Readers also follow Kyith to learn how to plan well for Financial Security and Financial Independence.
Kyith worked as an IT operations engineer from 2004 to 2019. Currently, he works as a Senior Solutions Specialist in Insurance Start-up Havend. All opinions on Investment Moats are his own and does not represent the views of Providend.
You can view Kyith's current portfolio here, which uses his Free Google Stock Portfolio Tracker.
His investment broker of choice is Interactive Brokers, which allows him to invest in securities from different exchanges all over the world, at very low commission rates, without custodian fees, near spot currency rates.
You can read more about Kyith here.
- My Dividend Experience Investing in UCITS iShares iBond Maturing in 2028. - April 23, 2024
- We Invest into Popular Funds When They Are Popular, Exactly When They Started Turning to Shxt. - April 22, 2024
- Meal Prep 2.0 – Cooking Your “Go-to” Meal that You Look Forward to Eating Everyday. - April 21, 2024
Thinknotleft
Wednesday 8th of November 2023
Hi, I guess that your post is on US market and the technicals are predicting returns within next 12 months.
IF we look at long term (10 years), my view is that China/HK (and maybe SG) market may have higher returns than US market over next 10 yrs, as the locals are giving up. See https://www.channelnewsasia.com/business/china-silver-haired-investors-exit-game-stock-market-3905376
Buy at low prices. When are prices low? When people are giving up.