This might be the top of a bear market rally indicator, but I don’t care. No charts here indicate negativity.
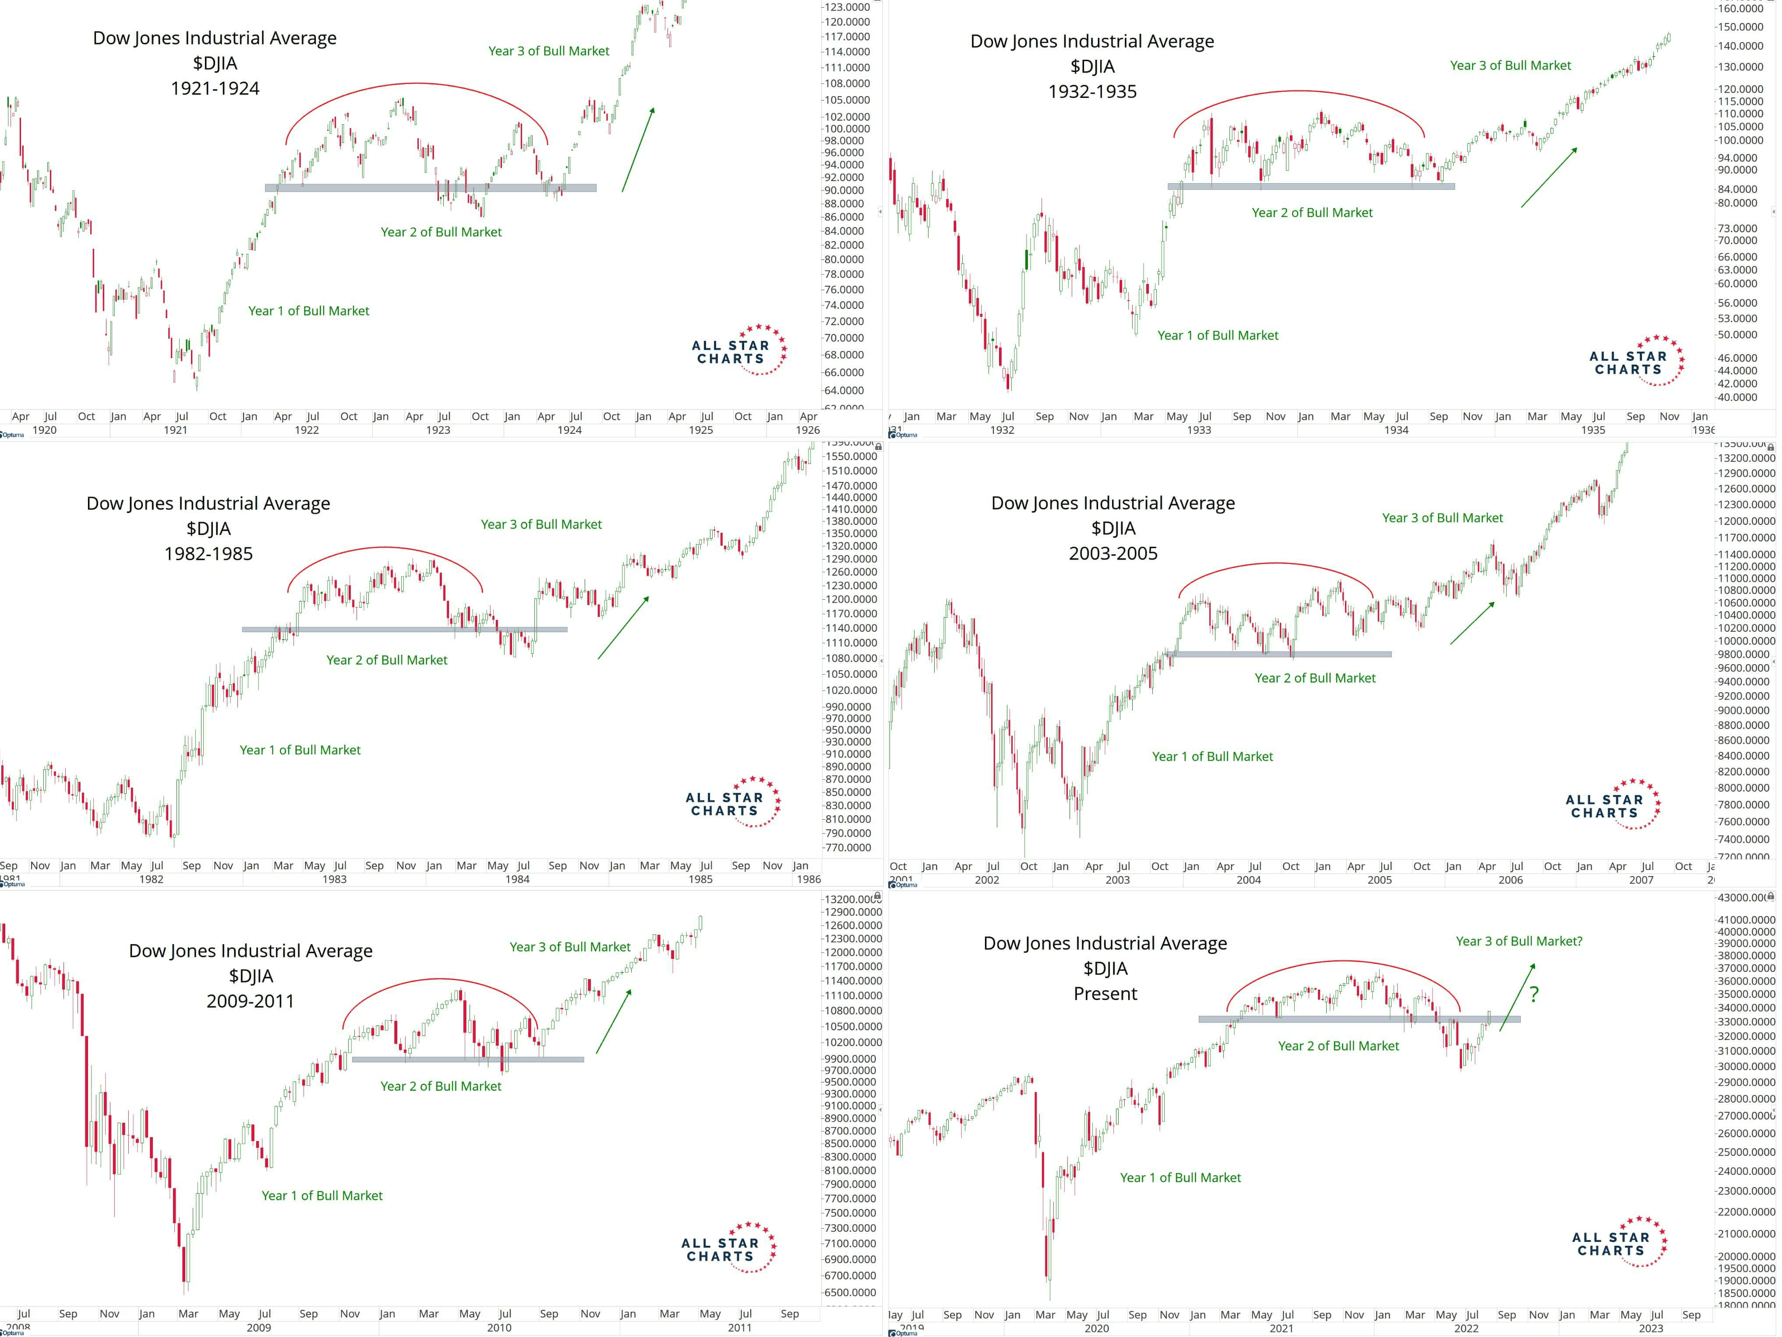
There are a lot of price actions that look like they will break down but turn out to be mere consolidation. Would this time be similar as well?
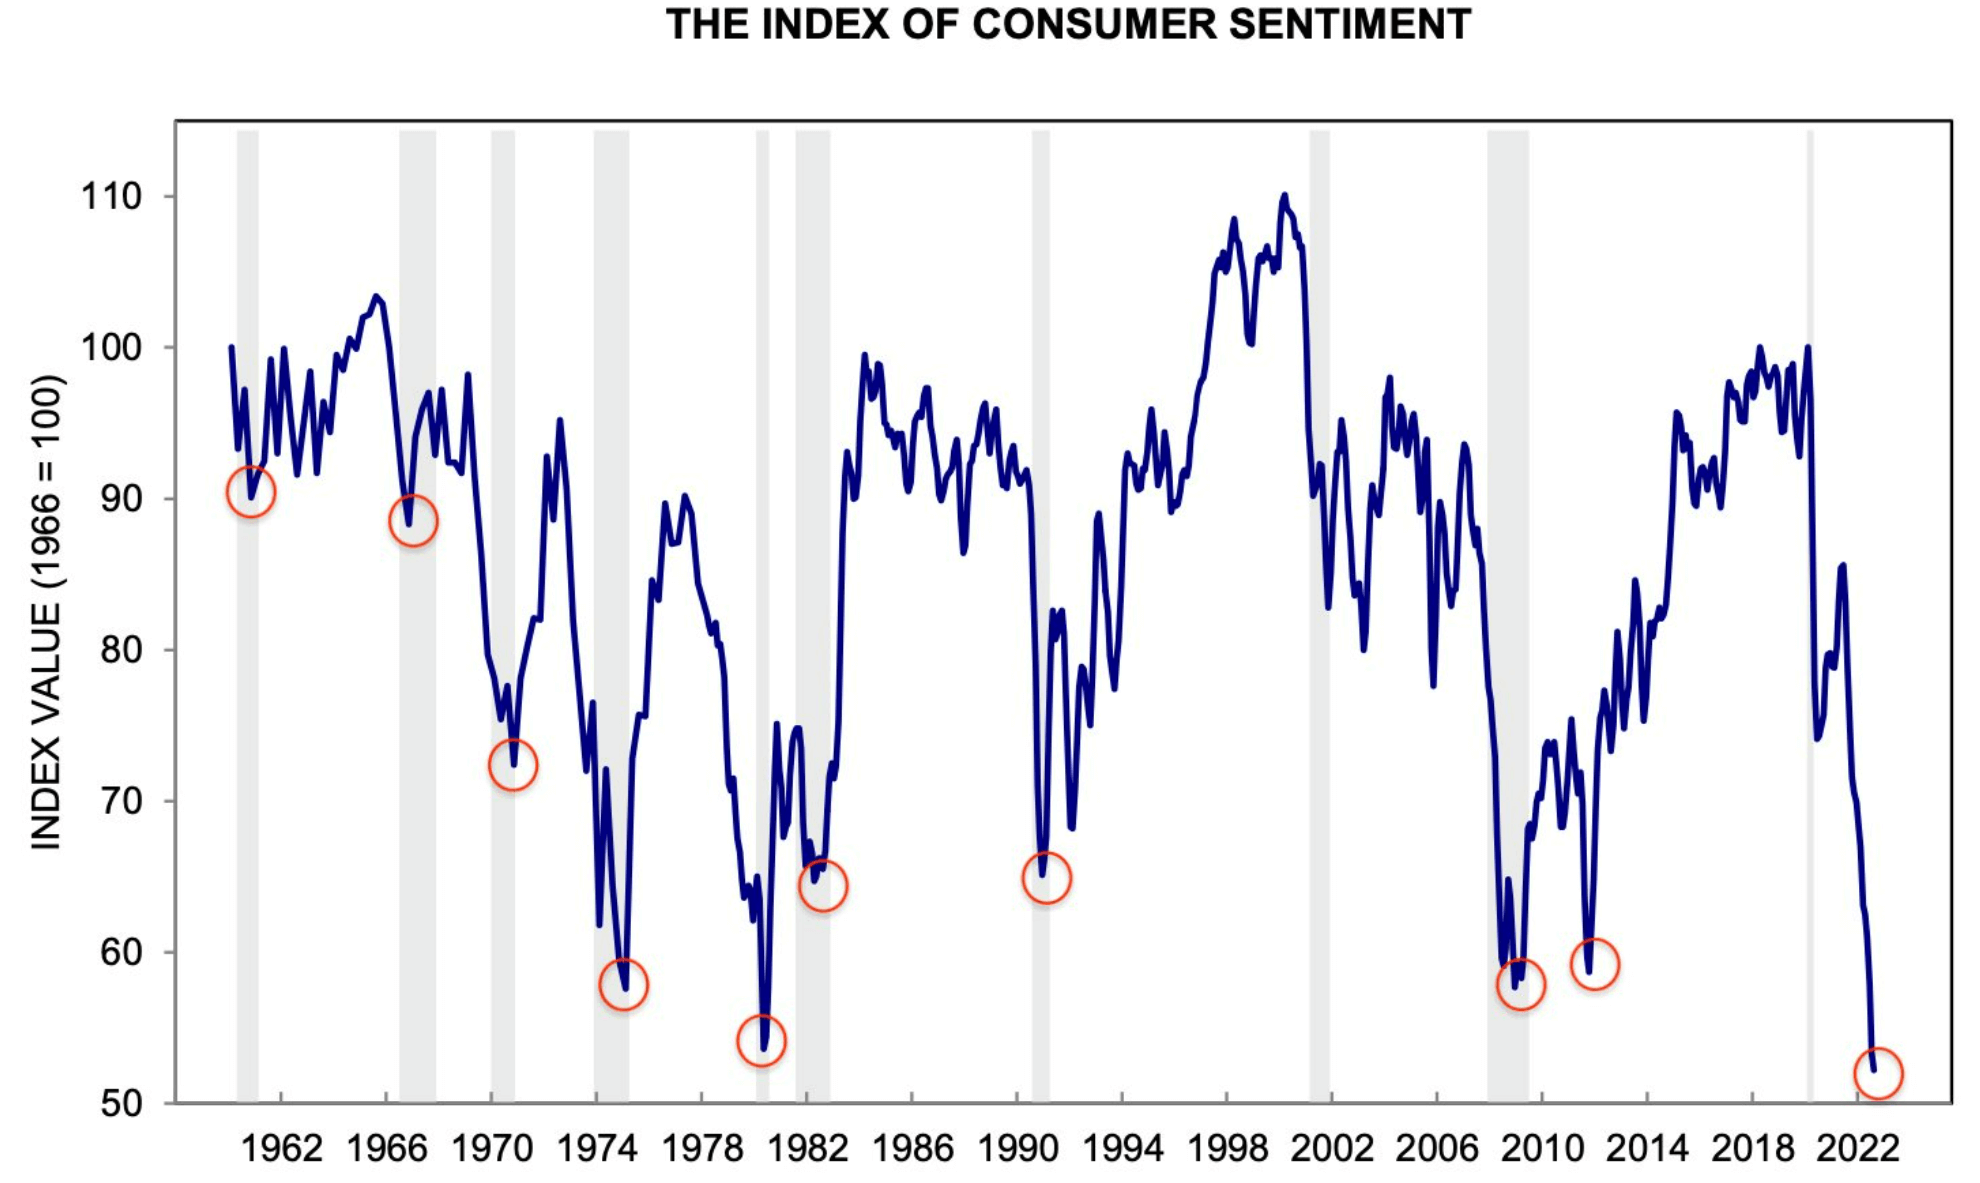
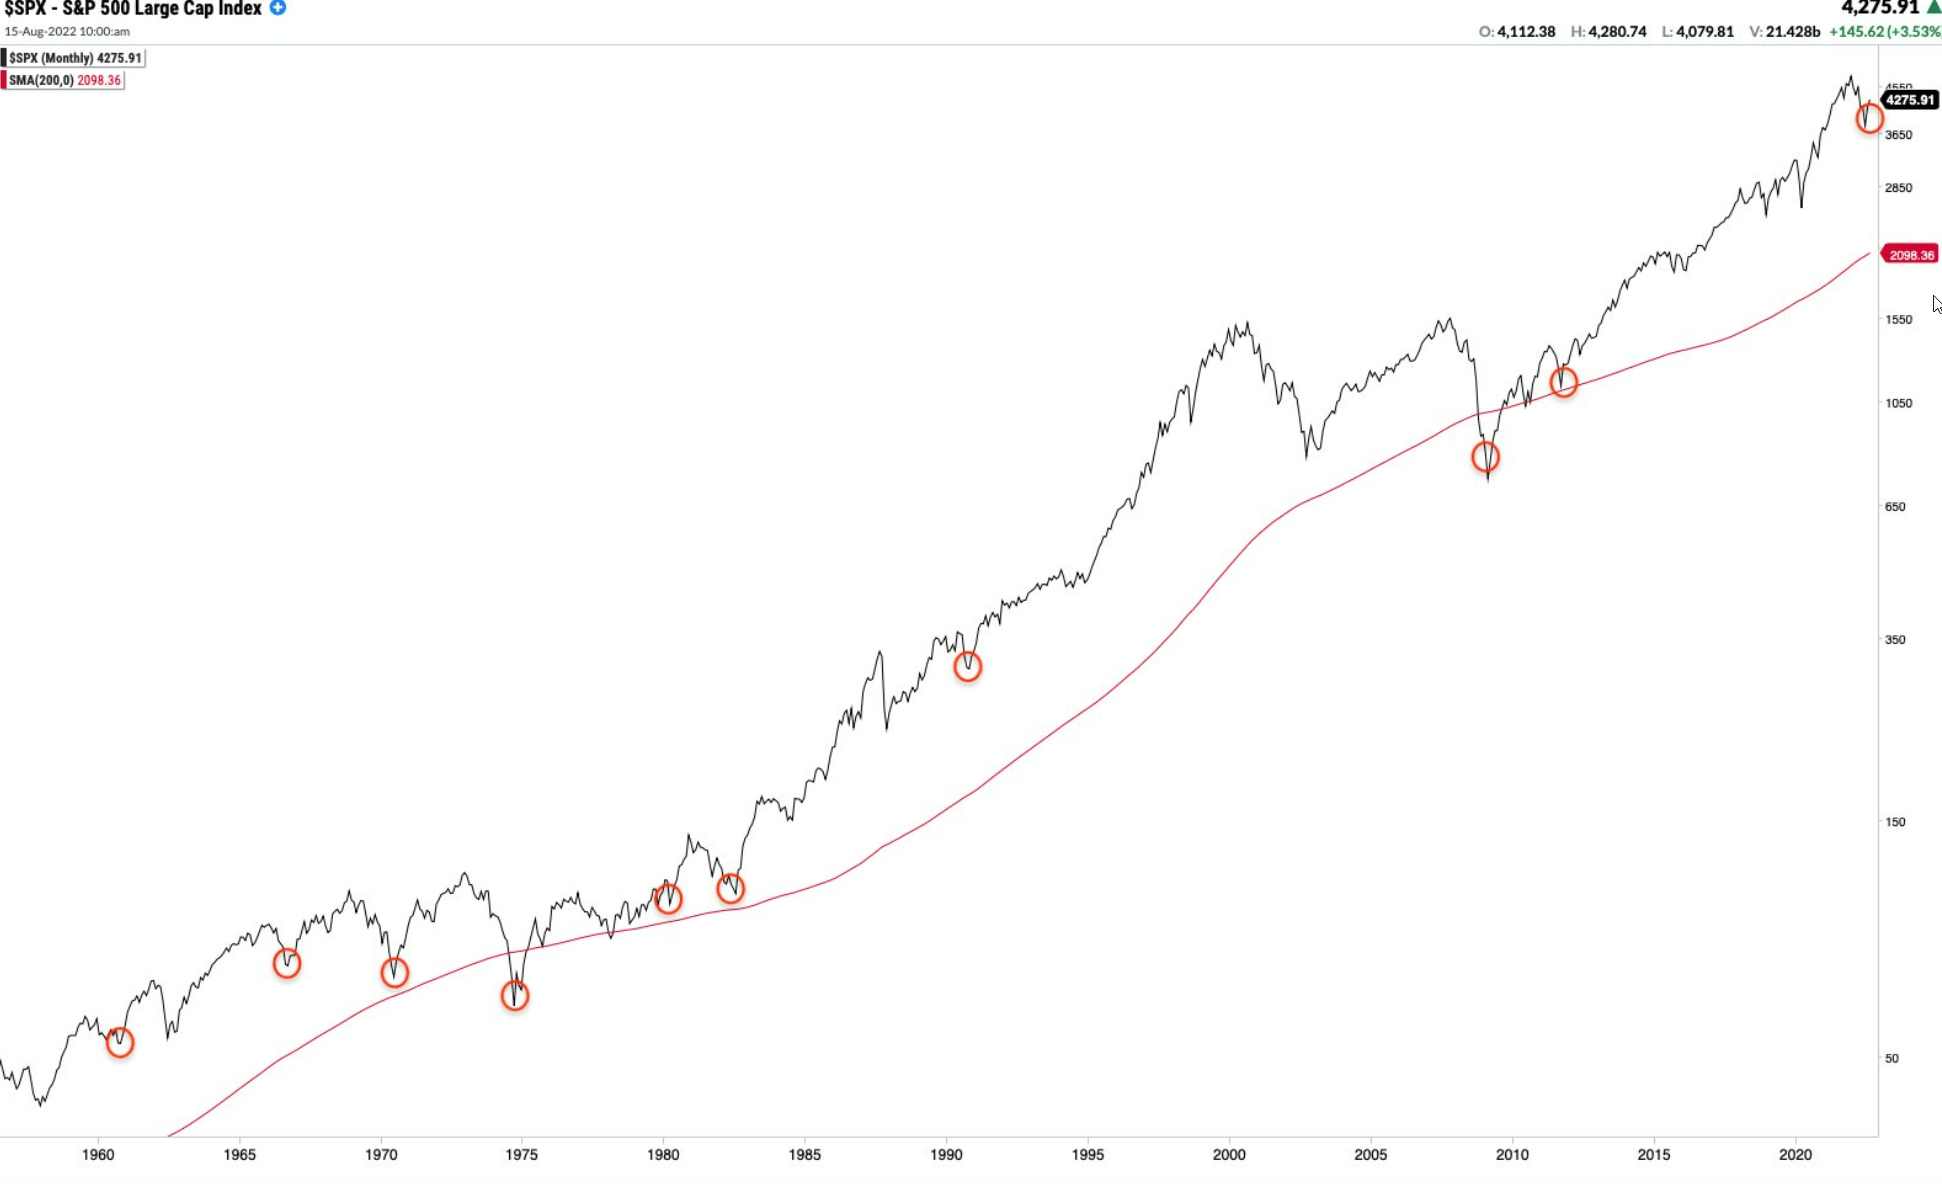
3-month consumer sentiment since 1960s and the corresponding price action on the S&P 500.
Seth Golden provides the data of what happens after stocks as a basket corrected downwards but rebounded at least back to 50% of the fall.
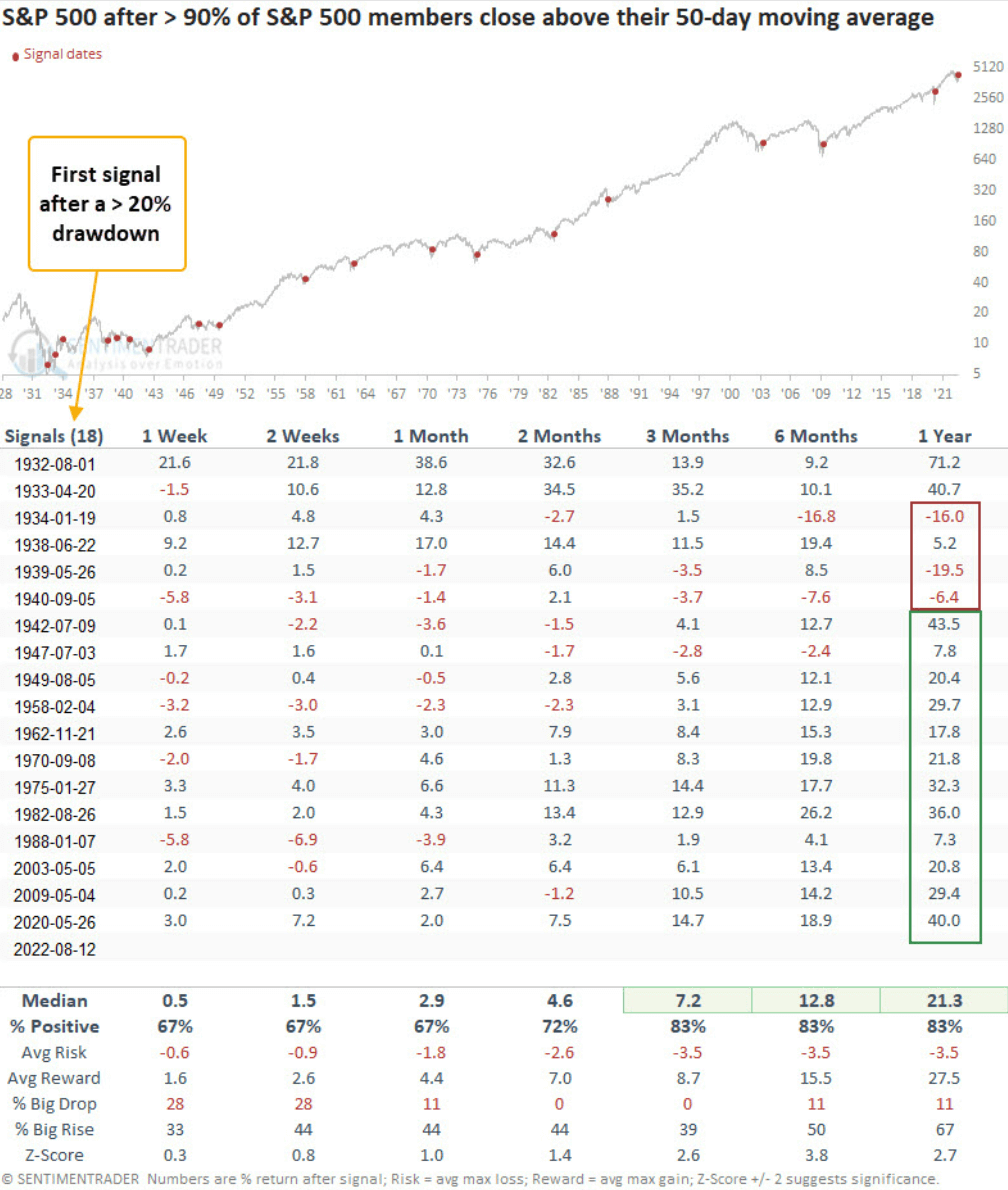
Sentiment Trader shows us the historical return after the following sequence:
- A 20% drop
- 90% of the S&P 500 members close above their 50-day moving average
Short-term results are a bit mixed, but the returns can be astounding longer term. That is… if you ignore the Great Depression periods.
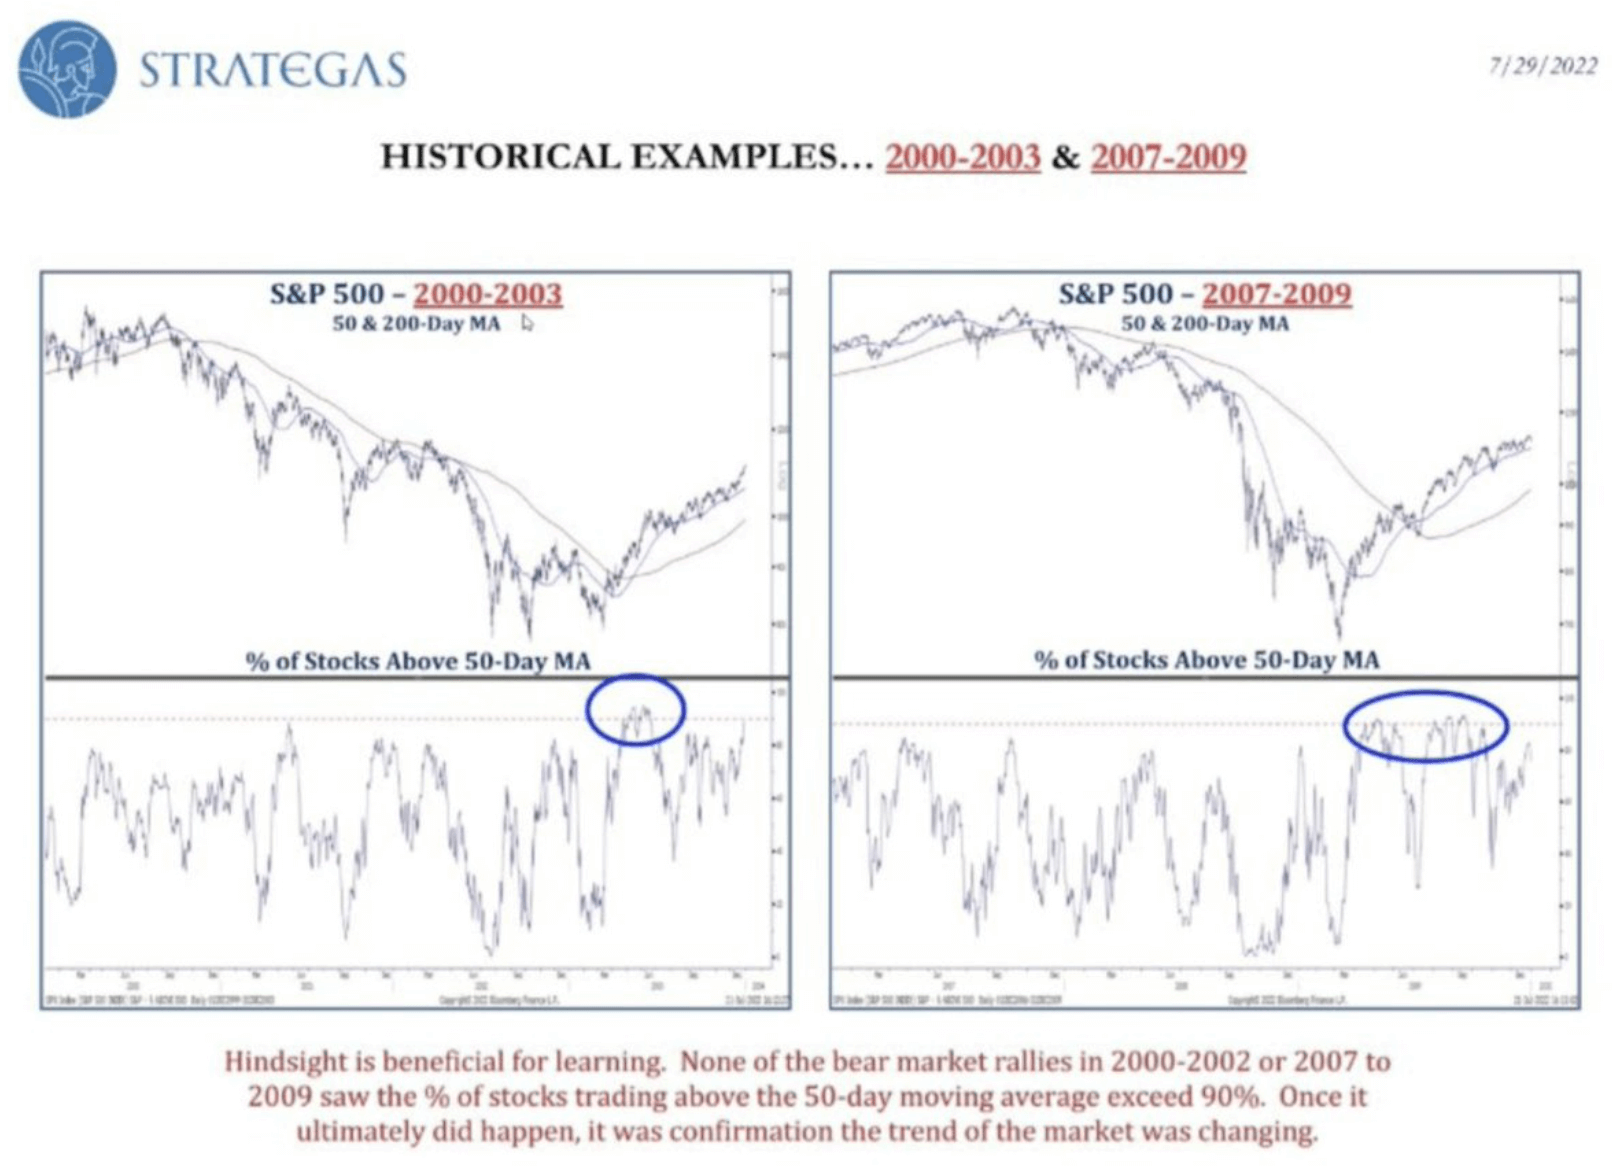
Strategas reviews how this general upward shift in stocks occurred during two more recent bears.
Seth presented something slightly different:
- The percentage of S&P 500 stocks that are above their 50-day moving average goes below 20%
- Then the percentage of stocks that are above their 50-day moving average goes above 90%
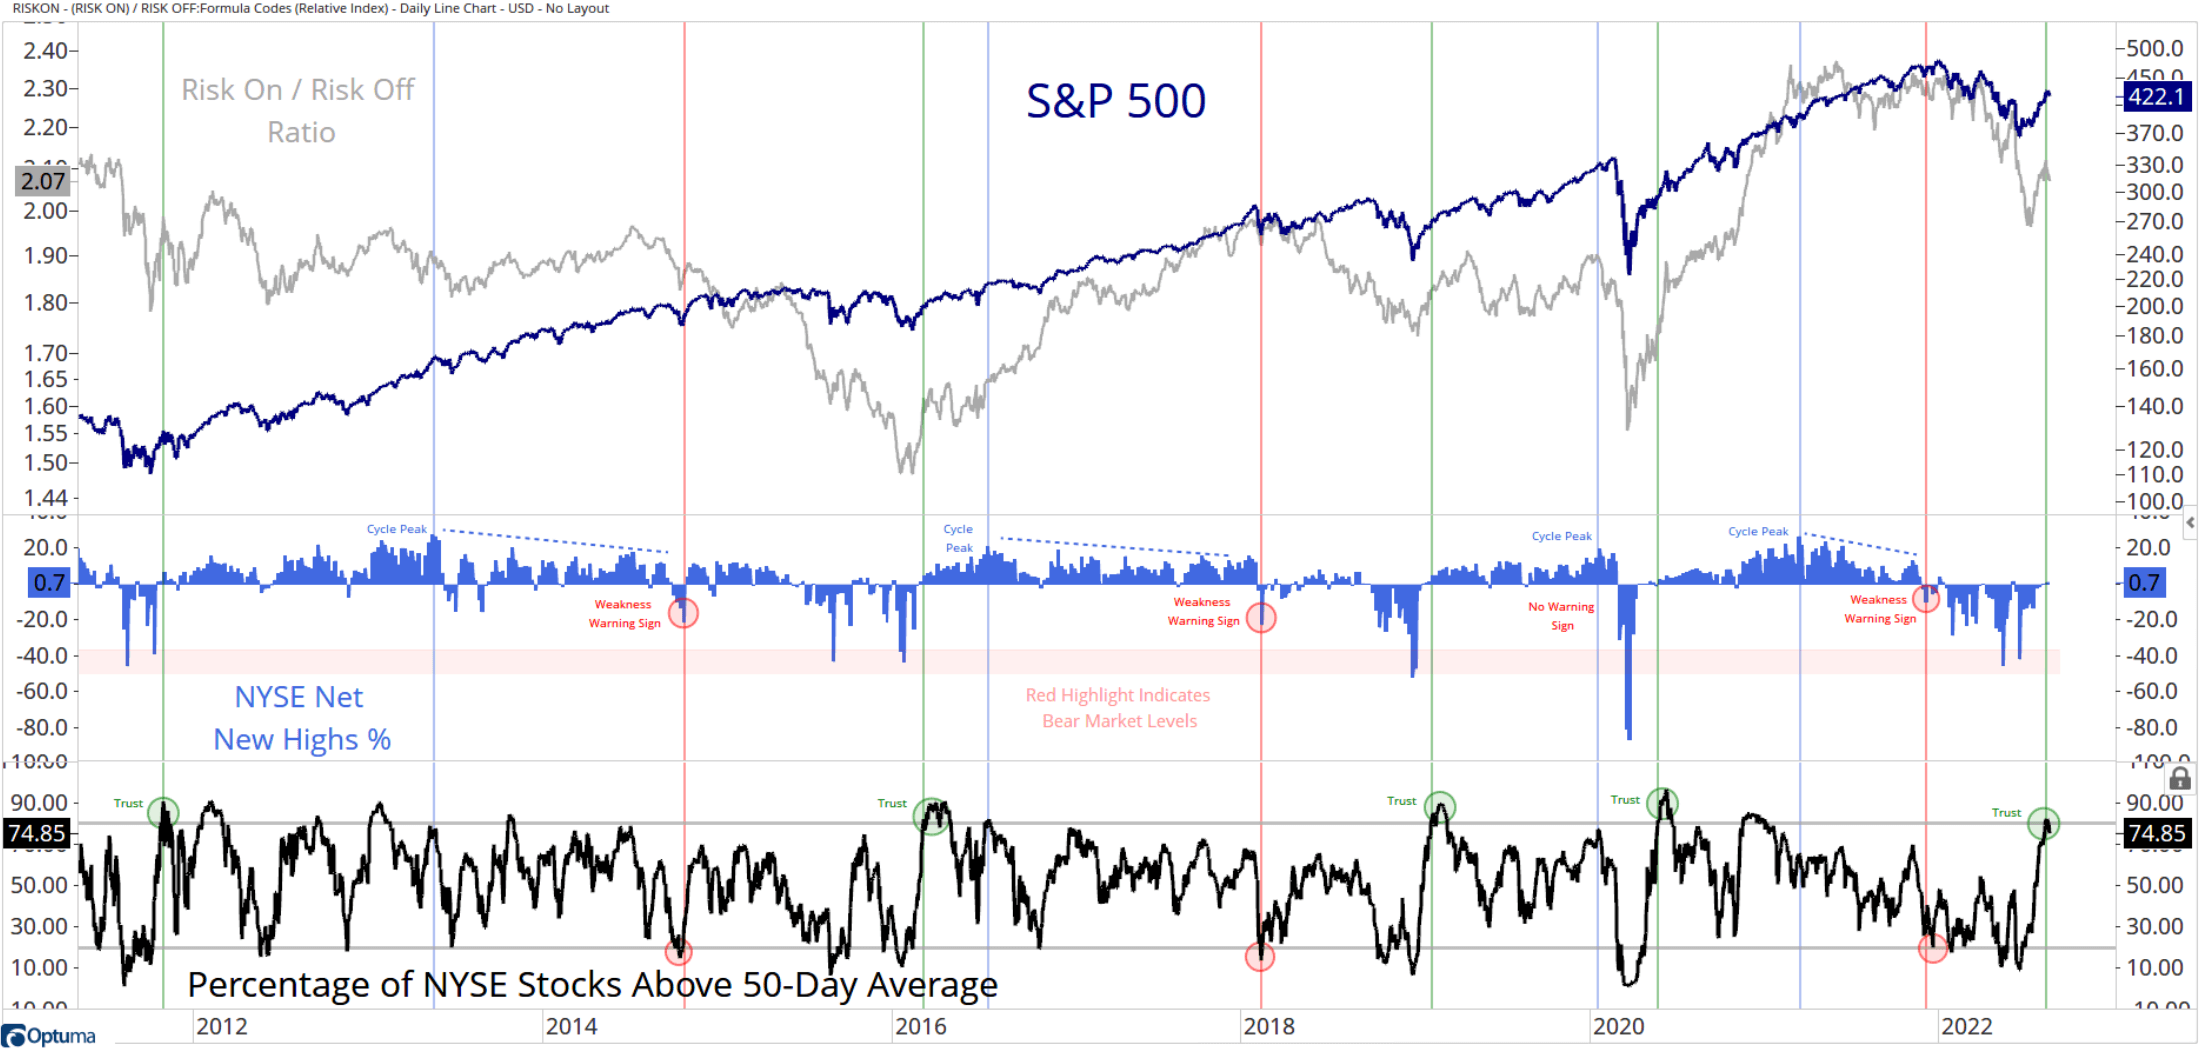
Grant Hawkridge show us a similar percentage of stocks above the 50-day moving average, but instead of S&P 500, this is the broader stocks listed on the NYSE. He also showed us the negative thrust as well. I think this chart probably shows how noisy it can be to decipher how the market would go purely based on one signal. There are a lot periods you would sell out early, purely based on these signals.
New high on the Advance and Decline line, but that was five days ago.
Given signal metrics might not work all the time. Usually, it may be better to reflect upon a broad range to get a sense of whether the market structure is improving or not so much out of the woods yet. If we review them this way, there are more positive signs.
Many questioned whether this upward move was a resumption or a bear market rally. The data shows that if this is a bear market rally, what we just had would be the most significant bear market rally after their drawdowns. We are not saying this cannot be the most significant but if it is this time it will be unprecedented.
A review of similar retracement during the COVID period.
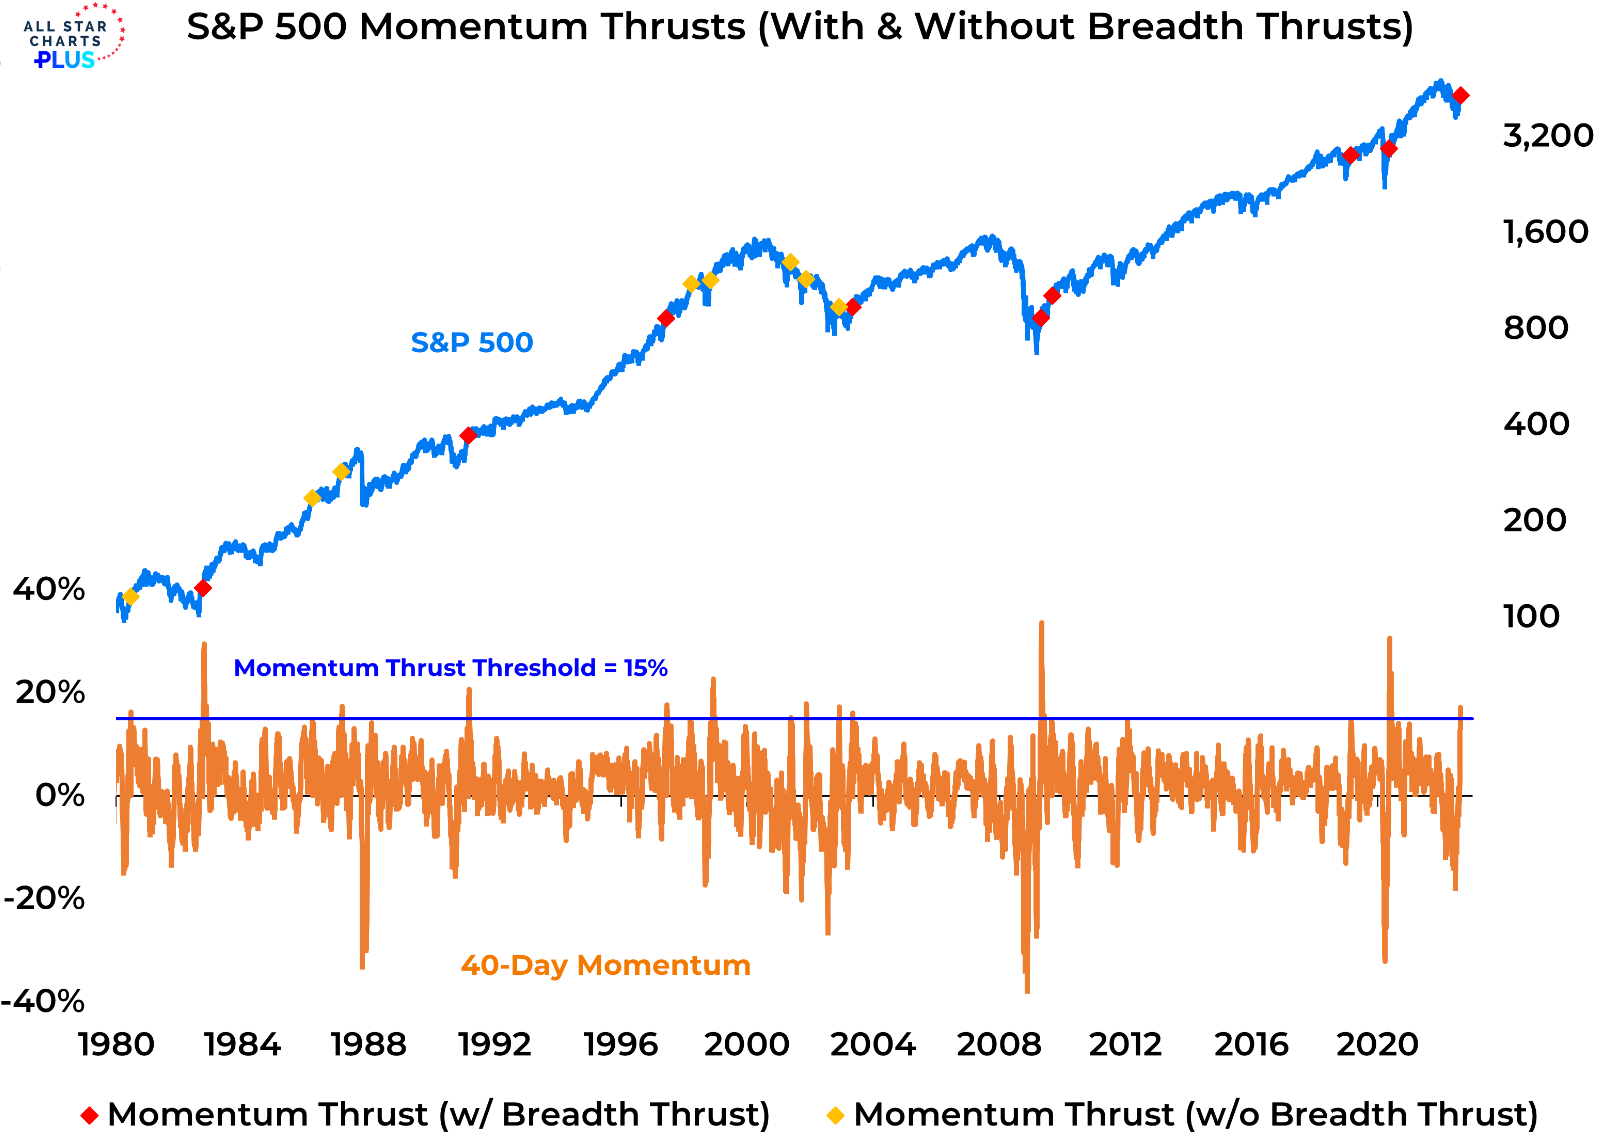
A breadth thrust is a sudden shift in the number of stocks that are declining and advancing within a short period. The number of stocks that advance usually has to outnumber those that are declining by two or two and a half times over a short five to ten-day period.
It is a fancy way of saying the rate of change.
In this chart, Willie showed up not about breadth thrusts but a sudden shift in 40-day momentum (momentum thrust). This does generate a few signals over the past 42 years. But if we overlay the momentum change with periods with breadth thrust, we realize that they may filter out some of the signals generated during bear market rallies.
Here are the subsequent returns followed by this momentum thrusts.

This chart builds upon the previous by showing the average return whether we overlay with breadth thrust on the momentum indicator or not.
If you want to trade these stocks I mentioned, you can open an account with Interactive Brokers. Interactive Brokers is the leading low-cost and efficient broker I use and trust to invest & trade my holdings in Singapore, the United States, London Stock Exchange and Hong Kong Stock Exchange. They allow you to trade stocks, ETFs, options, futures, forex, bonds and funds worldwide from a single integrated account.
You can read more about my thoughts about Interactive Brokers in this Interactive Brokers Deep Dive Series, starting with how to create & fund your Interactive Brokers account easily.
Kyith is the Owner and Sole Writer behind Investment Moats. Readers tune in to Investment Moats to learn and build stronger, firmer wealth foundations, how to have a Passive investment strategy, know more about investing in REITs and the nuts and bolts of Active Investing.
Readers also follow Kyith to learn how to plan well for Financial Security and Financial Independence.
Kyith worked as an IT operations engineer from 2004 to 2019. Currently, he works as a Senior Solutions Specialist in Insurance Start-up Havend. All opinions on Investment Moats are his own and does not represent the views of Providend.
You can view Kyith's current portfolio here, which uses his Free Google Stock Portfolio Tracker.
His investment broker of choice is Interactive Brokers, which allows him to invest in securities from different exchanges all over the world, at very low commission rates, without custodian fees, near spot currency rates.
You can read more about Kyith here.
- My Dividend Experience Investing in UCITS iShares iBond Maturing in 2028. - April 23, 2024
- We Invest into Popular Funds When They Are Popular, Exactly When They Started Turning to Shxt. - April 22, 2024
- Meal Prep 2.0 – Cooking Your “Go-to” Meal that You Look Forward to Eating Everyday. - April 21, 2024
amjed
Monday 5th of September 2022
It was an excellent write-up which clearly explains us about trading methodology. If any one looking for the best trading platform the visit www. vestingfx. com for excellent return on investment . Once again thanks for such an informative article
Kyith
Tuesday 6th of September 2022
thanks
Revhappy
Saturday 27th of August 2022
Well well, Powell just thrust his big hammer on the markets and crashed it. All the charts can go for a toss. Charts are just history and they have no utility for the future. If chart really could predict anything, it would be easy to make money in the markets.
Sinkie
Sunday 21st of August 2022
Yup, my bunch of breadth, breadth thrust, +ve medium-term oscillator divergences, medium-term momentum indicators still intact from late-June. Extreme -ve sentiments indicators have of course largely disappeared from May/June period.
Some people are concerned about missing the first 20% gains or stocks are now expensive, but miss the potential 100% to 300% over the next few years or decade.
Anyway every investor, dog, cat, rat, cockroach are expecting a big crash in Oct. Not so sure if it'll happen when everybody is expecting it, but if so I'll be using up the rest of my warchest.
Revhappy
Tuesday 6th of September 2022
@Kyith, So this article actually marked the top of the bear market rally right? So what is the point? We should have sold and not bought right?
Kyith
Tuesday 30th of August 2022
yup
Revhappy
Sunday 21st of August 2022
But after a 20% upmove if we buy now, is it not a bit ironic? We wait for a 20% upmove means we missed 20% if the gains.