There is a portfolio strategy on steroids that some people talked about.
The Hedgefundie’s Excellent Adventure.
Optimized Portfolio has a good summary of the strategy.
Basically:
- You invest in two portfolios: A highly leveraged equity portfolio and A highly leveraged bond portfolio.
- Decide upon an optimal asset allocation.
- Rebalance the portfolio at an optimal frequency.
The most popular strategy is to use a combination of:
- 3 times leveraged S&P 500 ETF
- 3 times leveraged 20-Year US Treasury ETF
A rebalancing frequency that people came to was to do it monthly. If the portfolio weight deviates by more than 5%, rebalancing is also triggered.
A backtested result from 1987 to 2018 shows that this strategy has a compounded average growth of 16% p.a. compared to 9.8% p.a. for an S&P 500 ETF. The interesting thing is that the worst drawdown for the strategy is similar to the worst drawdown of the S&P 500 (-50%).
But this strategy is very volatile.
2022 is a unique year where both stocks and bonds don’t do well.
Bonds, in particular, had one of the worst performances in the past 50 years at least.
A 20-year US Treasury will suffer more due to the long duration. The duration, measures the sensitivity of bonds to changes to interest rate. A rule of thumb (if we ignore the nuances) is a 1% up/down move in interest rate yield will change the price by its duration.
So a 1% rise in yield for a 20-year US Treasury will drop the price by almost 20%. So what happens if interest rate rises 4%?
Not good.
I knew the price performance of a 20-year Treasury ETF does not look good. I pondered more and wondered how would someone who has implemented the Hedgefundie strategy did.
So I decided to simulate the portfolio performance.
Individual Performances of the Leveraged ETFs
I wondered what would be a good time period to simulate.
I decided to simulate a portfolio that manages to capture the upside and the downside.
Here is the price chart of TMF, the ticker for the Direxion Daily 20+ Year Treasury Bull 3X Shares ETF:
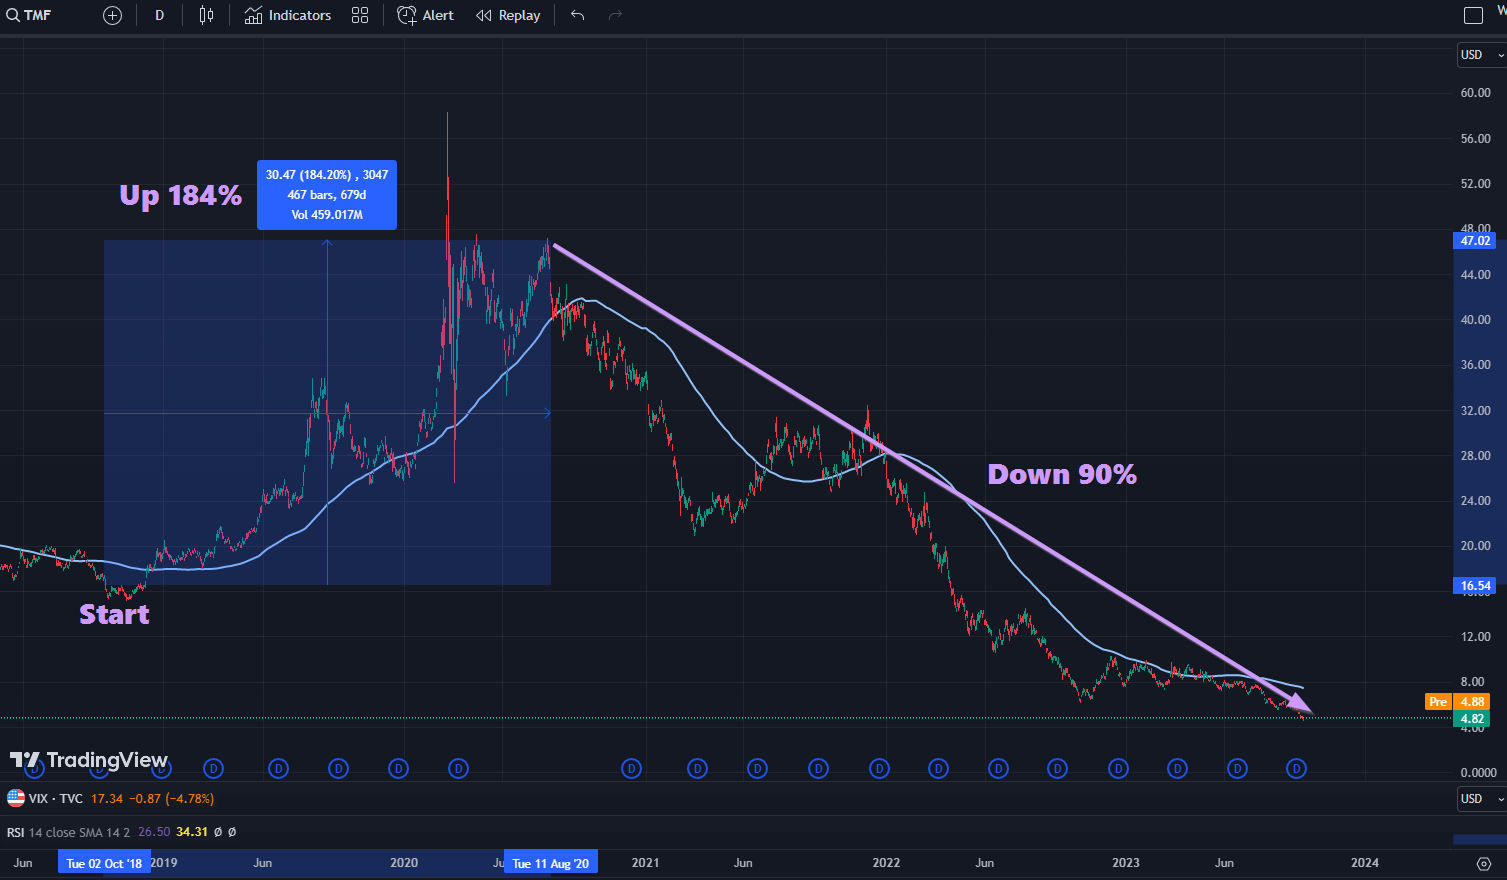
Almost exactly five years ago, the 3 times leveraged 20Y bond ETF went up an astounding 184% (!!!).
Then it came down 90%.
Price started around $16, went to $47 then came back down, and went past to $5!
Here is the price chart of UPRO, the ticker for ProShares UltraPro S&P500 ETF:
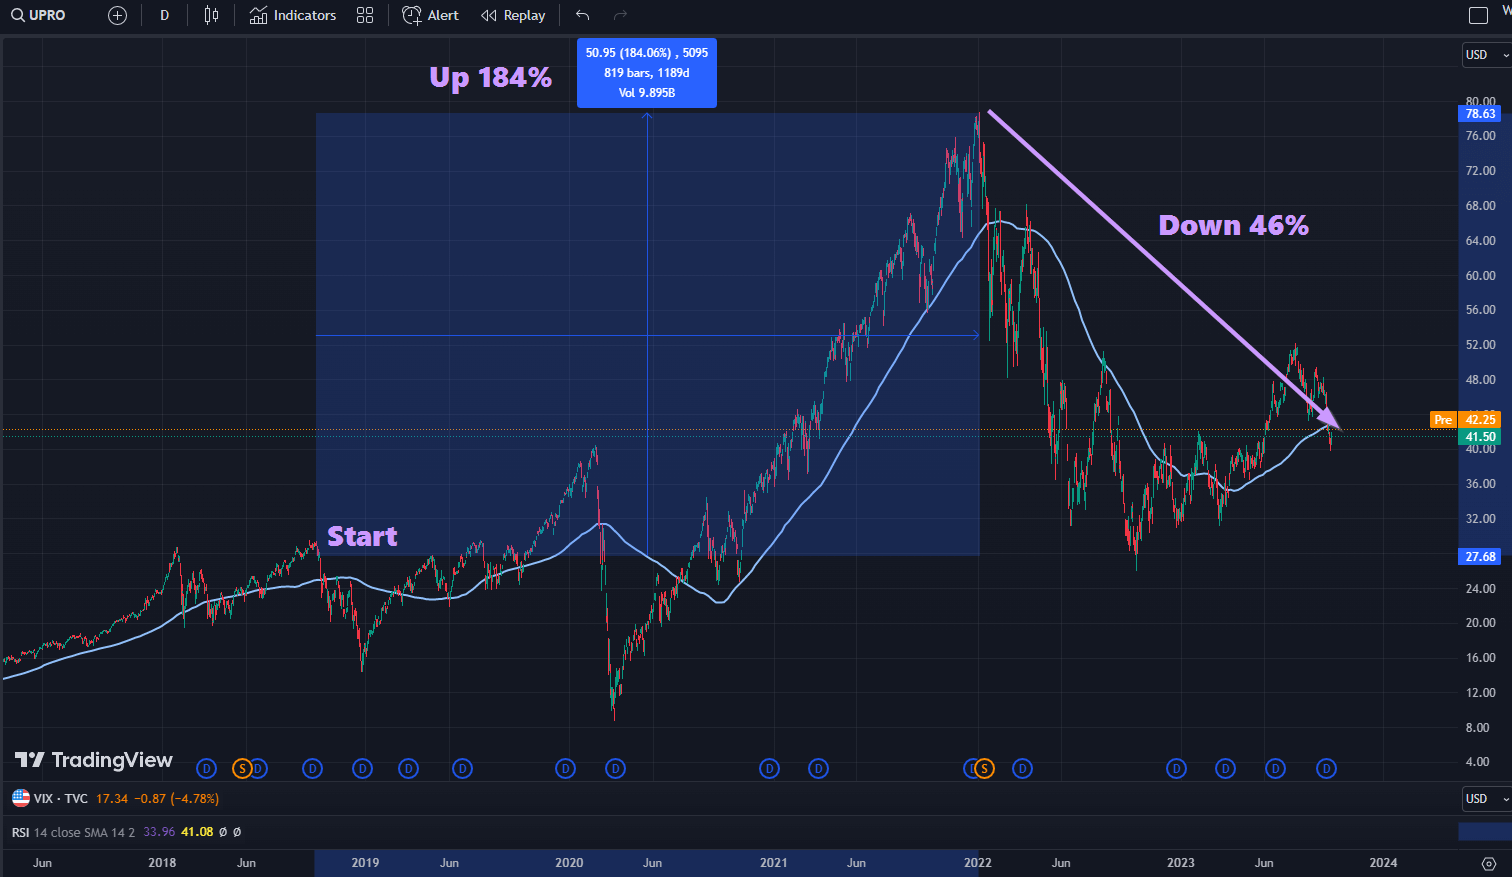
The price went up 184% similarly but as of yesterday, only came down 46%.
If we invest $100,000 of our money in each of these ETFs, UPRO would have gain $70,000 or 70% but the 100% TMF investor would have lost at least 66%.
The Performance of an Implementation of the Hedgefundie Strategy
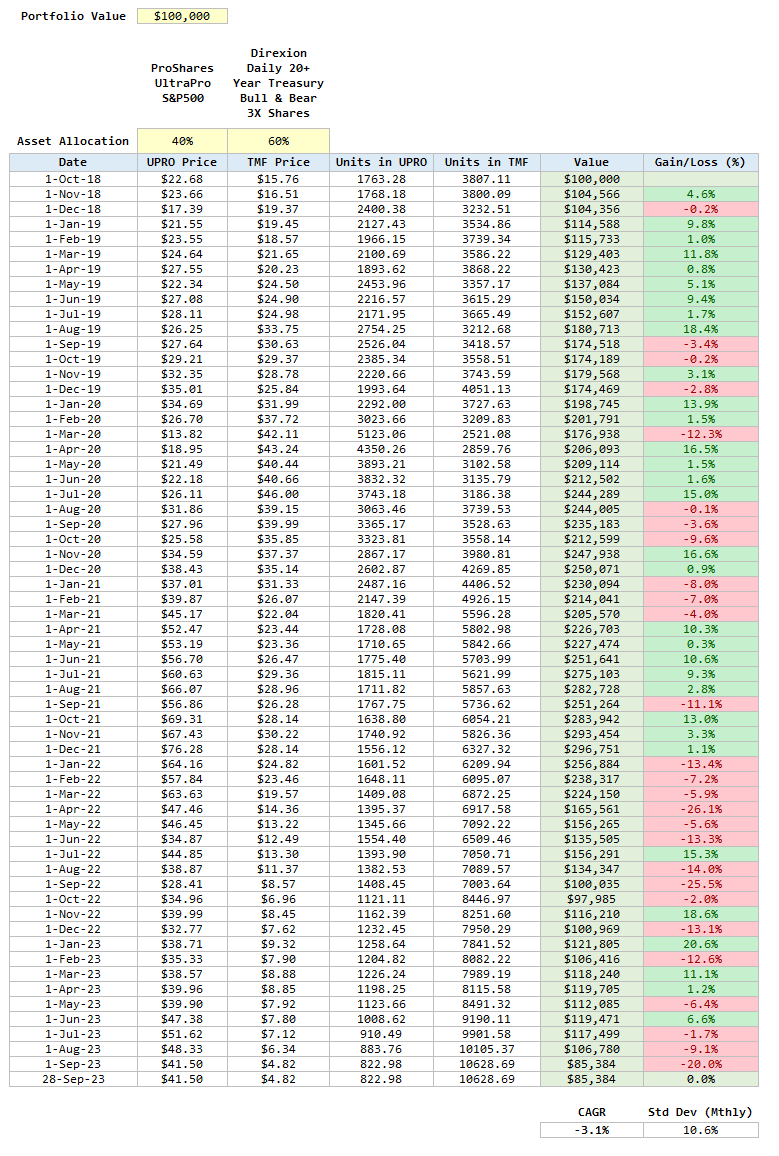
Here are the parameters that I have implemented:
- 40% TMF
- 60% UPRO
- Rebalance every month
- Ignore any trading costs.
- Ignore the dividend earned from the ETFs
- Start with a portfolio value of $100,000 in 1st Oct 2018 and evaluate the performance five years later on 29th Sep 2023.
There are a few implementations and I would prefer to use 60% UPRO but they might think a higher leveraged bond allocation is more optimal.
We compare the performance against a 40% Unleveraged S&P 500 and 60% Unleveraged 20-year Treasury Accumulating ETF and a 100% S&P 500 ETF. We only rebalance every half-yearly for the unleveraged portfolio.
Here are the growth of $100,000:
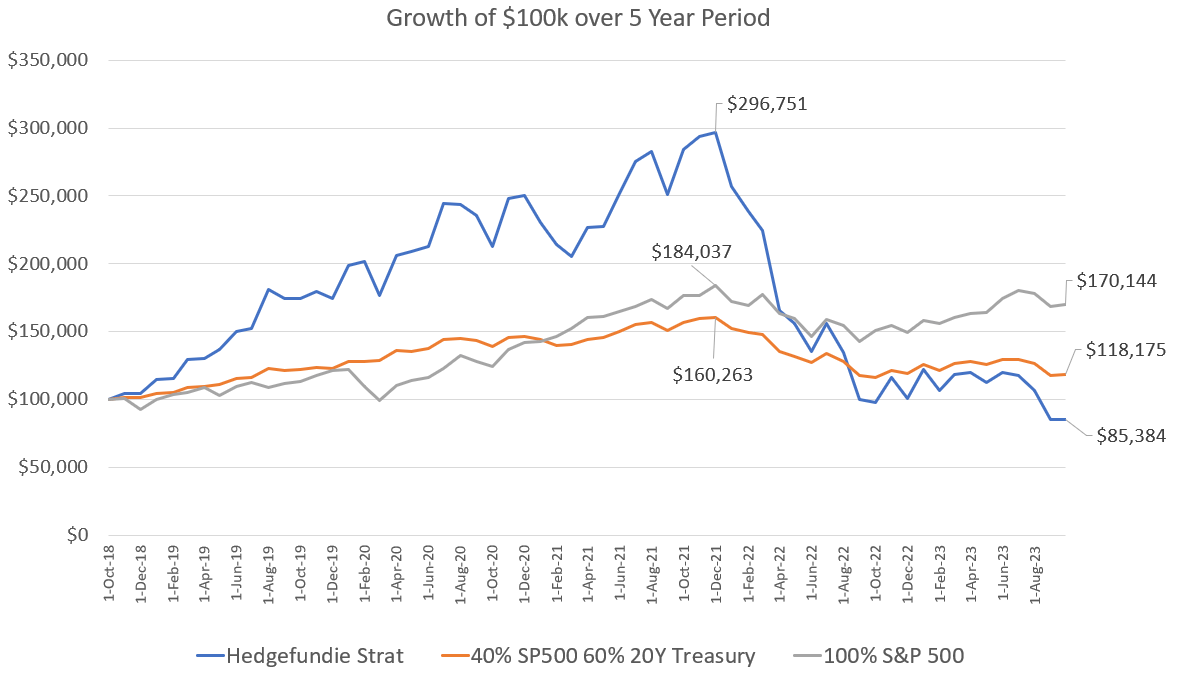
At one point, $100,000 in the Hedgefundie portfolio grew 200% to $296,751 before giving everything back and going down to $85,384.
If we had use an 50/50 portfolio instead, it would have ended with $100,000.
Having more bonds happens to work against the portfolio in this rather unique time period.
In contrast, the unleveraged portfolio grew to $118,175 despite the poor 20-year US Treasury performance. The S&P 500 grew to $170,144.
Here are the compounded average growth:
- Hedgefundie: -3.1% p.a.
- S&P 500: 11.2% p.a.
- 40% S&P 500 60% 20Y US Treasury: 3.4% p.a.
My first impression is that it wasn’t so bad. The 70% rise in the S&P 500 and rebalancing probably gave the portfolio a respectable result.
Here is how the portfolio simulation look like on a play by play basis:
Will You be Able to Live Through the Journey to Earn the Return??
Many of us invest because the performance look attractive enough.
But we often forget that to get to the result we have to live through the experience.
In order to execute this Hedgefundie strategy, you have to:
- Stay invested
- Execute the rebalancing yourself!
This means that you have to pay attention enough to what the portfolio is doing, and be able to execute the rebalancing.
I wonder how many people can do that like a mechanical robot.
I stacked the monthly change in portfolio value in the following chart:
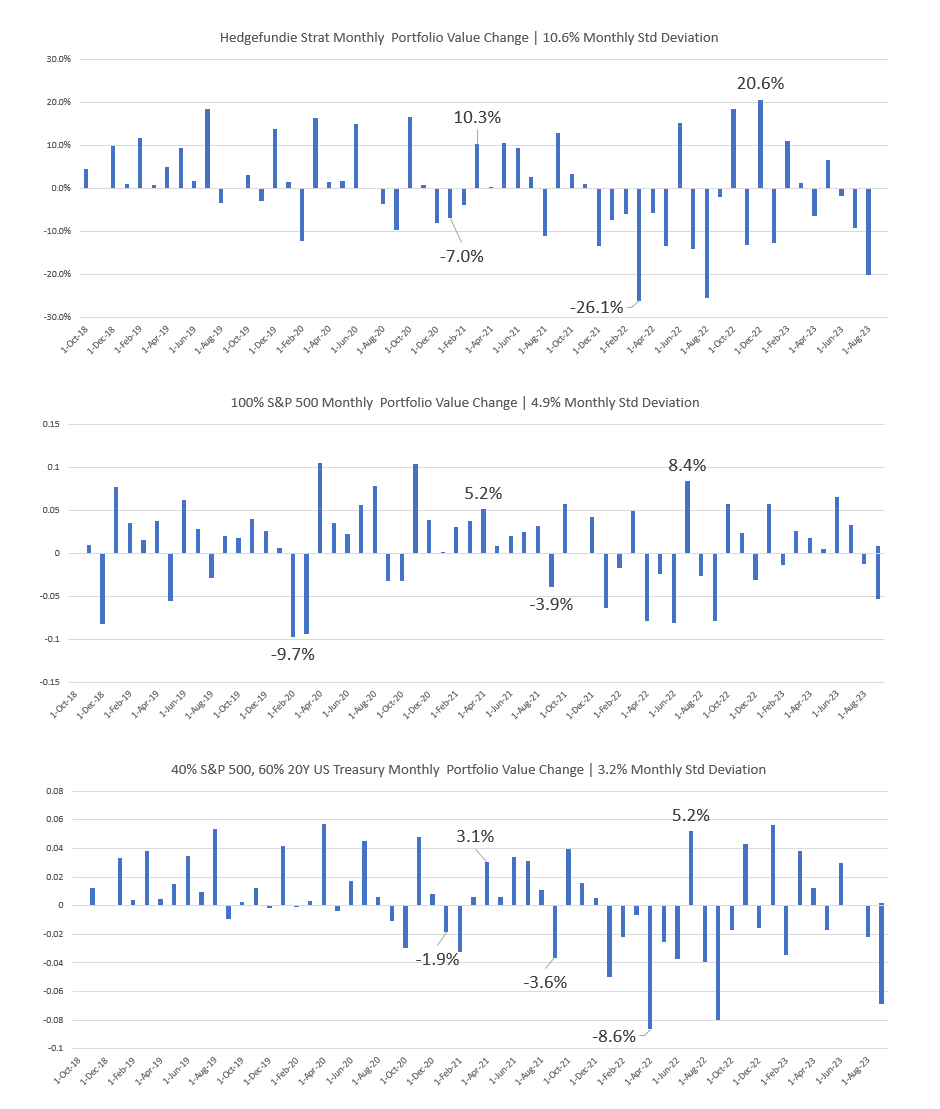
The shift in monthly portfolio value is in the 10% range.
In contrast, a 100% S&P 500 has half the volatility.
I seriously wonder how many can mechanically sit through rebalancing when the portfolio gets cut from $296k to $135k in 7 months.
I would like to think many cannot.
Positive Correlation between Bonds and Equity is the Norm instead of being Uncommon
The chart below shows the long term 10-year correlation between bonds and equity:
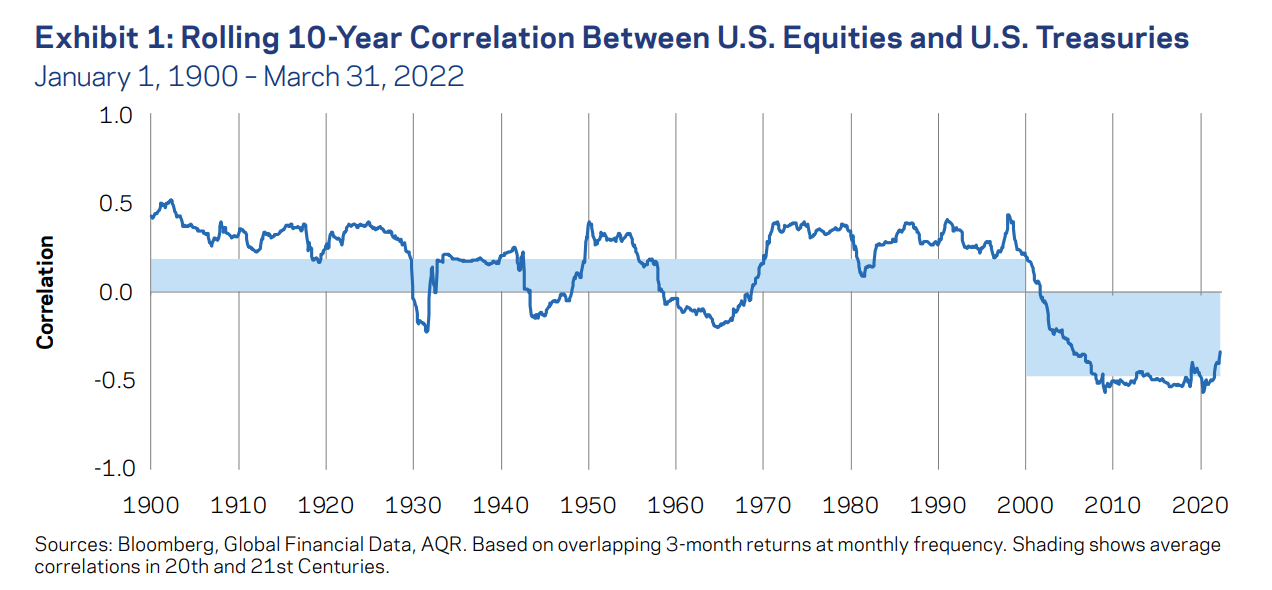
Over the past 120 years, bonds are positively correlated with equities. The last 20 years is more of an uncommon situation.
Correlation is not always negative. Bonds and equities can go up at the same time. But I wonder if we factored in a longer time period, would past results show us something that we might not encountered?
I suspect it would.
The Magic of Rebalancing Crazy Things Over Time
What makes this strategy unique is that if you rebalance very volatile things over time, even though they may or may not have positive expected returns in the long run, you get positive expected returns.
Claude Shannon, an American mathematician, MIT professor, electrical engineer, and World War II cryptographer, was able to show us that you could take a volatile asset that never would earn any long-term return (i.e., it just randomly moved up and down over time), and convert it into a valuable contributor to a wealth-generating portfolio through the simple process of rebalancing.
This is called Shannon’s Demon.
You can read more about the Demon here.
We can create portfolios by flipping coins and if it ends up heads we win a certain sum and if it is tails we lose a certain sum. If we keep doing this over time, our results are like a spectrum.
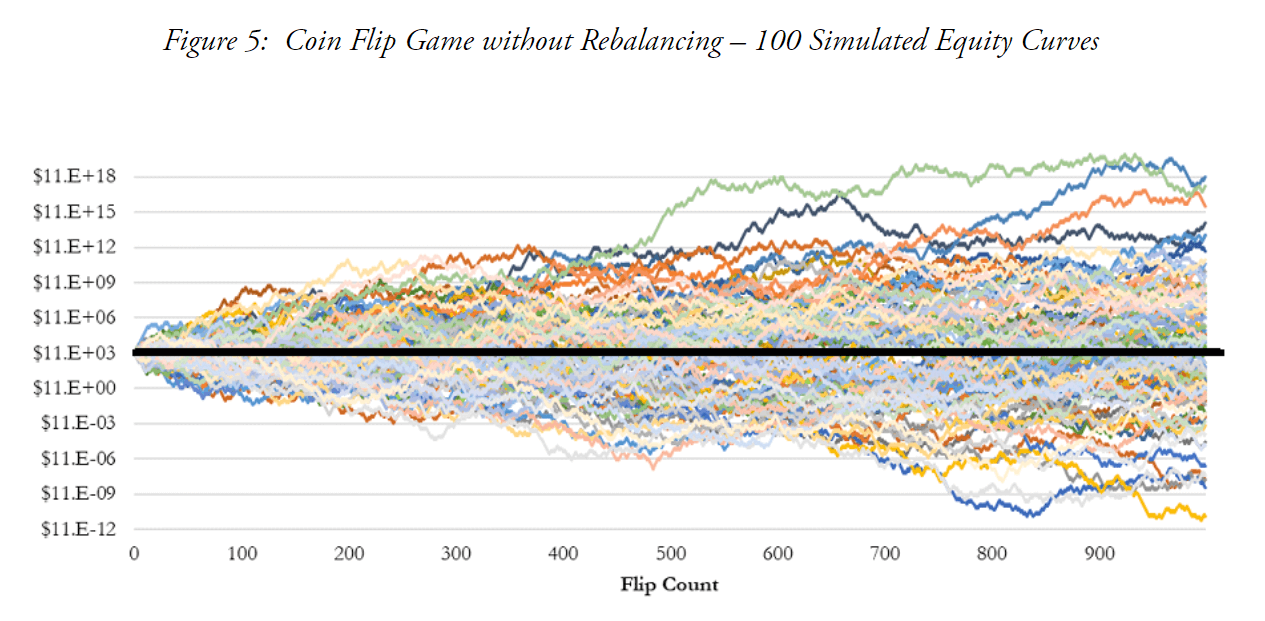
This is not too different from investing in stocks and fixed income where the future is uncertain.
But what if we constantly rebalance these coin flip with 50% cash holdings?
Technically, 50% of the portfolio is in outcome is uncertain, and the other 50% is in something that has zero expected return. This should not end well.
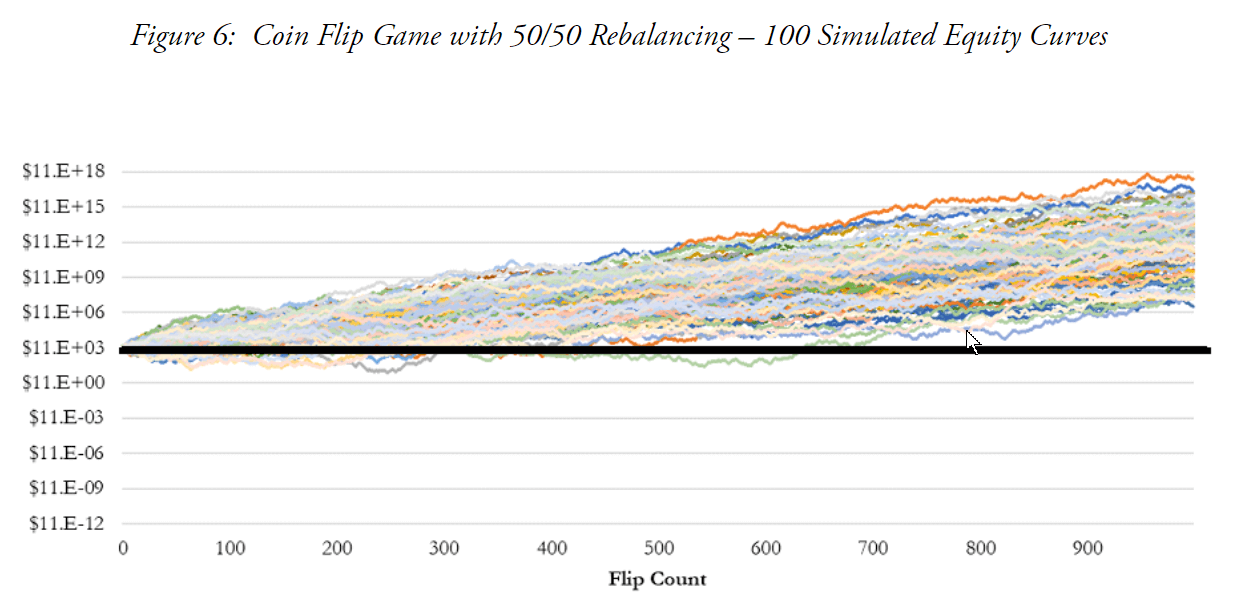
But what happens is that if we do this long enough (subjective), the equity curves all become positive over time.
Coin flip portfolios, like our portfolios, are very volatile and the more volatile the portfolio (like Hedgefundie’s Adventure), the more it reduces the long-term geometric return (refer to the article I posted at the start of this section).
Rebalancing tries to bring the portfolio back to the arithmetic return, which is the positive average return.
The learning lesson is that if you don’t tame volatility, no matter how good the returns, you may not be able to harvest it.
The constant rebalance probably saved the portfolio from worse results.
The Outcome is Not Concluded Yet
It is easy to conclude at this point that this Hedgefundie’s Adventure doesn’t work out.
But when we invest, we are investing over a longer time frame. I think it will be interesting to revisit this portfolio once in a while to see if the portfolio stages a remarkable comeback.
We often wonder if this strategy in our heads will work in real life and having a backtested strategy may answer some questions.
But if we don’t have long enough data, across different scenarios, or poorly designed tests, then we may make some error judgments.
But what I can conclude is that not everyone would want a portfolio that they have to execute themselves, and put themselves in the loop. The system is flawed because you are introducing a deeply flawed component (you) that could greatly jeopardize the system.
Ultimately, the right portfolio for you is one that you can live with.
If you want to trade these stocks I mentioned, you can open an account with Interactive Brokers. Interactive Brokers is the leading low-cost and efficient broker I use and trust to invest & trade my holdings in Singapore, the United States, London Stock Exchange and Hong Kong Stock Exchange. They allow you to trade stocks, ETFs, options, futures, forex, bonds and funds worldwide from a single integrated account.
You can read more about my thoughts about Interactive Brokers in this Interactive Brokers Deep Dive Series, starting with how to create & fund your Interactive Brokers account easily.
Kyith is the Owner and Sole Writer behind Investment Moats. Readers tune in to Investment Moats to learn and build stronger, firmer wealth foundations, how to have a Passive investment strategy, know more about investing in REITs and the nuts and bolts of Active Investing.
Readers also follow Kyith to learn how to plan well for Financial Security and Financial Independence.
Kyith worked as an IT operations engineer from 2004 to 2019. Currently, he works as a Senior Solutions Specialist in Insurance Start-up Havend. All opinions on Investment Moats are his own and does not represent the views of Providend.
You can view Kyith's current portfolio here, which uses his Free Google Stock Portfolio Tracker.
His investment broker of choice is Interactive Brokers, which allows him to invest in securities from different exchanges all over the world, at very low commission rates, without custodian fees, near spot currency rates.
You can read more about Kyith here.
- My Dividend Experience Investing in UCITS iShares iBond Maturing in 2028. - April 23, 2024
- We Invest into Popular Funds When They Are Popular, Exactly When They Started Turning to Shxt. - April 22, 2024
- Meal Prep 2.0 – Cooking Your “Go-to” Meal that You Look Forward to Eating Everyday. - April 21, 2024