Last weekend, I came across two pieces of research that talk about style factors in relation to recession and bear markets, which sounds interesting to me.
The first report from First Eagle reflects upon their investment management in 2023 and covers economics, market valuation, small cap, private debt, housing. The second report is written by Morgan Stanley about Equity “Compounders” in a European investing context.
Both reports provide insights on the timing of style factors or how well style factors are impacted by economic cycle changes.
I thought I would go through some charts that might be interesting to me.
The first one is from First Eagle.
First Eagle explains that small caps traditionally have done well in a rising rate environment. However, their performance was heavily affected by regional bank failure and uncertainty in March 2023. First Eagle’s observation is similar to the small-cap data that I observed of the 1970s.
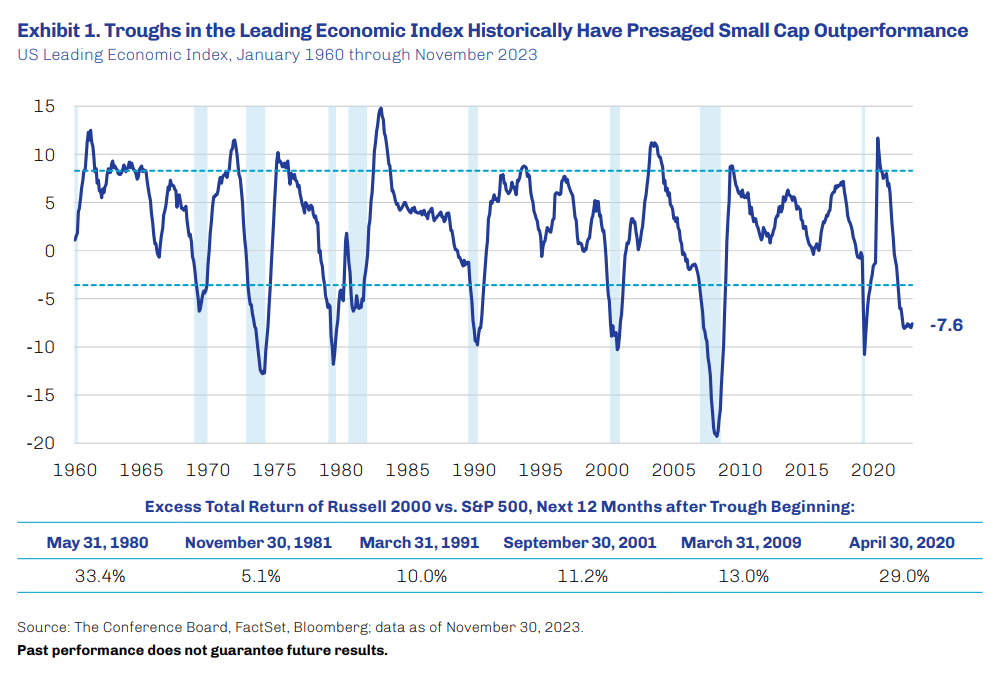
First Eagle then provides this data chart of the Leading Economic Index (LEI), a composite index of economic and market variables that, in aggregate, purports to anticipate potential turning points in the business cycle.
When the LEI is at the troughs, historically it augurs well for the performance of small cap stocks relative to large caps. We observe that we may be in the process of a bottoming. The bottom of the chart shows past bottoming return outperformance relative to the S&P 500.
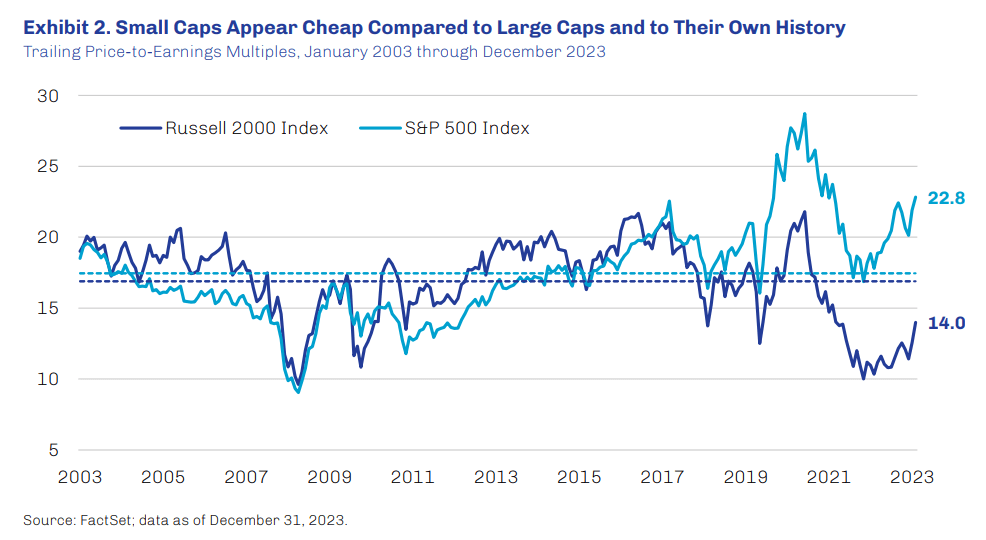
The next chart shows the relative cheapness of the Russell 2000 on a trailing PE basis. When this report came out the discount to historical was 17% but I think now it is closer to 22%, which indicates the gulf in valuation compared to historical is wider.
First Eagle made the following point:
- Discount for small cap stocks is a relatively recent phenomenon.
- From 2003 to 2017, small caps traded at a premium to large caps.
- Small cap value, in particular have outperformed their large cap value and growth counterparts over full investment cycles.
- Mean reversion historically has had a powerful influence over financial markets and may serve as an additionally tailwind for small stocks.
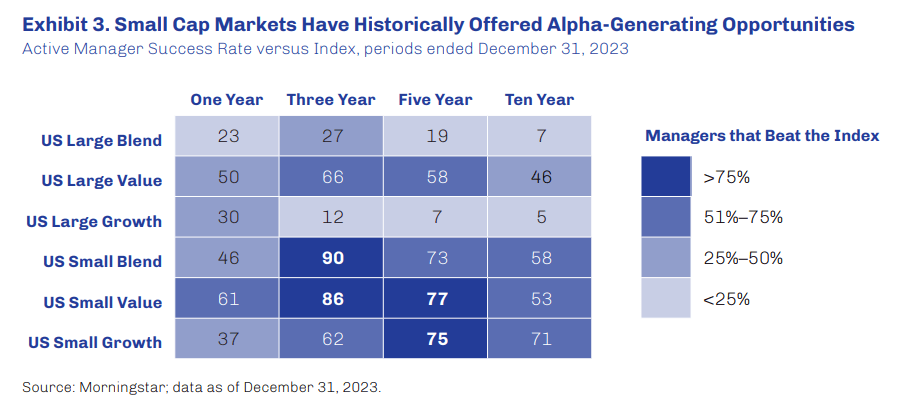
This chart basically shows that there are more inefficiency in the small cap space for active managers to generate alpha. The percentage of managers that manage to outperform the index is higher.
Quite interesting that this persist even in the small value and small growth space.
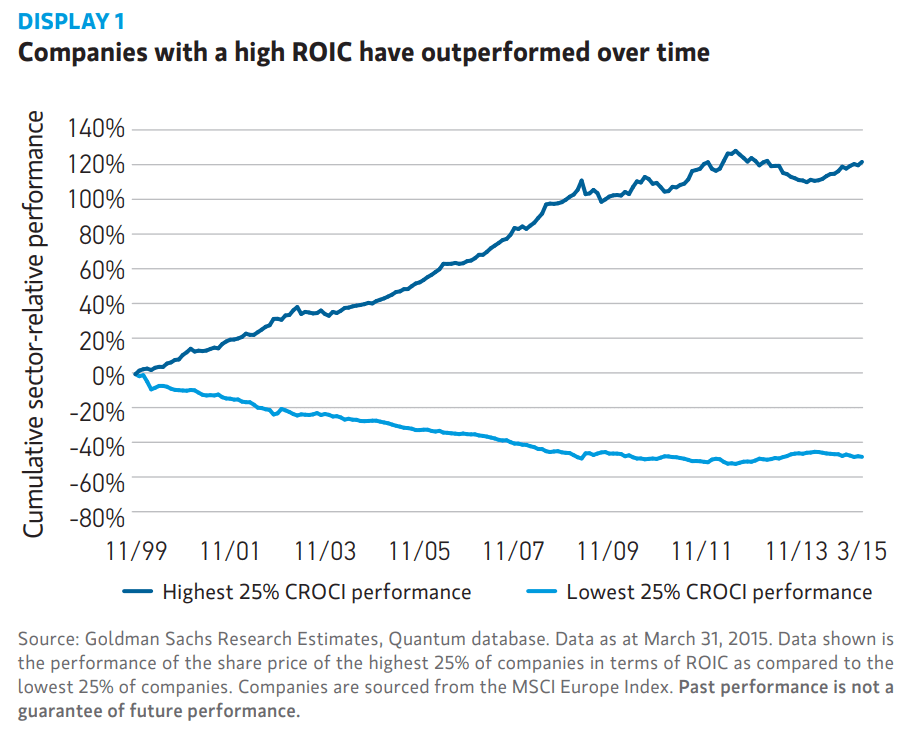
The chart above from Morgan Stanley highlights the difference in share price growth between companies in the MSCI Europe Index universe with a high ROIC (return on invested capital) and those with low ROIC.
Companies with a strong ROIC have substantially outperformed their peers over the long term.
They made the following points on quality:
- Relative strength of a company within its industry is more important than market capitalisation.
- Compounders enjoy high relative market share in monopolistic or oligopolistic markets.
- Companies enjoy high barriers to entry.
- Enjoy these better position due to their intangible assets they possess.
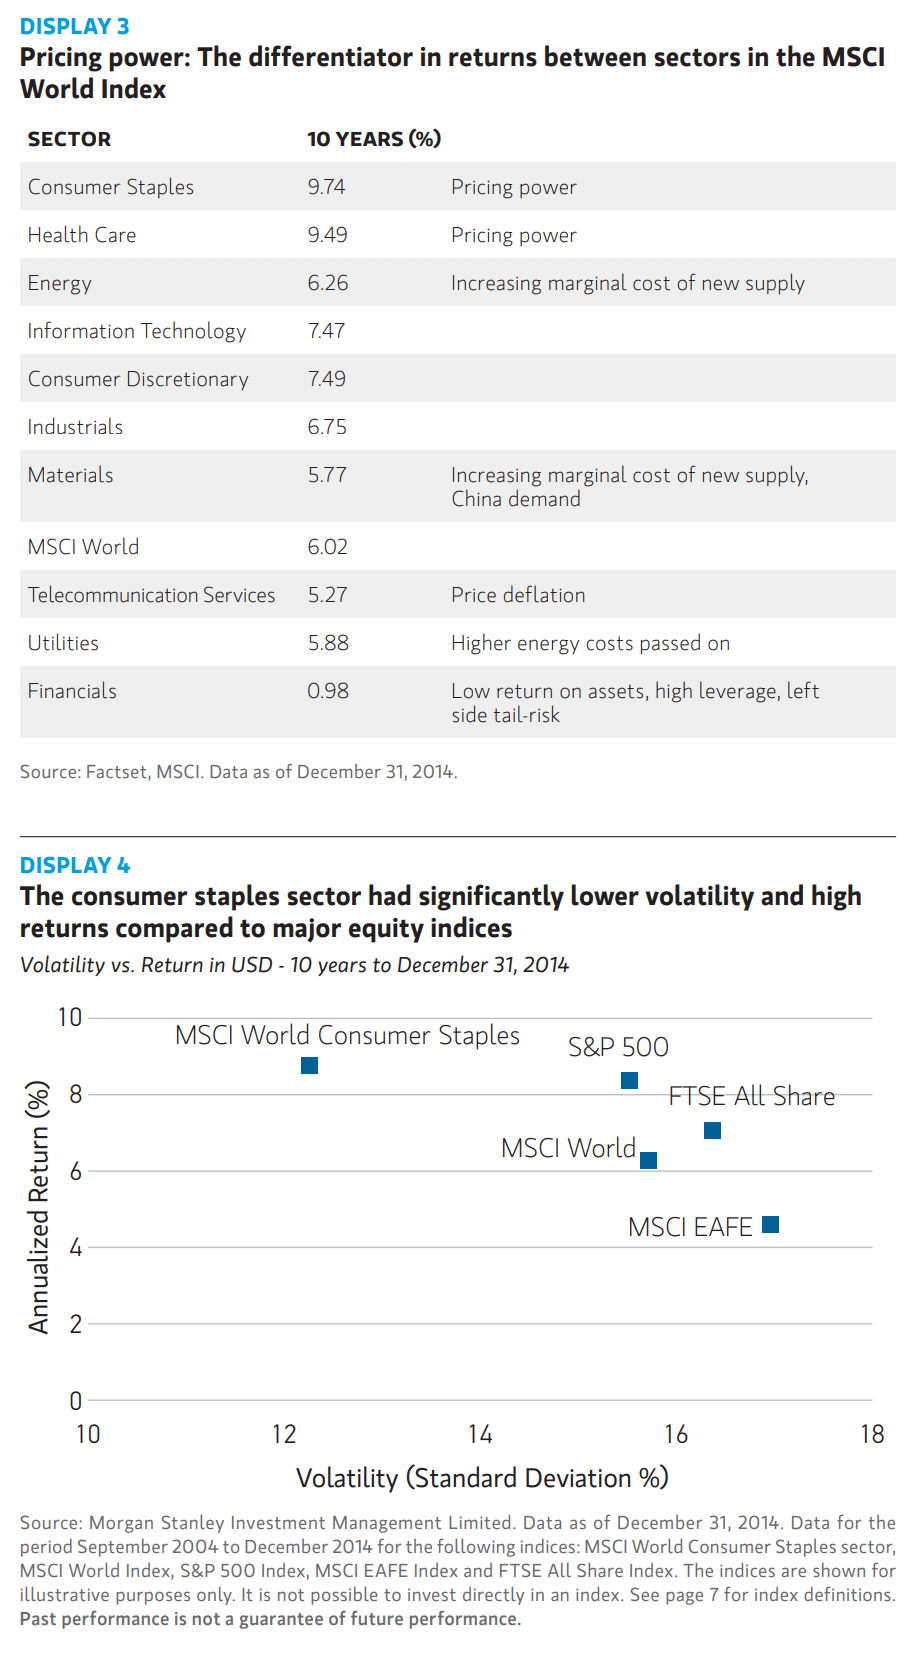
The table on top shows the sectors that are typically associated with higher quality. It explains why quality style funds have a fair bit of consumer staple and healthcare stocks.
The team at Morgan Stanley zoomed in to show that for the past decade, the MSCI World Consumer Staples have lower volatility than a blended MSCI World index but higher returns.
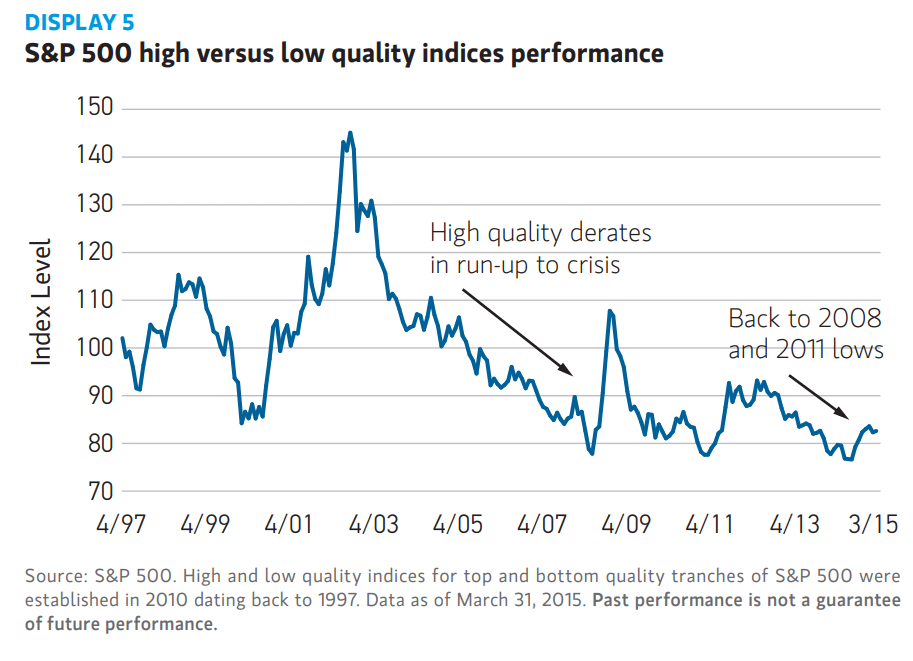
The chart above shows that the relative performance of high-quality stocks to low-quality stocks is back to 2008 and 2011 lows. The team feels that the valuations are not as attractive, on an absolute basis as they were in 2011, they believe that the type of high quality companies the team focus on can keep compounding in this tougher environment.
The team thinks that there are risk of overpaying for a high quality franchise stock.
They prefer to measure value on an absolute basis rather than relative basis. The metric to measure is equity free cash flow yield.
Currently, an investor can buy outstanding franchise stocks at a free cash flow yield of 5 to 6%.
You can read both reports here:
- First Eagle Reflections 2023-2024 Edition
- The Equity “Compounders:” The Value of Compounding in an Uncertain World
If you want to trade these stocks I mentioned, you can open an account with Interactive Brokers. Interactive Brokers is the leading low-cost and efficient broker I use and trust to invest & trade my holdings in Singapore, the United States, London Stock Exchange and Hong Kong Stock Exchange. They allow you to trade stocks, ETFs, options, futures, forex, bonds and funds worldwide from a single integrated account.
You can read more about my thoughts about Interactive Brokers in this Interactive Brokers Deep Dive Series, starting with how to create & fund your Interactive Brokers account easily.
Kyith is the Owner and Sole Writer behind Investment Moats. Readers tune in to Investment Moats to learn and build stronger, firmer wealth foundations, how to have a Passive investment strategy, know more about investing in REITs and the nuts and bolts of Active Investing.
Readers also follow Kyith to learn how to plan well for Financial Security and Financial Independence.
Kyith worked as an IT operations engineer from 2004 to 2019. Currently, he works as a Senior Solutions Specialist in Insurance Start-up Havend. All opinions on Investment Moats are his own and does not represent the views of Providend.
You can view Kyith's current portfolio here, which uses his Free Google Stock Portfolio Tracker.
His investment broker of choice is Interactive Brokers, which allows him to invest in securities from different exchanges all over the world, at very low commission rates, without custodian fees, near spot currency rates.
You can read more about Kyith here.
- My Dividend Experience Investing in UCITS iShares iBond Maturing in 2028. - April 23, 2024
- We Invest into Popular Funds When They Are Popular, Exactly When They Started Turning to Shxt. - April 22, 2024
- Meal Prep 2.0 – Cooking Your “Go-to” Meal that You Look Forward to Eating Everyday. - April 21, 2024