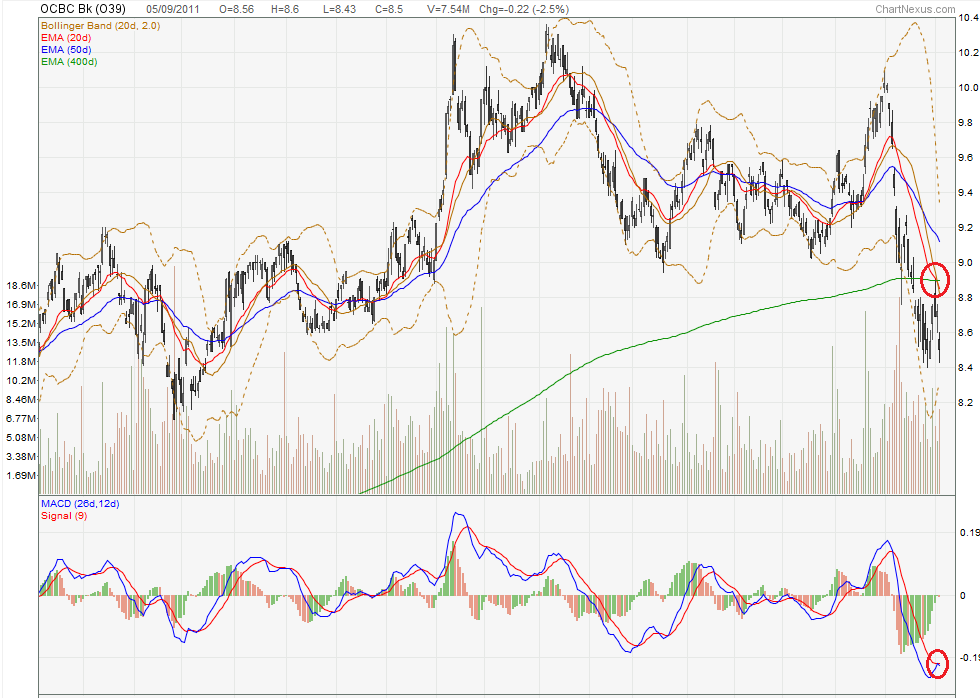
Here is a chart of OCBC. Notice that the price corrects above to the intersection of the 400 day moving average and the congregation of shorter moving averages and then moves downwards.
Very negative. The MACD looks to be doing a slingshot to the downside.
Latest posts by Kyith (see all)
- My Dividend Experience Investing in UCITS iShares iBond Maturing in 2028. - April 23, 2024
- We Invest into Popular Funds When They Are Popular, Exactly When They Started Turning to Shxt. - April 22, 2024
- Meal Prep 2.0 – Cooking Your “Go-to” Meal that You Look Forward to Eating Everyday. - April 21, 2024

