I am finally off work for the hectic 2023, so I will probably have more time to write about things.
And probably more time to do a couple of video podcasts.
Firstly, it is time to catch up with the state of the market going into 2024, where we are at, and what we can expect.
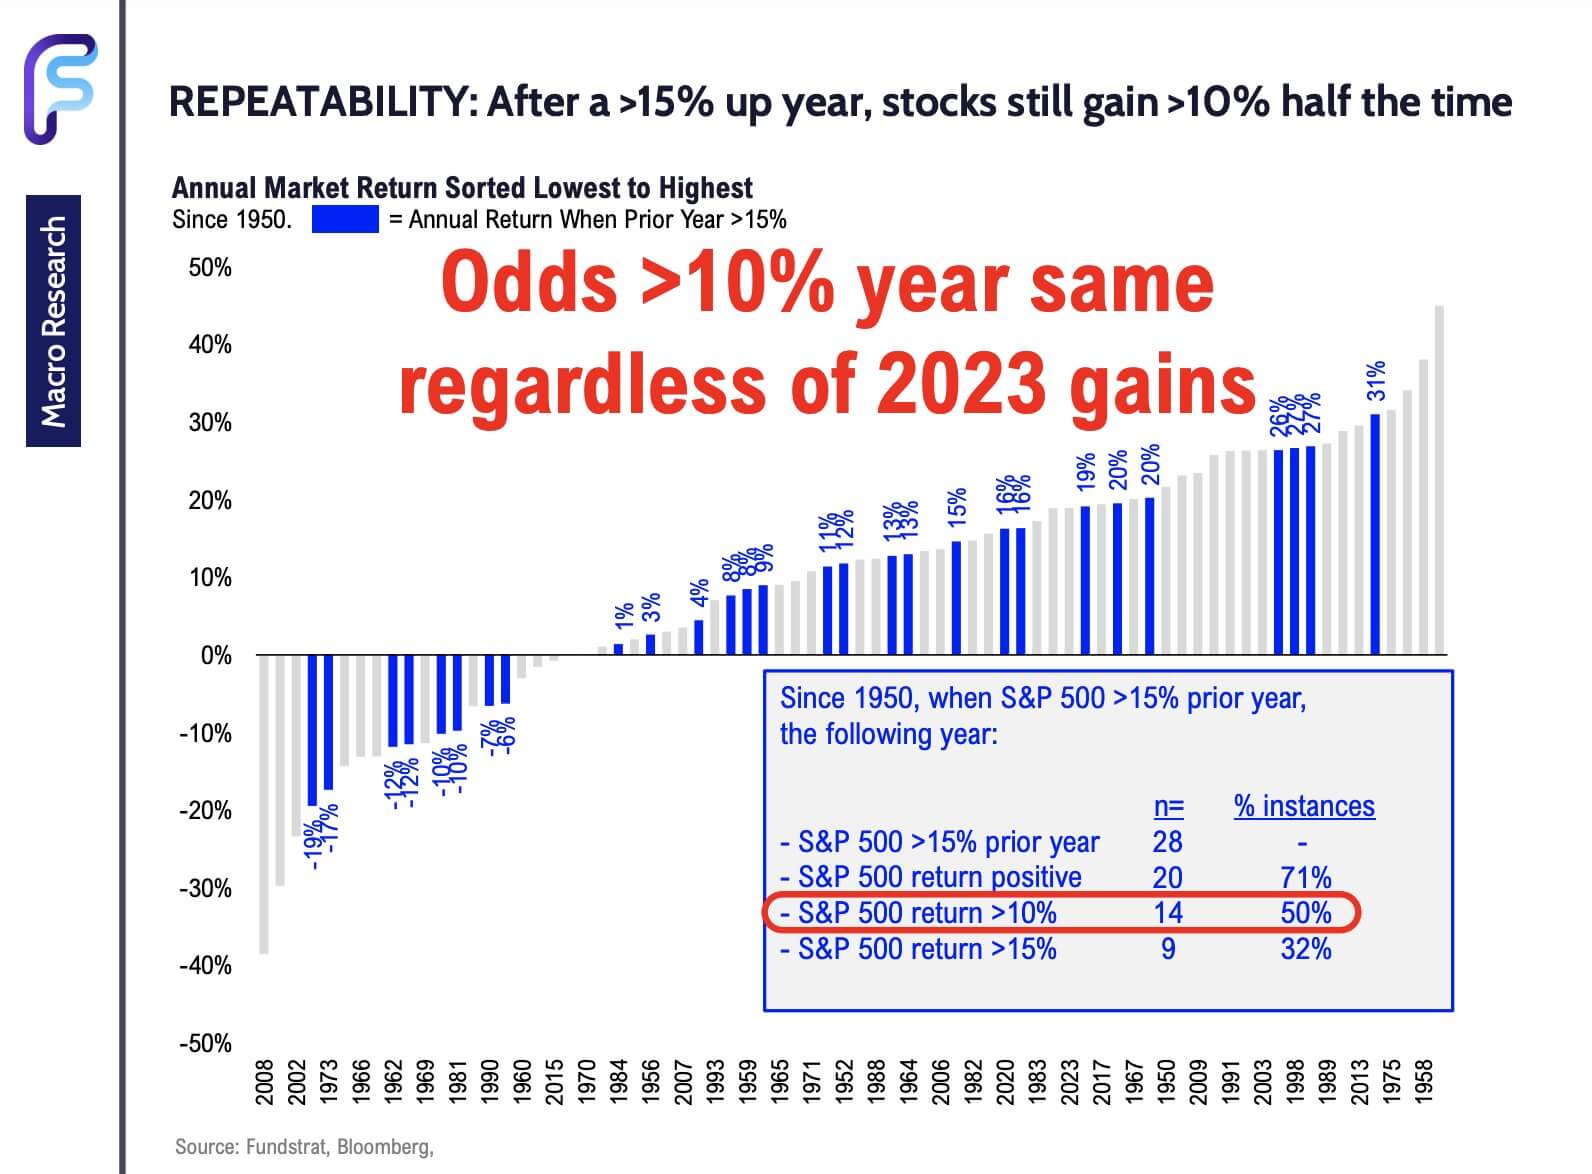
Tom Lee of FundStrat explains what he sees in 2024. He is optimistic about 2024 but then again, he has been positive for a long time. Inflation down and higher demand equals Price Earnings Expansion.
Many of us are expecting a recession and usually, the biggest part of the market fall happens during the recession.
If the recession doesn’t come, and there isn’t a -20% opportunity, people feel reluctant to invest. That “clear” -20% fall also makes many apprehensive about investing. This may explain the tough asset-gathering environment of 2023 as cash looks such a better alternative.
Tom’s main idea is that earnings per share of the market can be much higher, and all else being equal, the market can move higher.
But instead of returns staying with what has done well this year, it may likely be a broadening out of returns, with Financials and Industrials benefiting.
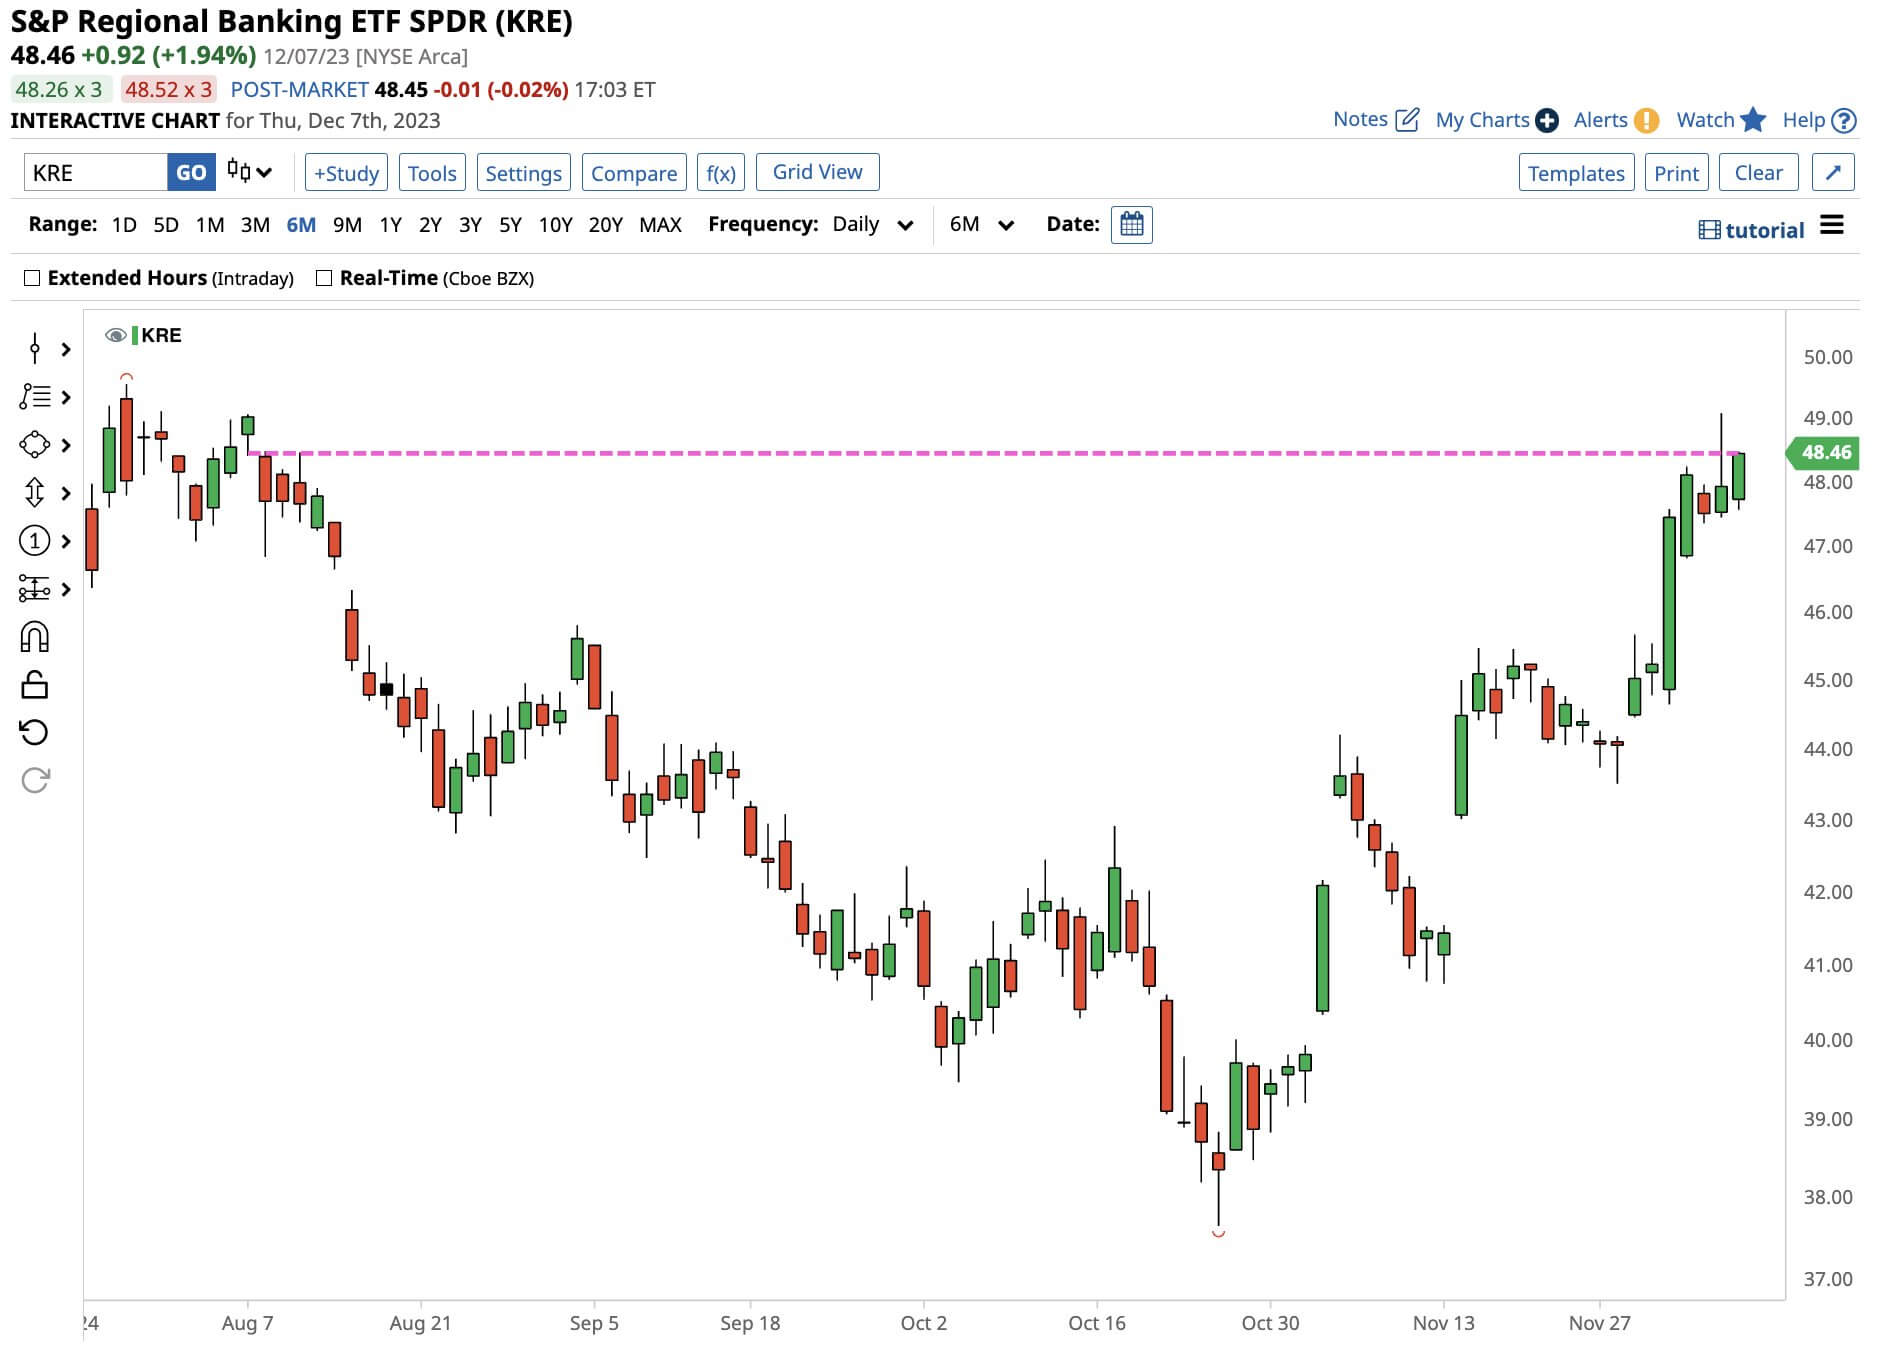
Given what happen in the US Commercial Real Estate, the higher negative unrealized bond losses, not many are reluctant to invest in small regional banks. This part of the market had their chance to break down, and markets tend to forward price distress or optimism so I am not sure what this recovery in regional banks shows. The market was probably priced in distress but that things are not so bad?
Tom Lee’s most interesting point is that we are only looking at the market problems that everyone talks about (the distress mentioned above) but how they balance out if the other part of the economy hums along to counterbalance weakness in some areas.
2023 turned out to be a year where if you don’t have the Magnificent 7, your performance will not be very well.
I have people coming to me and wondering how I should look at the Dimensional portfolios not doing as well as a market cap-weighted index for the past three years. My first question is whether three years is a “long” enough timeframe for you to evaluate your investment strategy, and secondly, it is not only the Dimensional portfolios not doing well.
If you review the equal-weighted S&P 500, they all look the same as the Russell 2000 or index in other broad regions.
How do you feel about a narrow leadership?
Situations like this remind me a little of the COVID-19 period when people started chasing what worked well when they based their decisions on what has gone up.
But what if a group of stocks just takes a different pace of going up?
You may be jumping from something… that may be going to have its turn of going up… into something that is consolidating. So what ends up is potentially missing out on performance.
I deeply suspect the chart above because my data work in the past made me conclude that there isn’t such a strong relationship between price-earnings and future 10-year returns. If you still believe valuation matters, then this chart gives you an idea about future performance possibilities.
The smaller U.S. stocks seem to be a little alive, exactly at a time that they should be dying. I thought this Tweet thread was interesting. Jason Goepfert tries to explain that many of us see a higher call option volume relative to recent history as something to remain more cautious about, but we may be misinterpreting the data.
Jason points out that while call option interest is higher than normal, the put option interest is also higher than normal. This means that we can make a point that a record number of people are interested in buying downside protection on the Russell 2000 index.
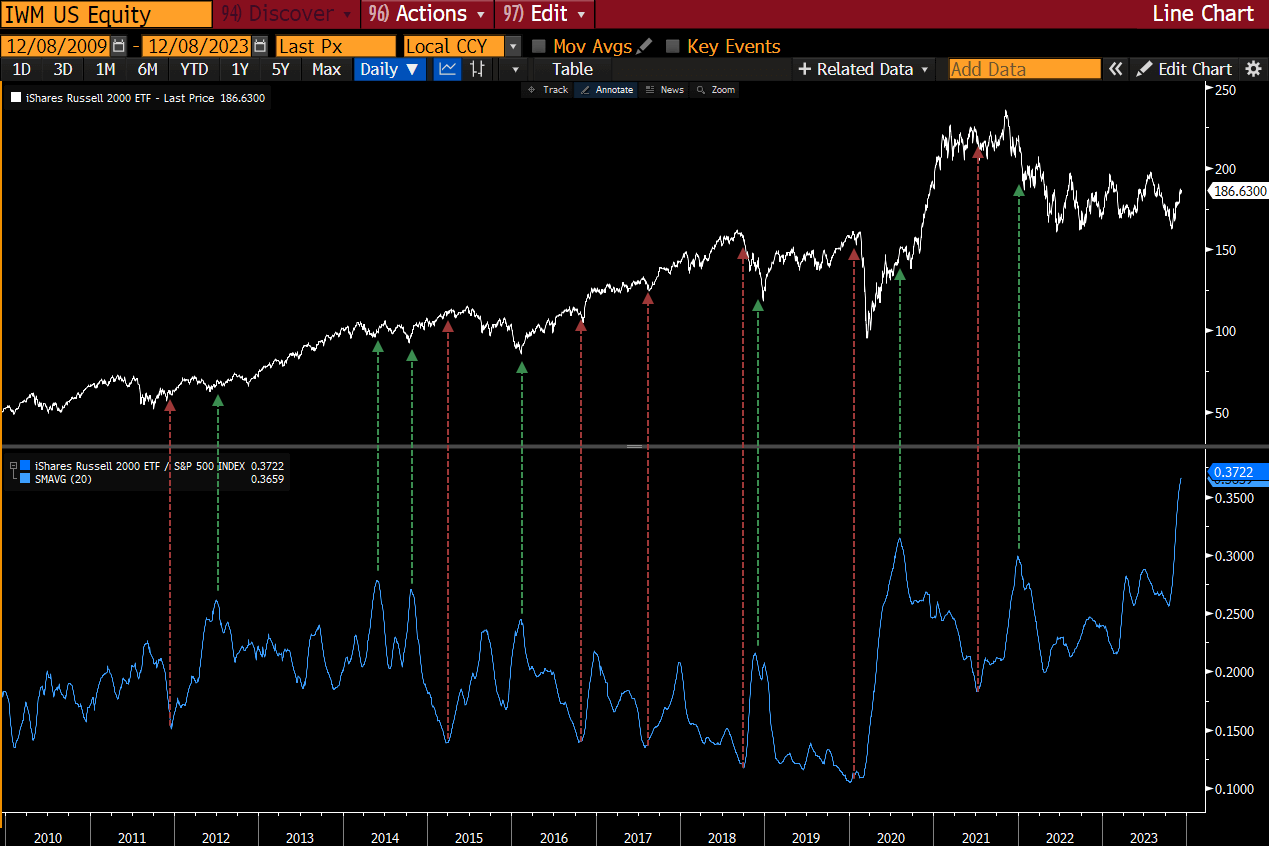
While we may be misinterpreting how we are looking at the call option open interest, an interesting point is that high levels of call option interest in the past (the green line denotes points of higher call option interest), typically preceded GAINS in the Russell 2000 ETF. Lower levels preceded LOSSES but less consistently.
This is just a poor signal.
Here is a counter-balance to that potential small-cap bullishness story.
The Short Bear links a few great charts correlating past rate changes with the S&P 500 movements.
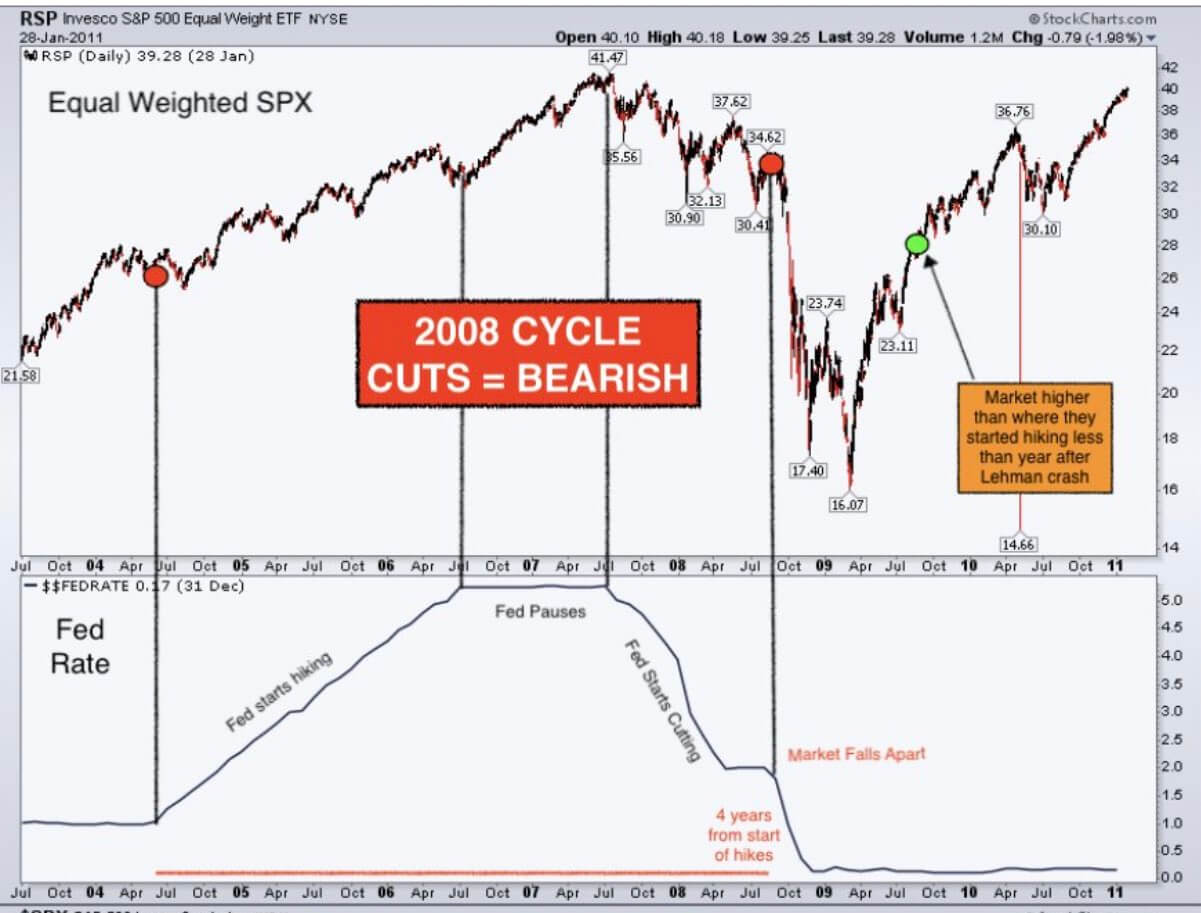
Still quite a climb before the rate cut and then it goes to shit.
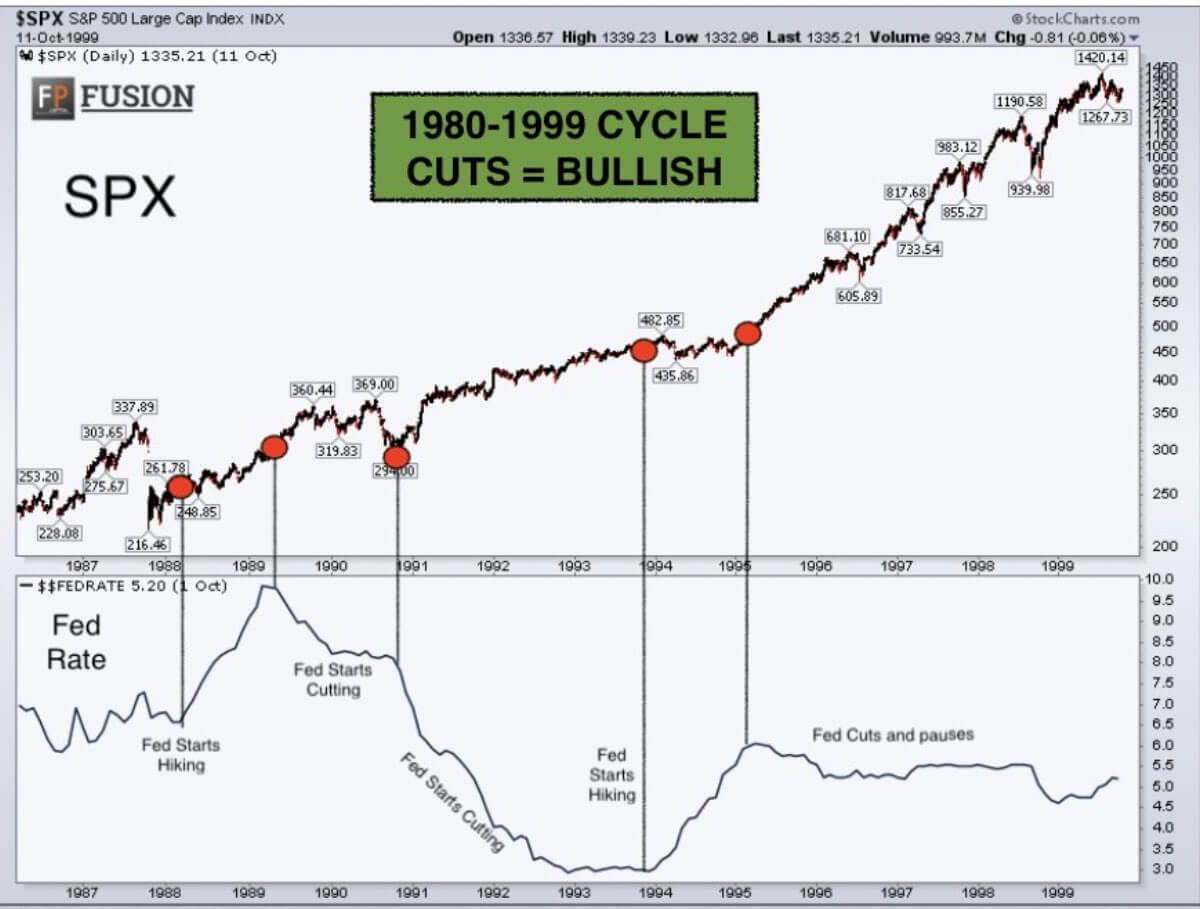
Things didn’t go to shit even in rate cuts.
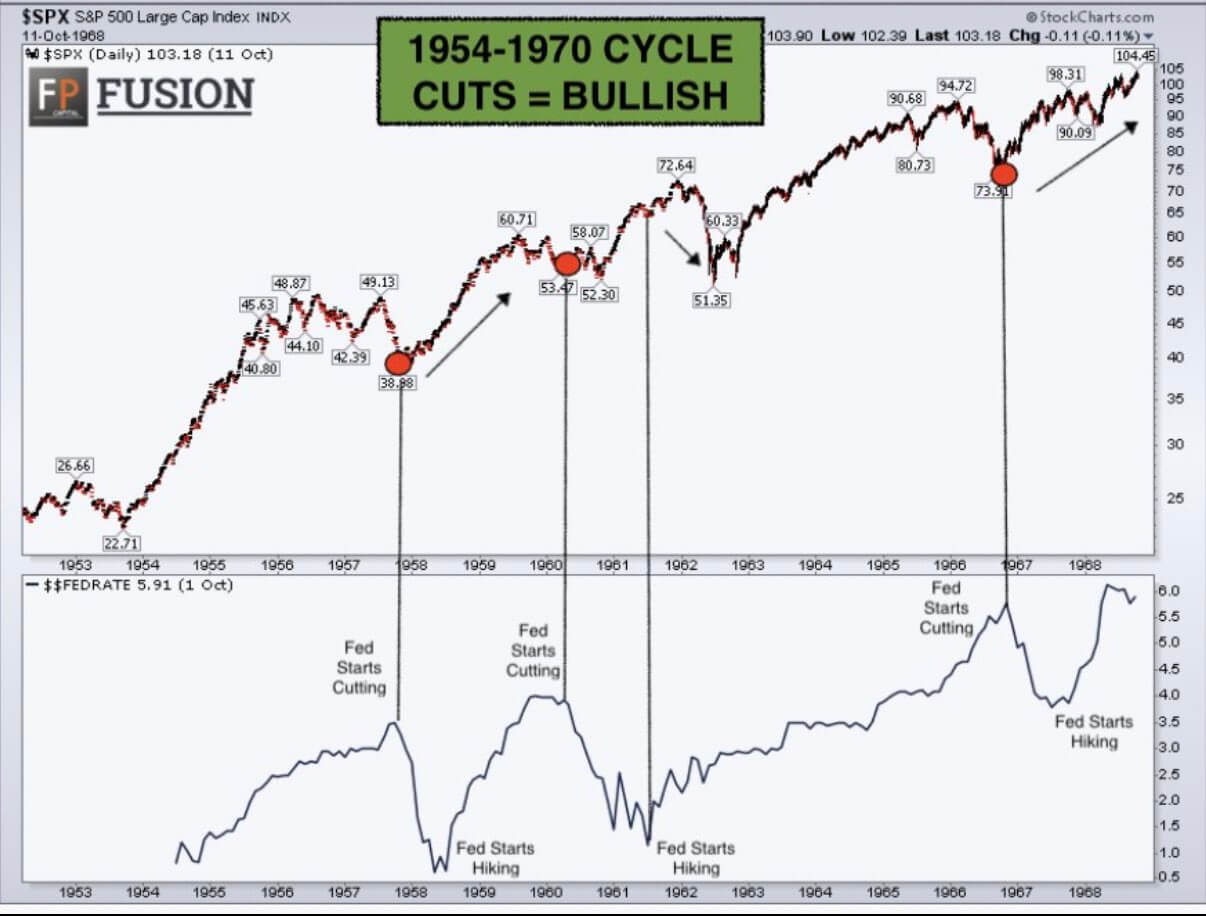
This as well.
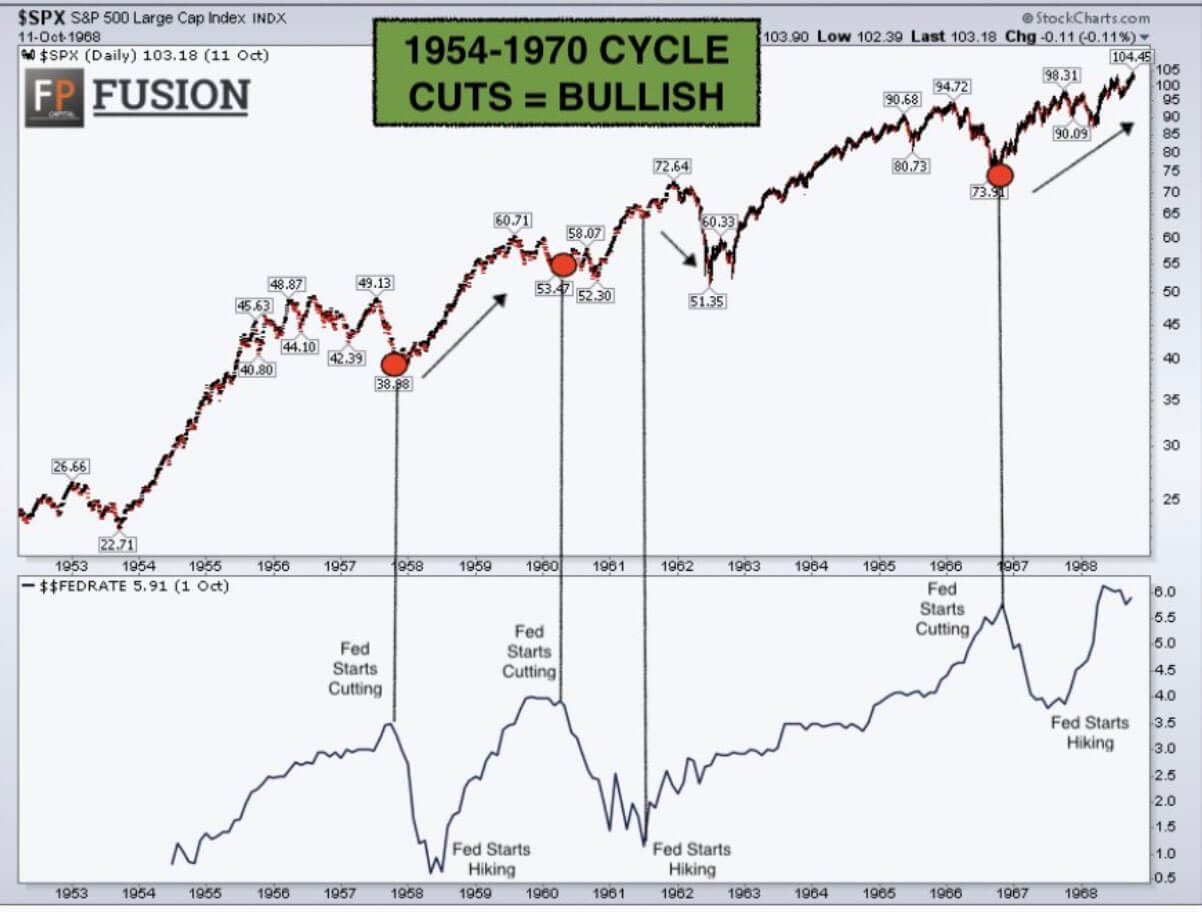
If we look at past history as warning signs then we have to also respect past history for telling us things might not always be bearish.
The key is whether there is a recession or not.
Everyone expects the year-end rally but most likely, the majority part of the rally is done and with a big amount of call options as explain in this Tweet, it is quite challenging for the market to move up further.
But the seasonal flows are very strong, and would prevent the markets from going down.
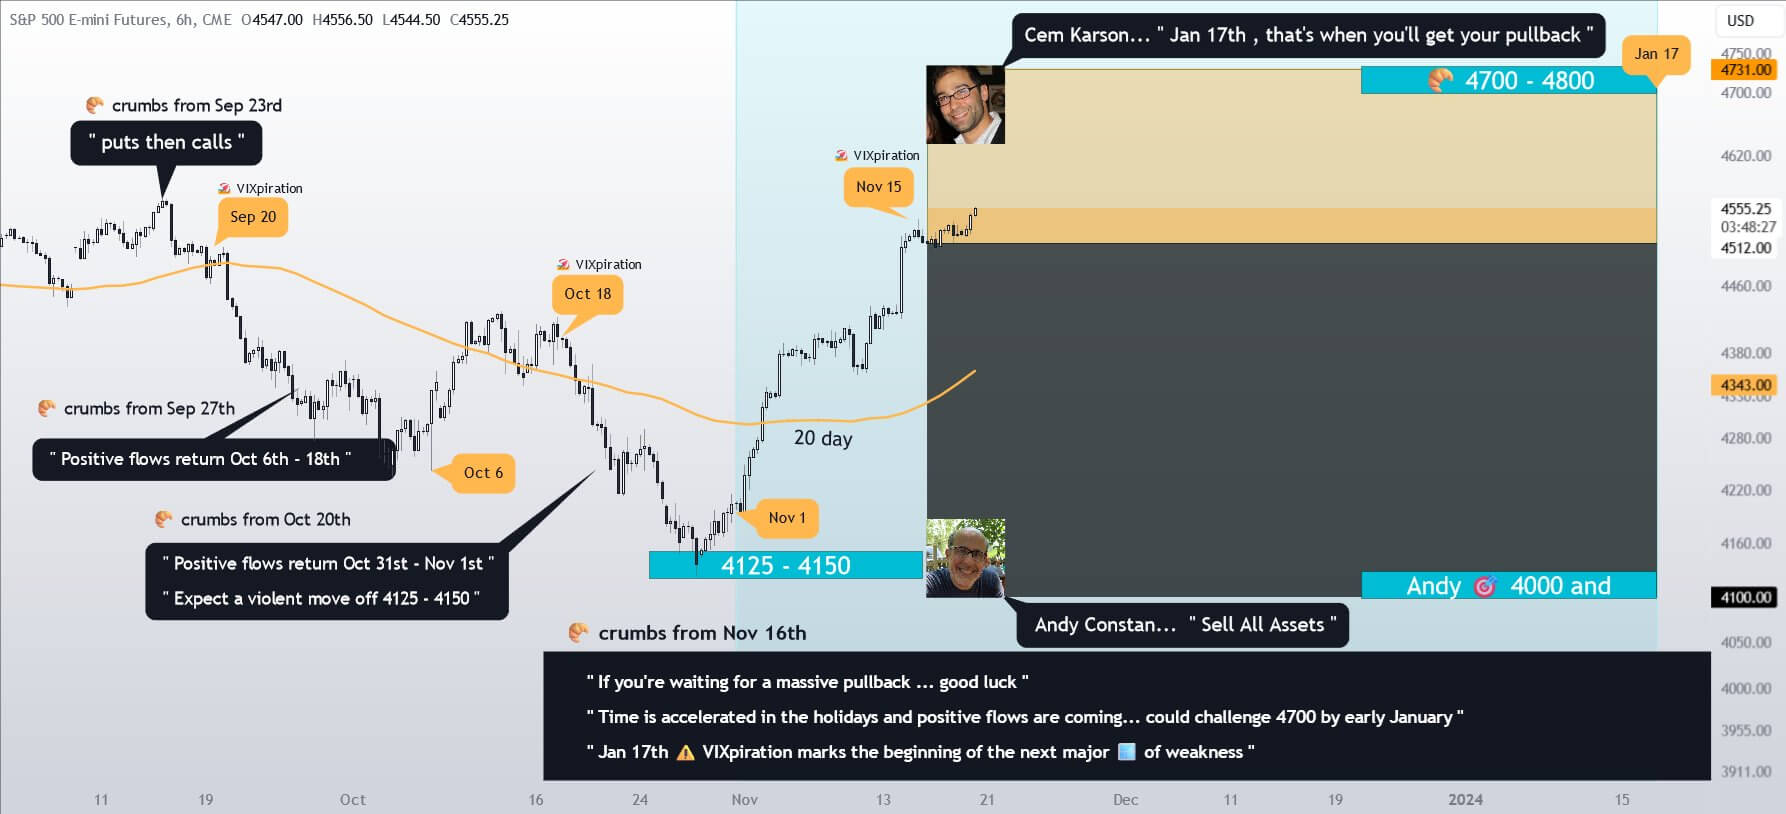
Cem Karson of Kai Volatility explains that the window of weakness is in January 17, which is where the strong positive support flows will end and if the market were to go down, that would be the point.
If you want to trade these stocks I mentioned, you can open an account with Interactive Brokers. Interactive Brokers is the leading low-cost and efficient broker I use and trust to invest & trade my holdings in Singapore, the United States, London Stock Exchange and Hong Kong Stock Exchange. They allow you to trade stocks, ETFs, options, futures, forex, bonds and funds worldwide from a single integrated account.
You can read more about my thoughts about Interactive Brokers in this Interactive Brokers Deep Dive Series, starting with how to create & fund your Interactive Brokers account easily.
Kyith is the Owner and Sole Writer behind Investment Moats. Readers tune in to Investment Moats to learn and build stronger, firmer wealth foundations, how to have a Passive investment strategy, know more about investing in REITs and the nuts and bolts of Active Investing.
Readers also follow Kyith to learn how to plan well for Financial Security and Financial Independence.
Kyith worked as an IT operations engineer from 2004 to 2019. Currently, he works as a Senior Solutions Specialist in Insurance Start-up Havend. All opinions on Investment Moats are his own and does not represent the views of Providend.
You can view Kyith's current portfolio here, which uses his Free Google Stock Portfolio Tracker.
His investment broker of choice is Interactive Brokers, which allows him to invest in securities from different exchanges all over the world, at very low commission rates, without custodian fees, near spot currency rates.
You can read more about Kyith here.
- My Dividend Experience Investing in UCITS iShares iBond Maturing in 2028. - April 23, 2024
- We Invest into Popular Funds When They Are Popular, Exactly When They Started Turning to Shxt. - April 22, 2024
- Meal Prep 2.0 – Cooking Your “Go-to” Meal that You Look Forward to Eating Everyday. - April 21, 2024