We did an exercise recently on Noble Group to see how dividends, splits, rights and bonus shares affect certain stocks. By popular demand, I decide to profile one of Singapore biggest conglomerate Keppel Corp.
You can view all the factsheets on my Google Spreadsheet here [SGX Singapore Stocks Factsheet >>]
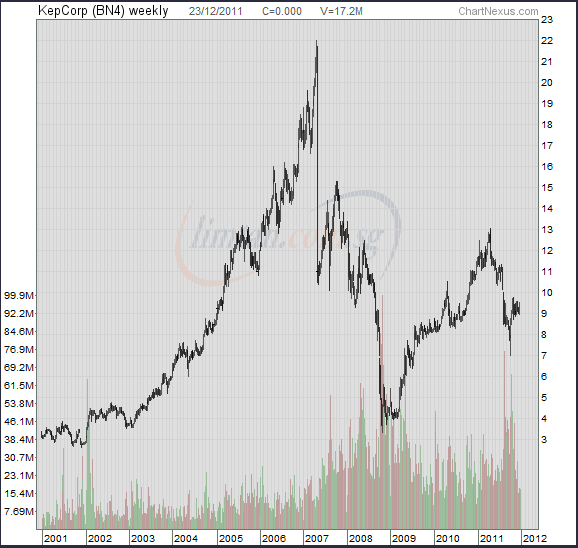
Keppel Corp Price 11 Years
Keppel Corp have been the favorite stocks for a lot of rich people or people aspiring to be rich. It is one of the more prominent stocks that people that do not look at the stock market everyday would come across.
Business wise, it is pretty diversified across ship building, repair and rig building, properties and oil and gas infrastructure. All of which is what have been driving the Singapore economy and what have been in demand for the past 10 years.
It is no surprise that the price movement of this blue chip stocks mirrors the general movement of the STI.
Speculators have been handsomely rewarded had you picked this up during the recession in 2001-2003 or 2009.
The most significant drop in 2007 was the result of a 2 for 1 stock split and factoring that, the low of 2009 should have been $8 instead of $4.
Keppel Corp’s uneven cash distributions

(Click to view larger image)
Had you held Keppel since 2001 you would have done pretty well despite going through 2 bull runs and a bear run.
Purchasing at a low of $3.26 would have yielded you an unrealized gain of 534.36% and total dividends of 202.73%.Annualized unrealized gain is 18% and dividend collected is 10%.
Not as spectacular as Noble’s 11 year price movement, but nevertheless I wouldn’t be sad about this investment at all. It has a good yield and capital growth.
One thing you would notice is that the distribution from Keppel can be very uneven. As a lot of their Rig building and property related business is very lumpy in profits, their dividend distribution ends up being lumpy.
This is why a lot of dividend hungry folks like me don’t go for stocks like this. However, as stated in the Noble’s article, what matters is the earnings growth and Keppel was powered by 2 very strong trends taking place from 2001-2011: Property and Oil & Gas. The return turned out to be much better than any REITs or dividend stocks that pays predictable returns.
| Year | 2001 | 2002 | 2003 | 2004 | 2005 | 2006 | 2007 | 2008 | 2009 | 2010 | 2011 |
| Profit | $565 | $240 | $300 | $380 | $410 | $480 | $460 | $1380 | $720 | $780 | $894 |
| YOC | 17% | 7.3% | 9.2% | 11.6% | 12.5% | 14.7% | 14.1% | 42% | 22% | 23.9% | 27% |
If we tabulate the annual returns, there are only 2 lumpy periods (2001 and 2008). Else Keppel have been steadily raising their dividends every year. Your yield on cost have been climbing at a rate of roughly 6% per year.
What if you overbought it?
Now everyone would say that this is only a good investment if you bought it in deep recession. I think everyone would have been afraid now to hold a stock if they did not bought at the “right” price.
Ultimately what made Keppel a good company to me was this
- Management rode the trend on 2 major trends
- Their profits despite what the stock market did, continue to grow
- The management is shareholder friendly in that they return increasing payouts at a sensible level to investors
Price is what you pay for value is what you get. If you pay the equivalent of $18 (there was a split in 2007) which is about todays price of $9, your returns in 11 years would still be 51%. The majority of the returns (36%) coming from dividends.
Make a copy of my spreadsheet and try this: change the original purchase price and see how much you would have to overpay in order for you to lose money in 11 years.
I did that, and turns out you need to buy Keppel Corp at $27 in order for you to start losing money.
Conclusion
I guess for me this exercise shows a few things
- Your portfolio will benefit immensely by holding 1 to 2 stocks that benefit from future growth.
- Do not always worry that dividends are lumpy. Worry more about future free cash flow projections based on cash flow growth. Estimate or project the likely dividend returns for the next 10 years.
- Certain stocks are share holder friendly. The dividend return acts as protection against future management or business incompetence.
I run a free Singapore Dividend Stock Tracker . It contains Singapore’s top dividend stocks both blue chip and high yield stock that are great for high yield investing. Do follow my Dividend Stock Tracker which is updated nightly here.
Kyith is the Owner and Sole Writer behind Investment Moats. Readers tune in to Investment Moats to learn and build stronger, firmer wealth foundations, how to have a Passive investment strategy, know more about investing in REITs and the nuts and bolts of Active Investing.
Readers also follow Kyith to learn how to plan well for Financial Security and Financial Independence.
Kyith worked as an IT operations engineer from 2004 to 2019. Currently, he works as a Senior Solutions Specialist in Insurance Start-up Havend. All opinions on Investment Moats are his own and does not represent the views of Providend.
You can view Kyith's current portfolio here, which uses his Free Google Stock Portfolio Tracker.
His investment broker of choice is Interactive Brokers, which allows him to invest in securities from different exchanges all over the world, at very low commission rates, without custodian fees, near spot currency rates.
You can read more about Kyith here.
- My Dividend Experience Investing in UCITS iShares iBond Maturing in 2028. - April 23, 2024
- We Invest into Popular Funds When They Are Popular, Exactly When They Started Turning to Shxt. - April 22, 2024
- Meal Prep 2.0 – Cooking Your “Go-to” Meal that You Look Forward to Eating Everyday. - April 21, 2024
Ariani
Saturday 21st of September 2019
Hi Kyith,
I noticed that its price looks attractive. In terms of revenue in 2018, Infrastructure contributed the most at 45%, followed by Offshore & Marine at 31%, Property at 22%, while Investments clocked in at a mere 2%. However property contributed almost 100% of the entire company’s profits at S$938m. Do you think there is potential upside to Infrastructure, and Offshore/Marine industry in the med/long term? What do you think of Keppel ?
Nagappan
Tuesday 15th of May 2012
I am a Malaysian investor and I have just taken an interest in a few blue chip SES stocks. I was impressed by Keppel's performance until I noted that the 2011 operating cash flow is deeply in negative territory. The balance sheet shows that the accounts payable is 3x as much as the accounts receivable. The profits shown for 2011 is not commensurate with the operating cash flow. Keppel must have borrowed heavily to pay dividends. Has it got a cash-flow problem? Nagappan.
Drizzt
Monday 21st of May 2012
hi Nagappan, thanks for visiting. the thing about keppel is that congromerates like them have so many subsidiary that makes it difficult to analyze. i tried but i just couldn't figure it out. its worst because those accounts payable may be an aggregate with their subsidiary.
if you look at its cash flow its always negative, yet it was able to pay increasing dividends. debt is in a good position. i am worried as you but certain investments, i get invested with enough knowledge of historical operation and just try to understand them.
the more red flags i see, if i think it gets bad like NOL i will get out.
VG
Sunday 11th of March 2012
Hi Driztt:
First, really appreciated your work! I think you enjoy all the analysis and calculation!
I studied your noble and keppel blog, I am quite confused on your Excel spreadsheet. For example, your 2011-04-26, you indicated a "Buy" of 200 share, but the transaction cost is zero? Could you please advise?
Any, is it possible to have your excel spreadsheet (with formula)? Thinking to do a check as well as similar study for other stock.
We can discuss more on other stock here :)
VG