What are Rolling Returns?
I will describe rolling returns this way.
Imagine you have $1 million, and this amount is almost 95% of your net wealth. You are near the end of your wealth accumulation period. Your income from work in the future, compare to your net wealth going forward, is going to be insignificant.
If you want to deploy such a large portion of your net wealth, you need a certain degree of certainty that your investment will work out.
Now… knowing the average return is SHIT or USELESS.
This is because we almost never earn the average return in reality. You either earn above the average or below the average returns for a known segment.
If so, you may wonder: So what is the spectrum of return if my investment time horizon is 10-years, 15-years, or 20-years?
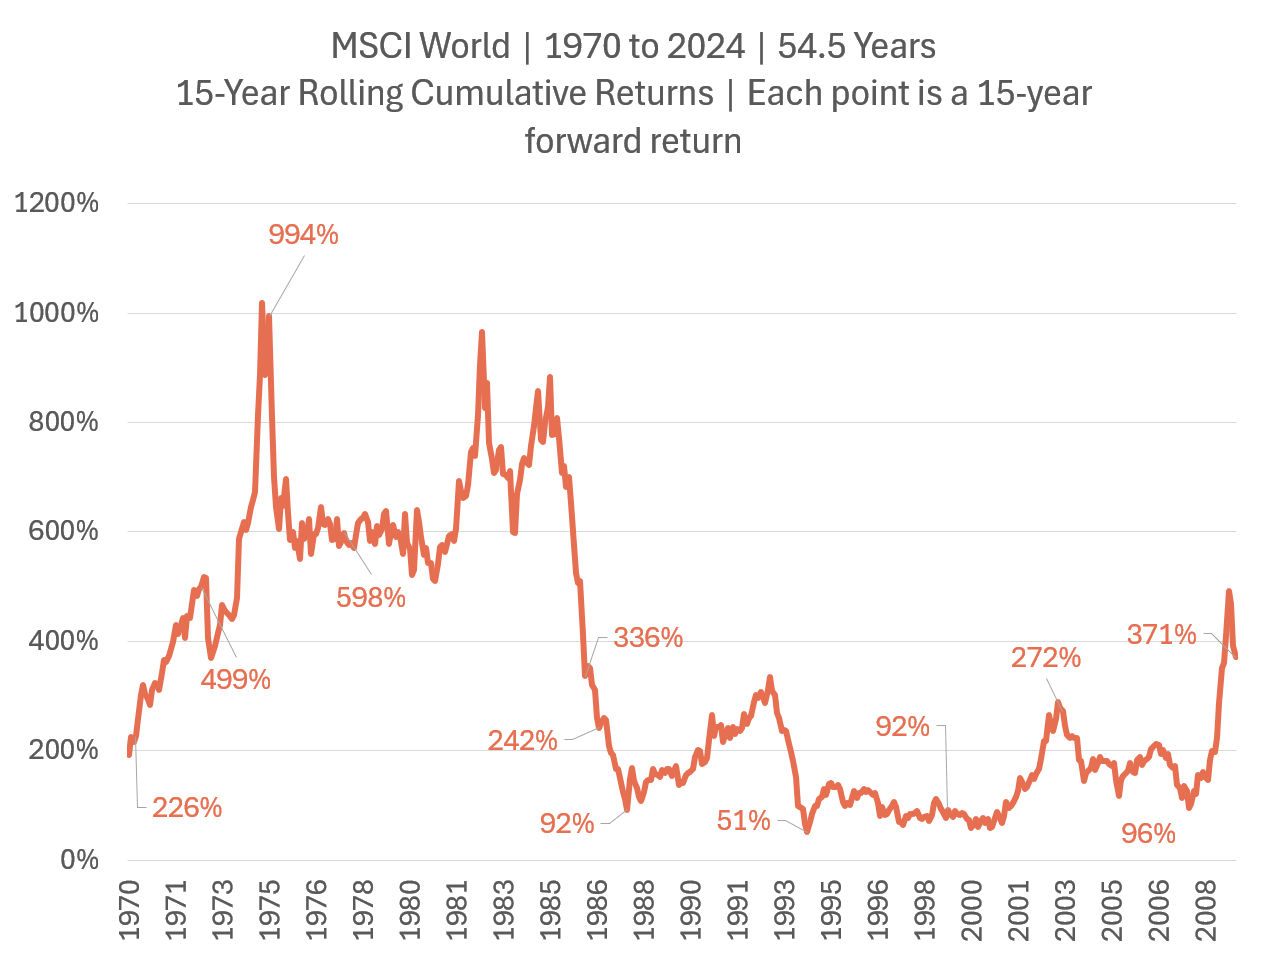
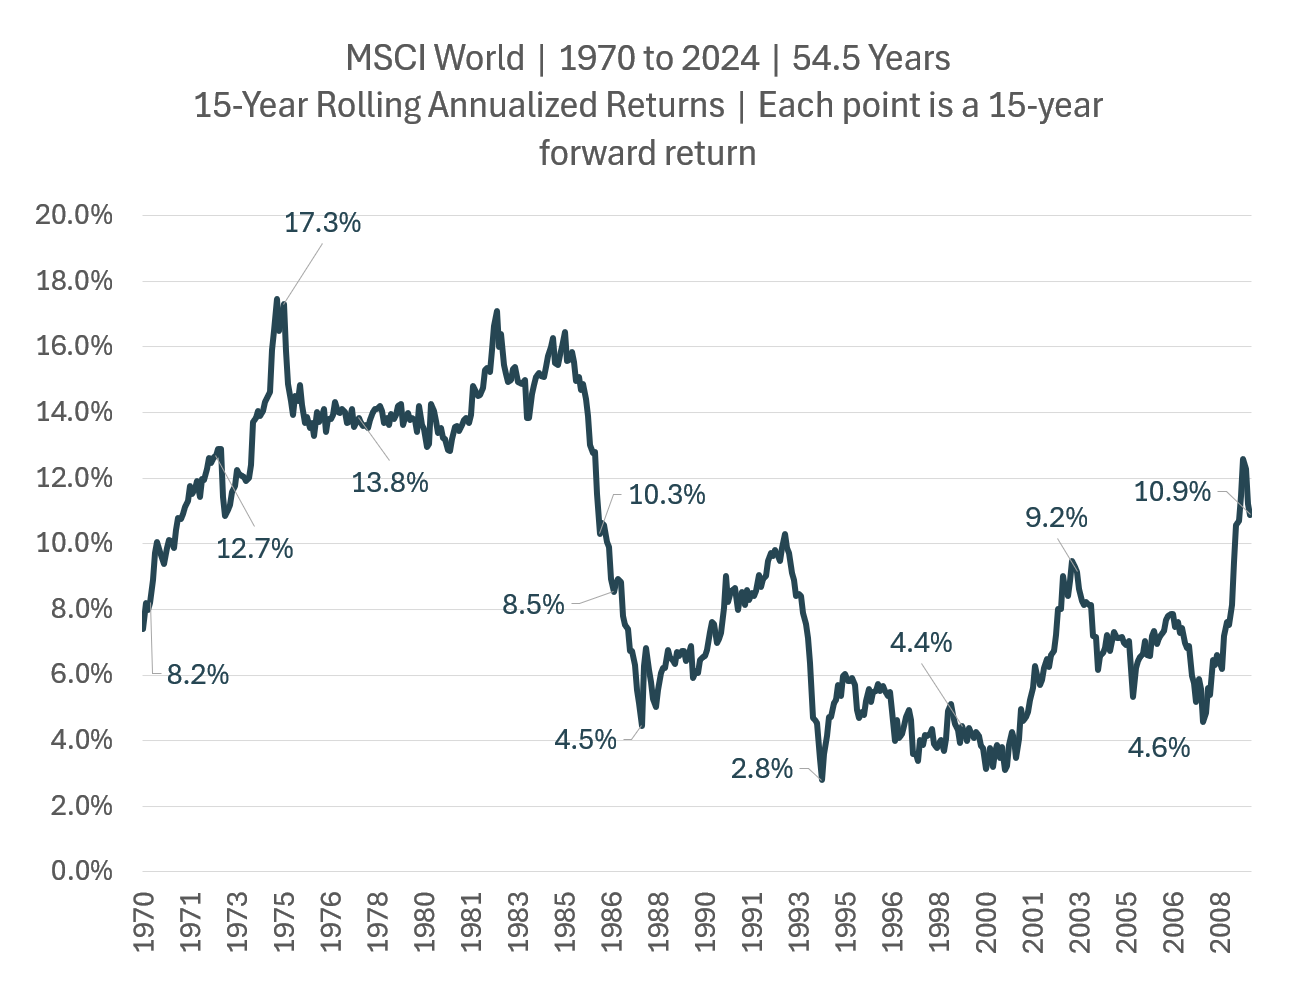
Imagine that your returns if you invest for 10-years, 15-years, 20-years today will be similar to a 10-year, 15-year, 20-year period in the past. The history of financial returns will show you multiple 10-year, 15-year, 20-year periods.
This is what rolling returns is.
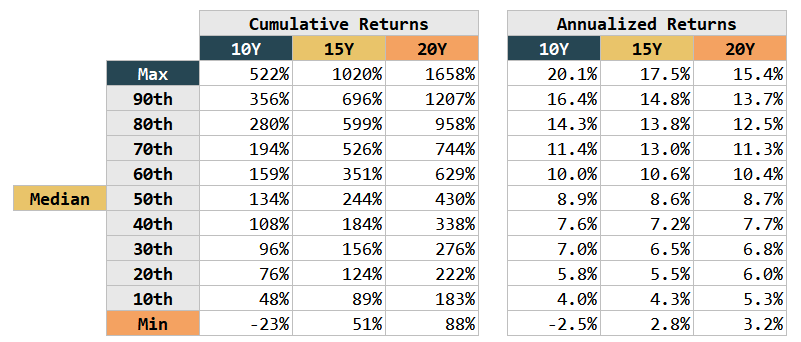
For example, in the first data MSCI World, from 1970 to 2024 there are 534 unique 10-year periods, 474 unique 15-year periods, 414 unique 20-year periods in the past 54.5 years.
You will be able to see if you are very lucky, or very unlucky, how would your long term returns be.
Why do I Mainly Present 10-year, 15-year and 20-year Rolling Returns?
Most of this data is for long term wealth accumulators or decumulators. So we want to show the kind of returns if we hold a strategic (read long-term) investment strategy and buy-and-hold a particular index.
Do You Consider Dividends in These Returns Data?
Yes.
The financial data are what we call Total Returns, which are made up of Capital Appreciation and Dividends, which are reinvested unless otherwise stated.
Why are Some of the 10-year, 15-year and 20-year Returns for Some Indexes So Low Despite Us Holding it For So Long?
This is why I say average returns are quite useless.
When people say “if you invest long enough, the average returns should narrow to a very tight range.” That “long enough” is likely closer to 400-years than 20-years, which means your 10, 15, 20 year experience will still be one pick, from many X-years.
What is common in many indexes below is that there will be lucky investors that invest in market conditions is great and unlucky investors who invest when market periods is not great.
There is uncertainty of whether you will put in all your net wealth, and end up being unlucky that is a risk to your financial planning. However, it is this uncertainty that fundamentally gives the possibility of having that great 12% a year return over 20 years when you invest in that index.
Without taking on that risk, it may be challenging to get that return.
Summary of Data Present Below
- MSCI World
- Bloomberg Global Aggregate Bond Index
- Dimensional US Small Cap Value index
MSCI World Long-Term Returns (54.5 Years of Data)
Asset Class: Equity
Region: Global Developed.
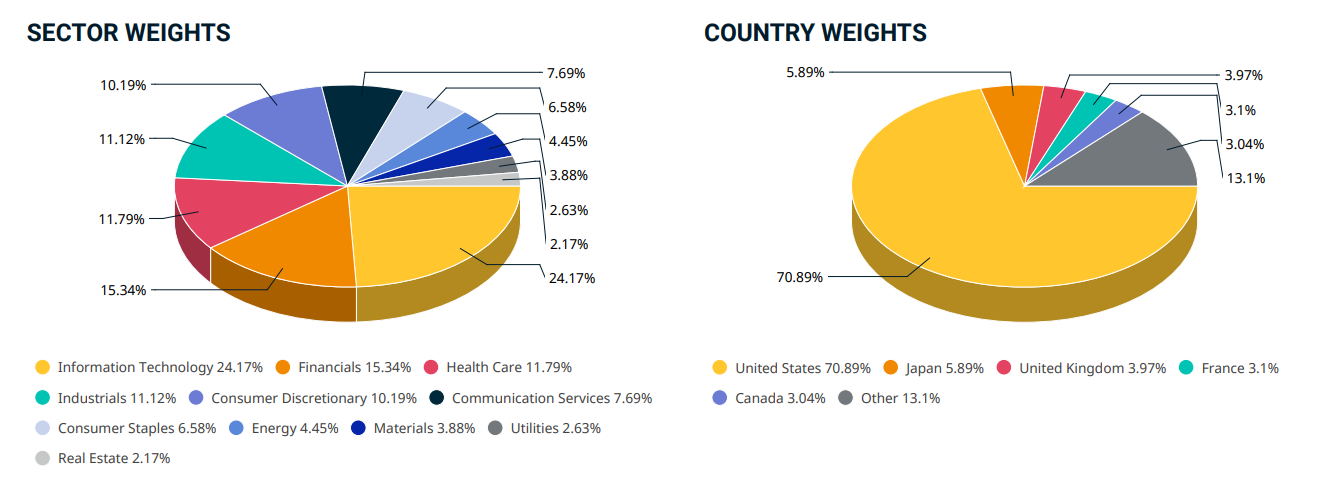
Strategy: Systematic Passive
The Ideal Timeframe to Break Even: Between 10 and 15 years.
The Ideal Timeframe to Capture Returns: 20 years.
Investable ETF (Irish Domiciled | Ticker): SWDA | SWRD | Available at Interactive Brokers
Unit Trust Implementation: Amundi Index MSCI World Fund | Available at Endowus


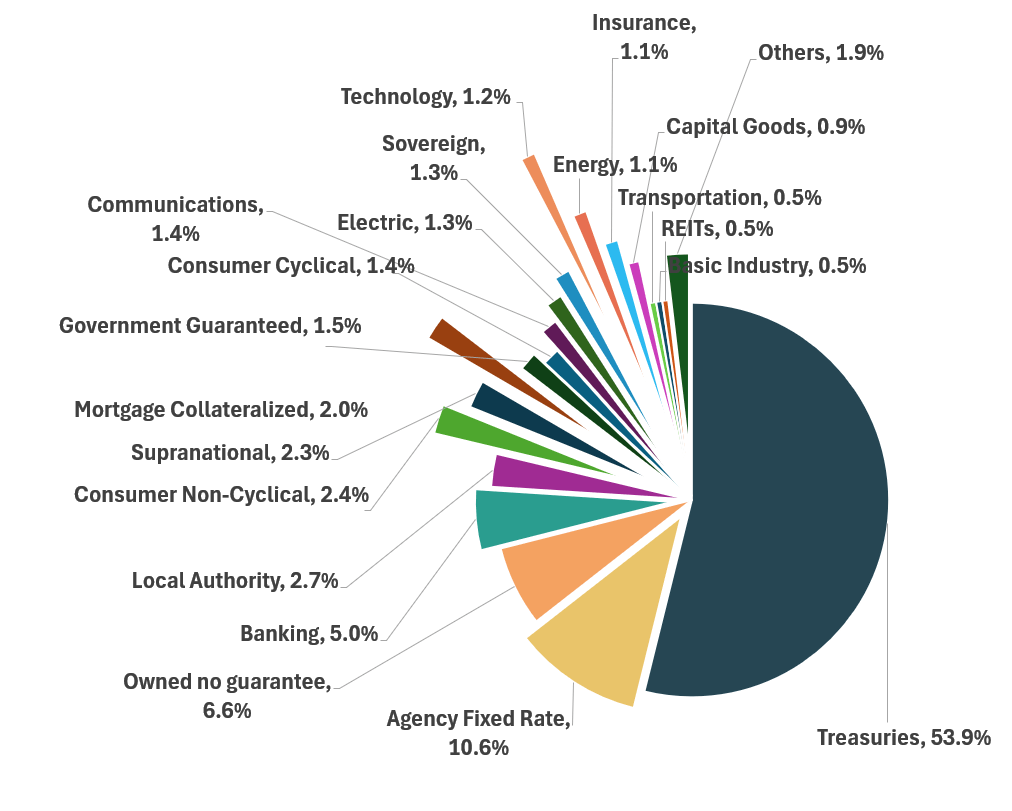
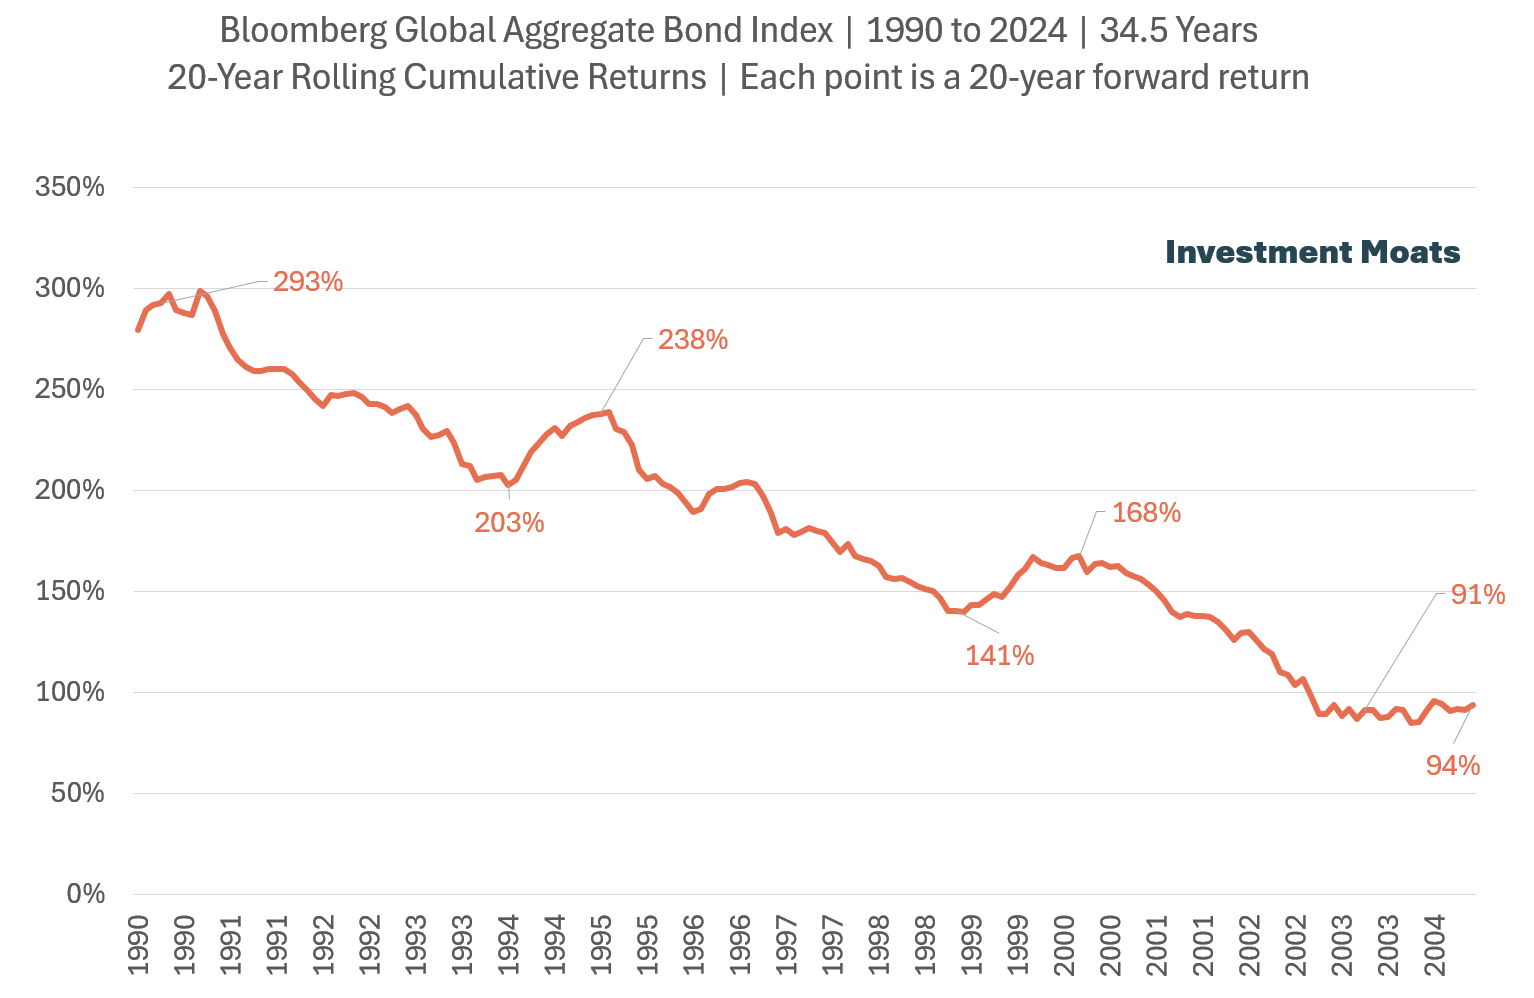
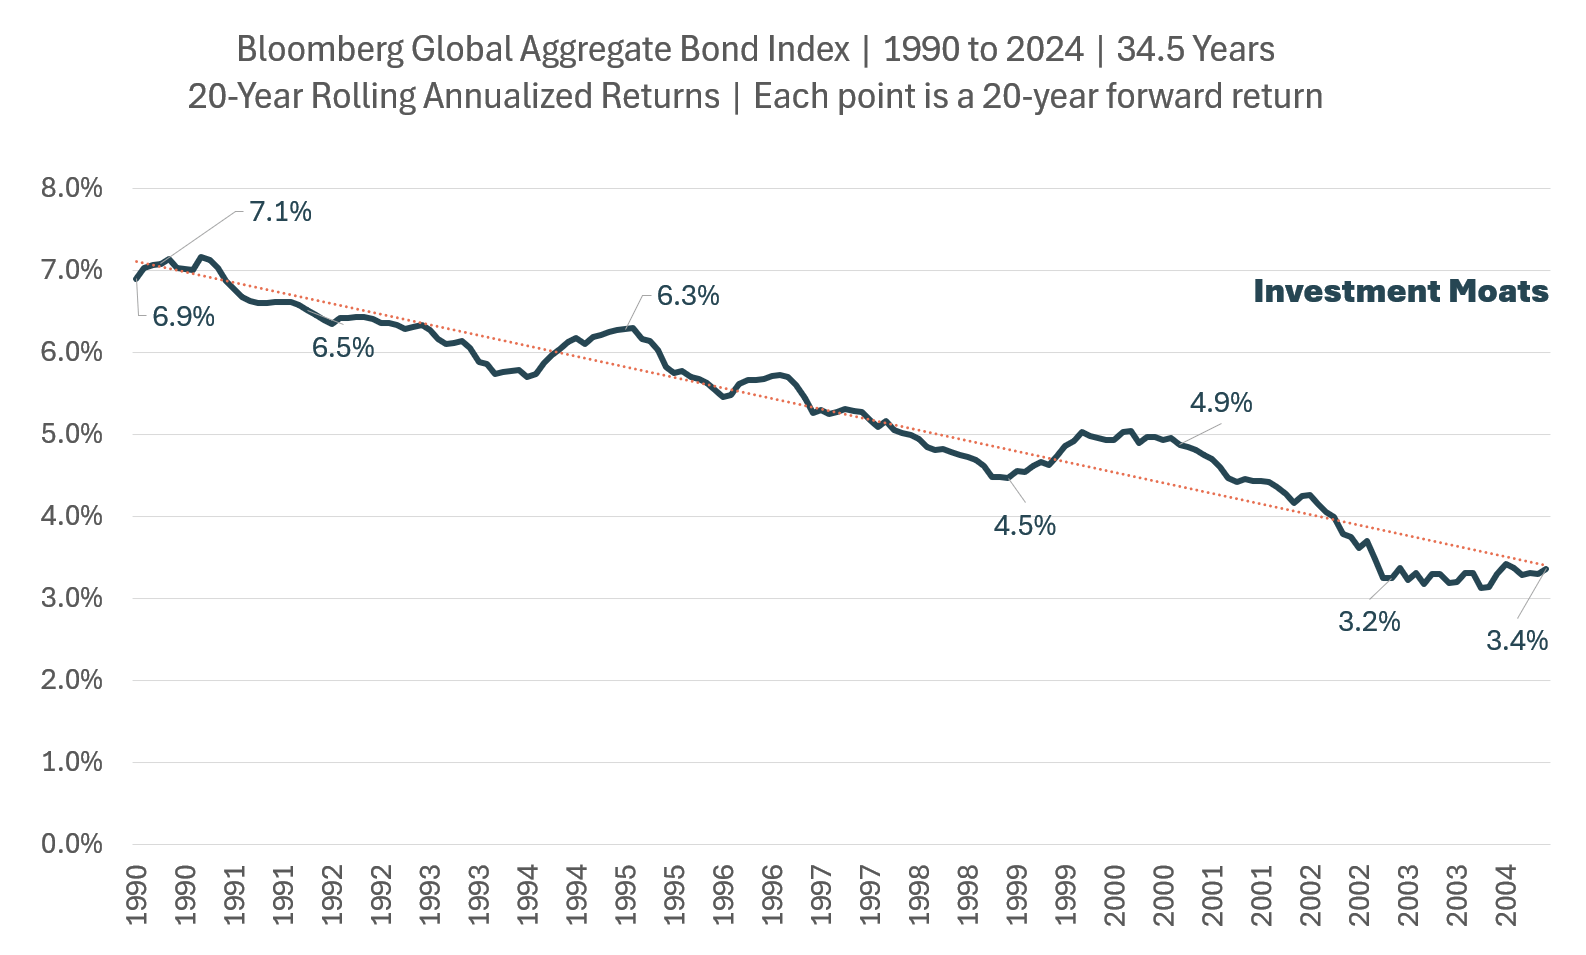
Bloomberg Global Aggregate Bond Index Returns (34.5 Years of Data)
Asset Class: Fixed Income
Region: Global.

Strategy: Systematic Passive
Number of Holdings: 15,222
Sector:
- Treasury
- Government Related
- Corporate
- Securitized (MBS, ABS, CMBS, and Covered)
Credit Rating: Investment Grade (Baa3/BBB-/BBB- or higher) using the middle rating of Moody’s, S&P and Fitch

Coupon: Fixed-rate coupon (including zero coupon), callable fixed-to-floating rate bonds are eligible during their fixed-rate term only. Bonds with a step-up coupon that changes according to a predetermined schedule are eligible.
Weighted Average Coupon: 2.6% (as of Jun 2024)
Weighted Average Yield-to-Maturity: 3.85% (as of Jun 2024)
Weighted Average Maturity: 8.4 years (as of Jun 2024)
Effective Duration: 6.5 years (as of Jun 2024)
Maturity:
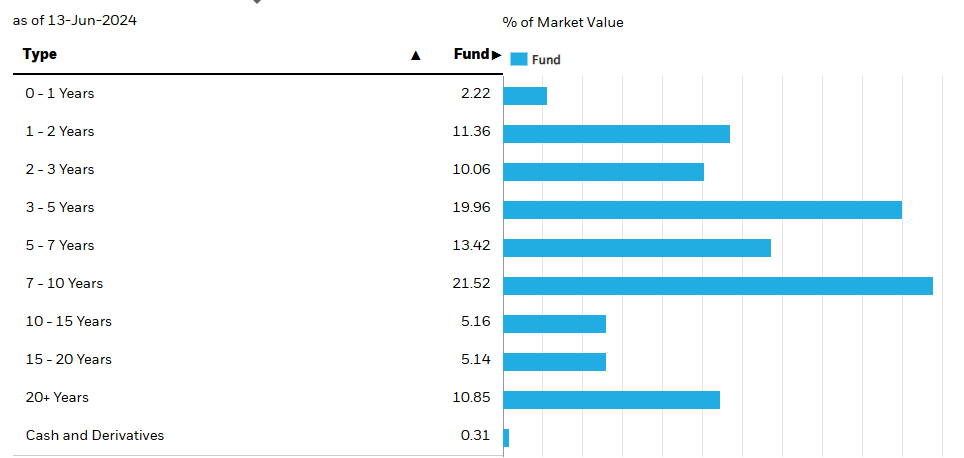
The Ideal Timeframe to Break Even: 6.5 years.
The Ideal Timeframe to Capture Returns: 7 to 8 years.
Investable ETF (Irish Domiciled | Ticker): AGGU | Available at Interactive Brokers
Unit Trust Implementation: Amundi Index Global Aggregate Bond Fund | Available at Endowus
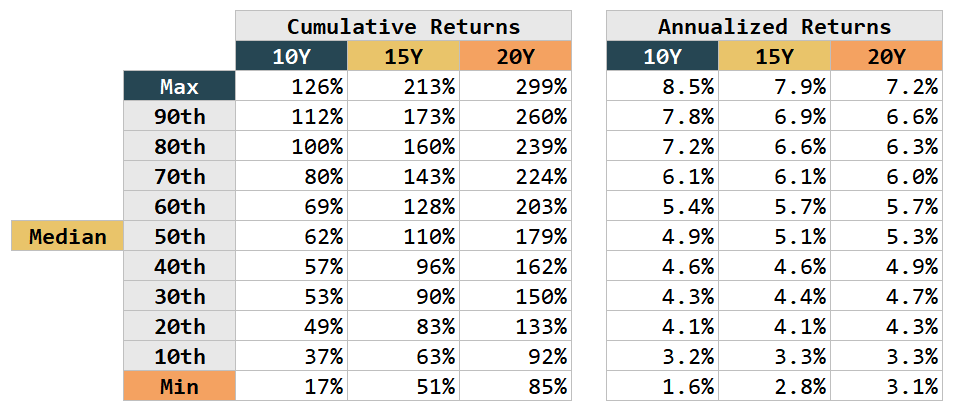


I am adding the following 6.5-year rolling cumulative and annualized returns chart.
Why so special?
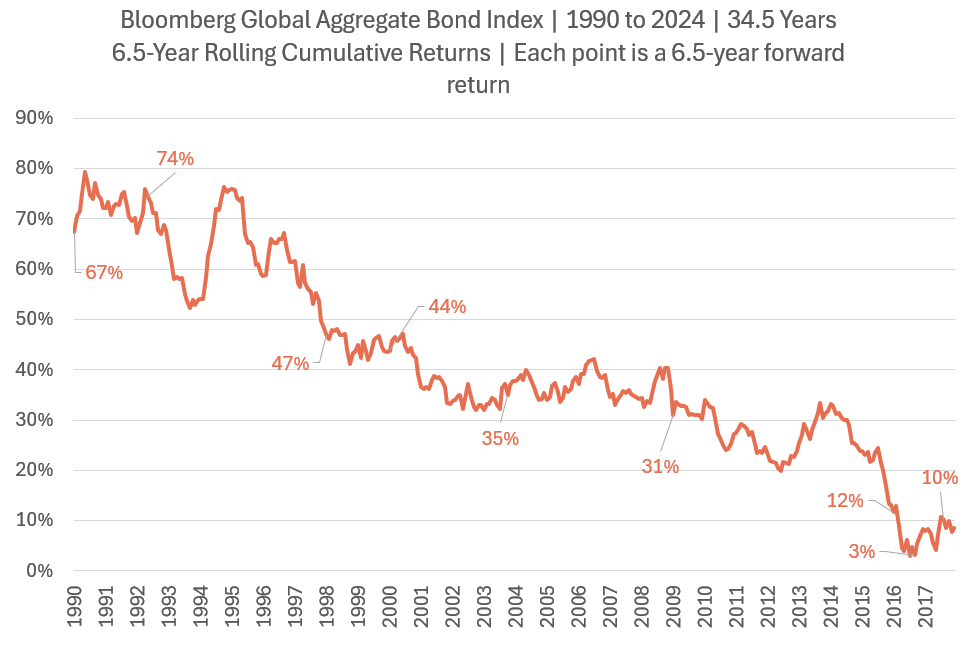
The effective duration of the Bloomberg Global Aggregate Bond Index is about 6.5 years. I want to observe if we respect this effect duration and invest only when our time horizon for our financial goal is longer than 6.5 years will we lose money.
From the chart, even the lowest return is positive. This includes the 2022 very challenging bond market. This more or less show that if you respect the duration, you should do okay to breakeven.
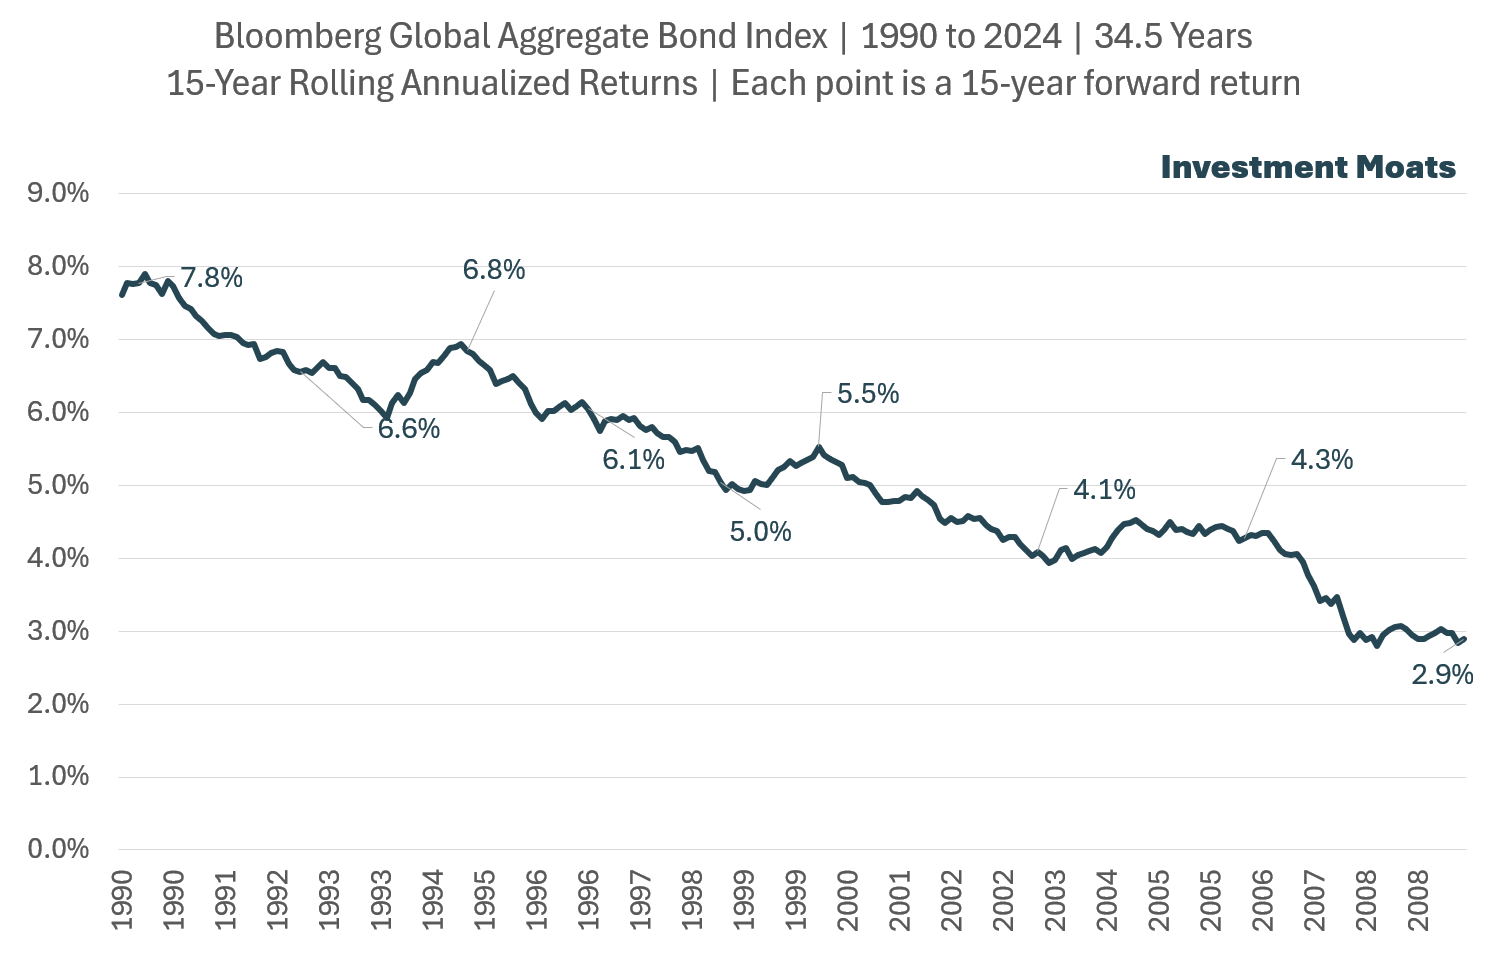
I included an annualized return chart:
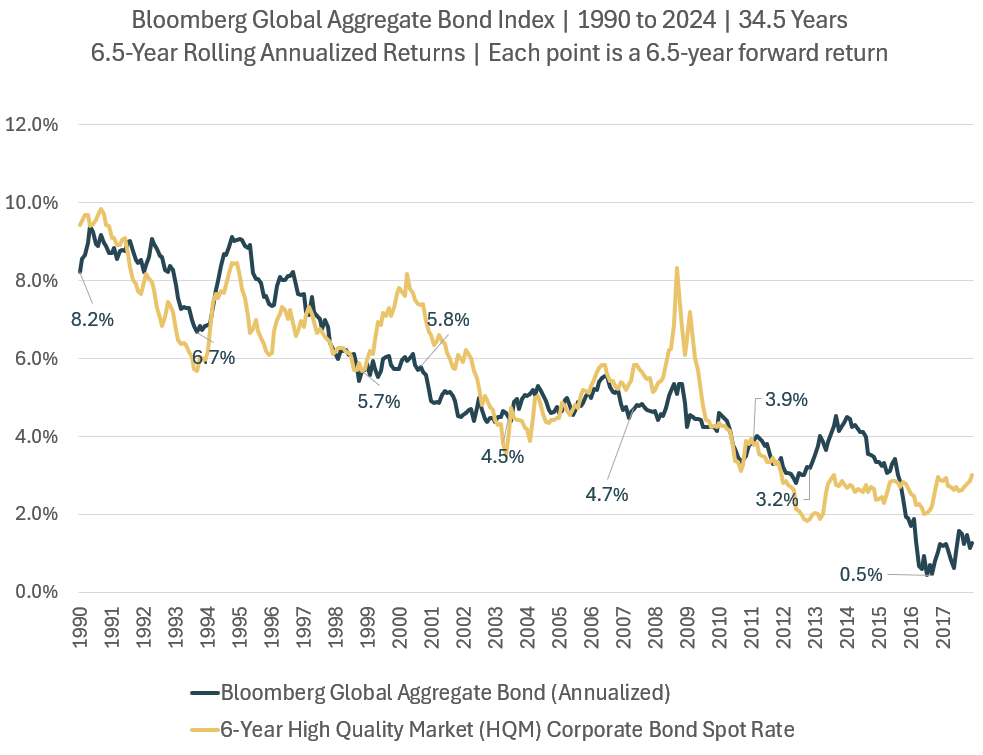
The unique thing is when we plot the spot yield of a 6-year high quality market corporate bond (FRED data) against the Global Aggregate Bond index, we can see the relationship of forward future return and the current yield-to-maturity.
As the yield-to-maturity declines, so are the forward returns.
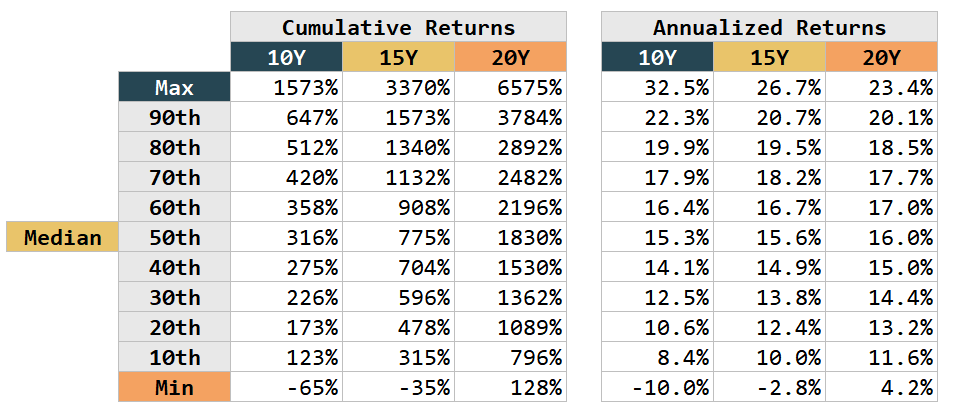
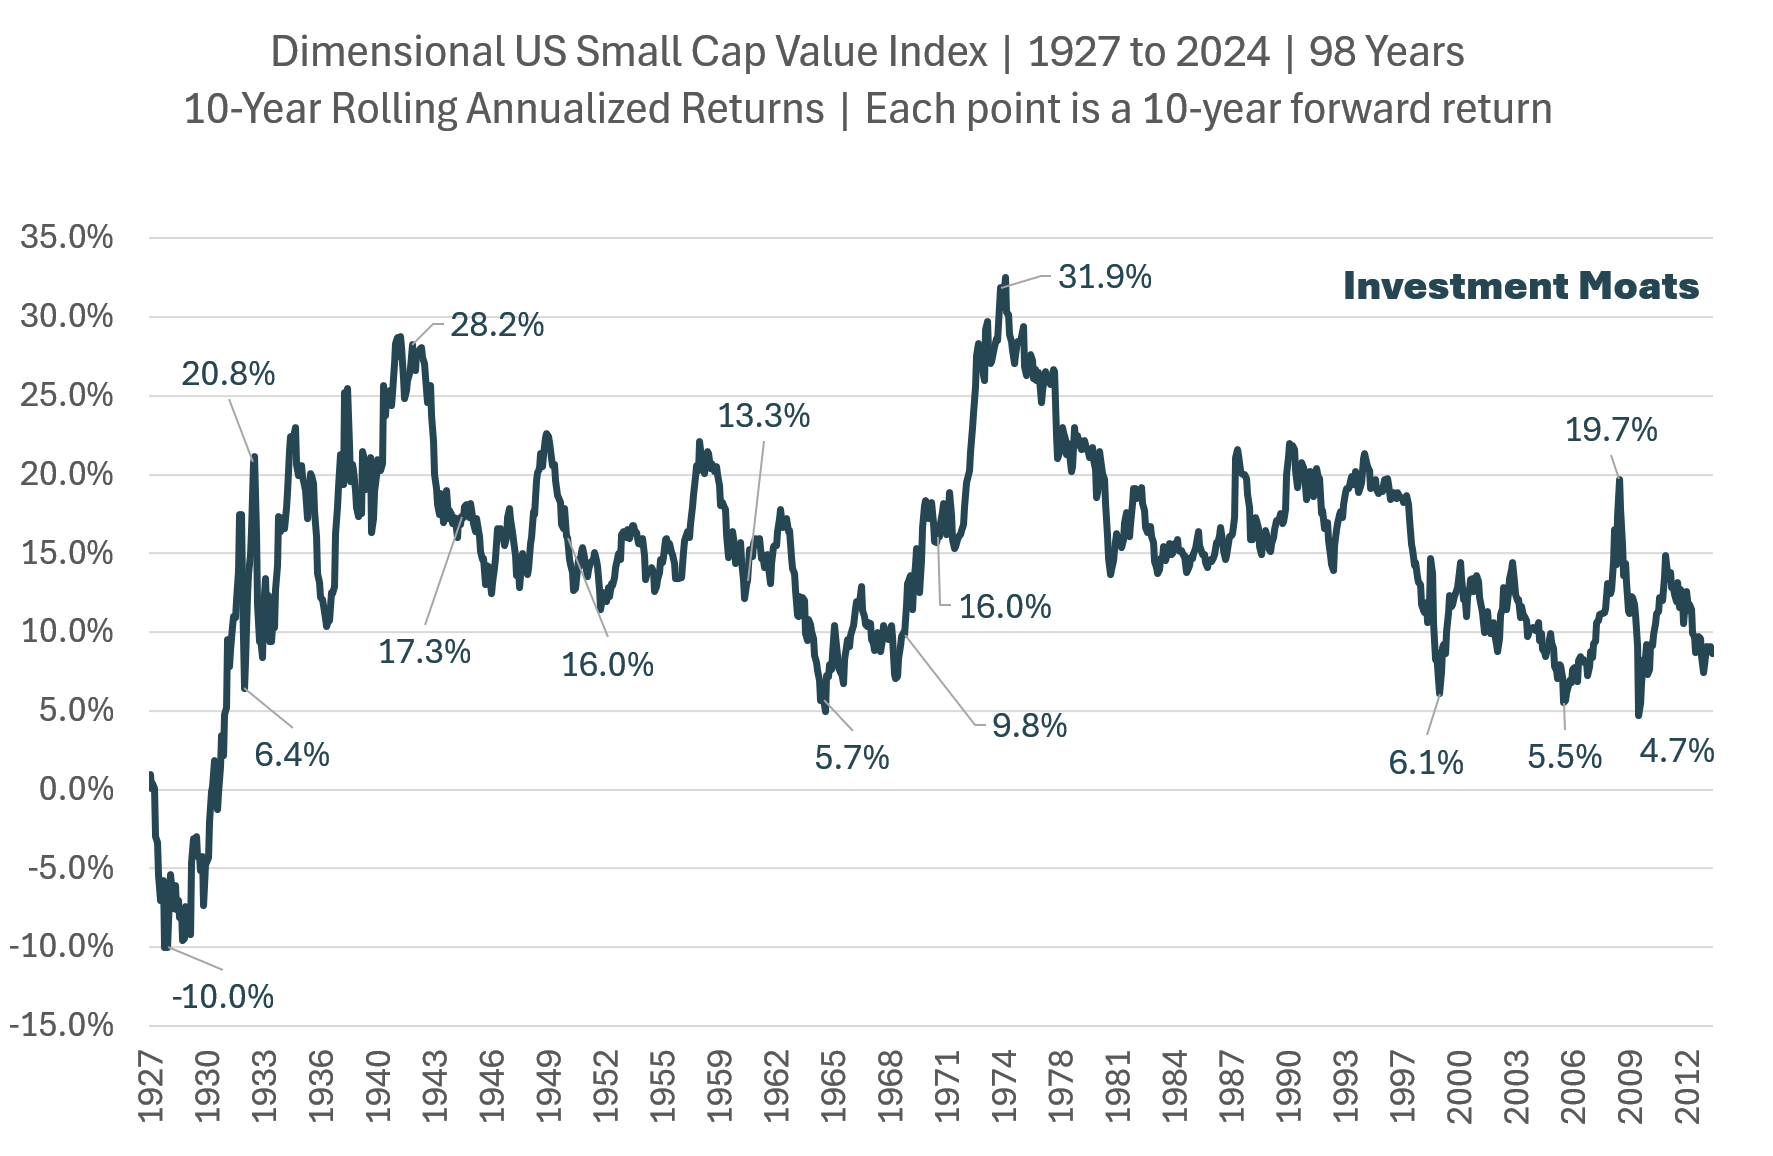
US Small Cap Value using Dimensional US Small Cap Value
Asset Class: Equity
Region: United States
Strategy: Systematic Active
Factors targeted: Small Cap + Value, some Profitability and Investment
Index Methodology
Data Source from CRSP and Compustat.
From June 1927 to Dec 1974: Companies whose relative price is in the bottom 25% of Dimensional US Small Cap Index after excluding utilities, companies lacking financial data, and companies with negative relative price, non-US companies, REITs, UITs, and investment companies.
January 1975 to Present: Companies whose relative price is in the bottom 35% of Dimensional US Small Cap Index after excluding utilities, companies lacking financial data, and companies with negative relative price, non-US companies, REITs, UITs, investment companies and companies with the lowest profitability within the small cap value universe. Index also excludes companies with the highest asset growth in the small cap universe.
Profitability: [operating income before depreciation and amortization – interest expense]/[book equity].
Asset growth: [Change in total assets from the prior fiscal year to current fiscal year].
The Ideal Timeframe to Break Even: 15 years.
The Ideal Timeframe to Capture Returns: 20 years.
Investable ETF (Irish Domiciled | Ticker): USSC | Available at Interactive Brokers


If you want to trade these stocks I mentioned, you can open an account with Interactive Brokers. Interactive Brokers is the leading low-cost and efficient broker I use and trust to invest & trade my holdings in Singapore, the United States, London Stock Exchange and Hong Kong Stock Exchange. They allow you to trade stocks, ETFs, options, futures, forex, bonds and funds worldwide from a single integrated account.
You can read more about my thoughts about Interactive Brokers in this Interactive Brokers Deep Dive Series, starting with how to create & fund your Interactive Brokers account easily.