As where we are now, we have two good days for US Small Caps followed by two extremely bad days for US Small Caps.
Many investors, like myself seem to have the idea that that a cut in interest rate will benefit smaller companies because of their greater tax burden. The smaller companies should rally based on that.
Yesterdays’s economic data show certain signs that certain aspect of the economic is weaker and the potential of rate cut is more probable than less probable.
The longer-term bond ETFs have done well:
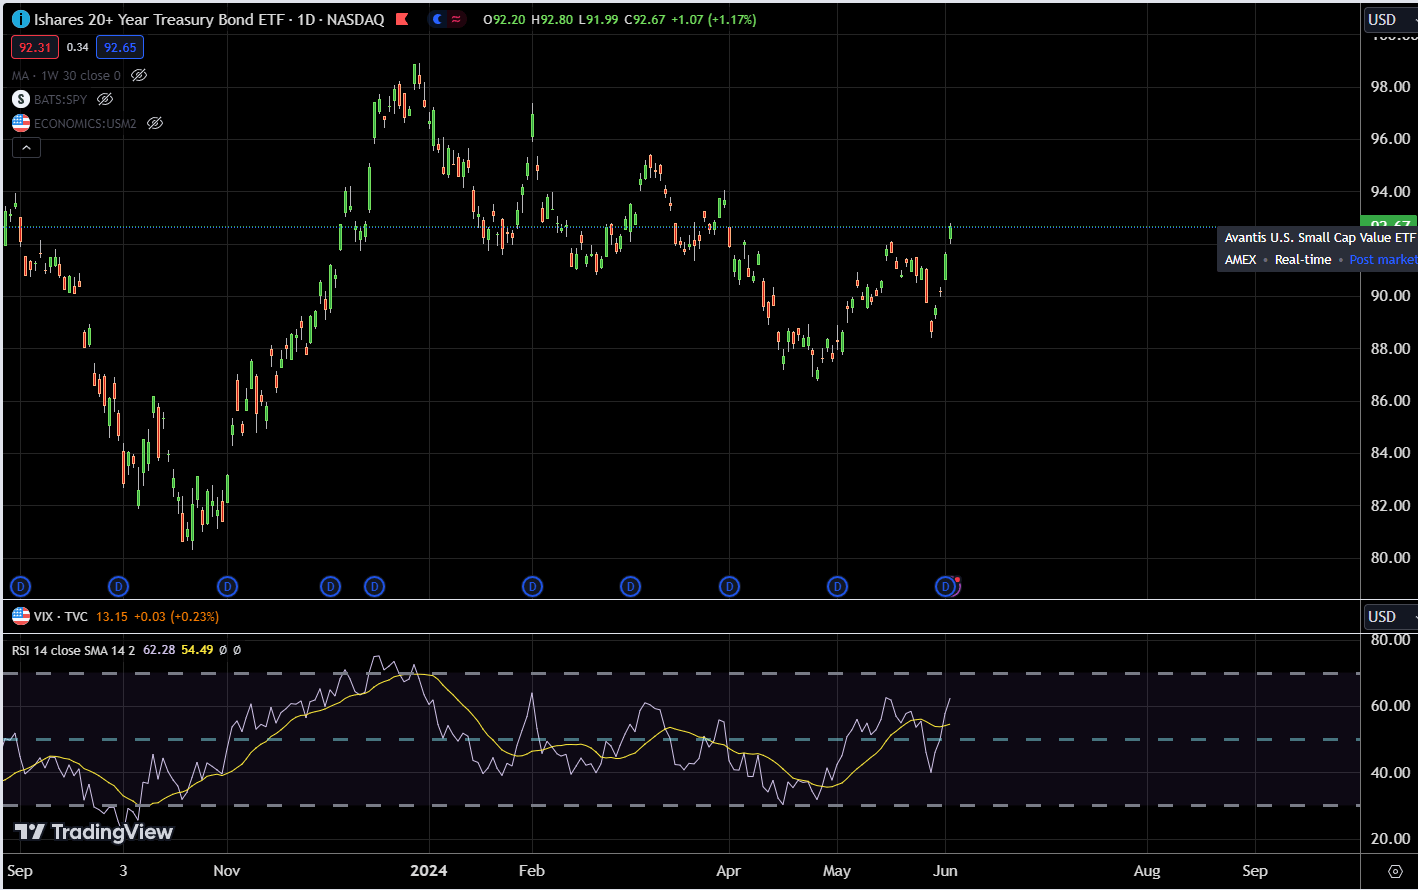
The TLT or the 20-year US Treasury ETF, which is very sensitive to potential interest rate changes, are up 2.7%.
However, the small caps, which many have anticipate will rally, plunged instead. The Russell 2000 ETF is down 2.8% during the same period.
So what could be the reasons for this price movement?
A few days ago, I saw this trading presentation, which yields some interesting charts that I have not presented in this way. This post is for me to keep track of and easily find the two tickers next time if I need them again.
The first chart is a plot of the Russell 2000 ETF with ticker IWM (the candlestick) against the S7P 500 ETF with ticker SPY (blue line):
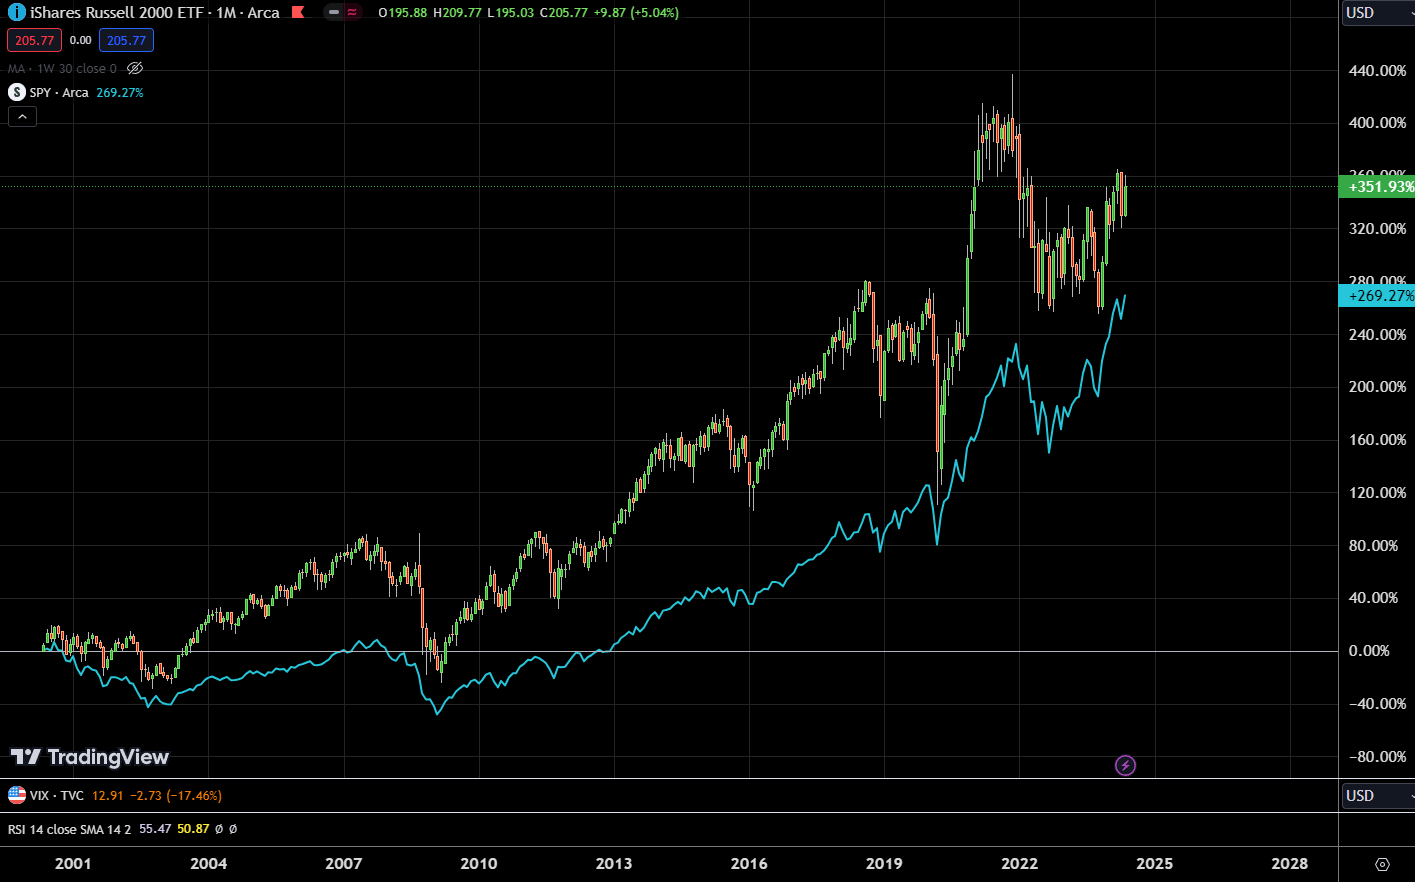
This is a monthly chart which means each bar stands for one month. In any case, we know that the SPY should do better than the IWM recently because the small caps didn’t go anywhere.
However, if we zoomed out and see a longer “growth of $1 million” chart like this case, it presents a different picture. It might jolt some of you that in the past, more risky smaller companies are more volatile, but can also do better.
Now with Trading View we can add “USM2”, which provides the US M2 Money Supply into the chart (orange line):
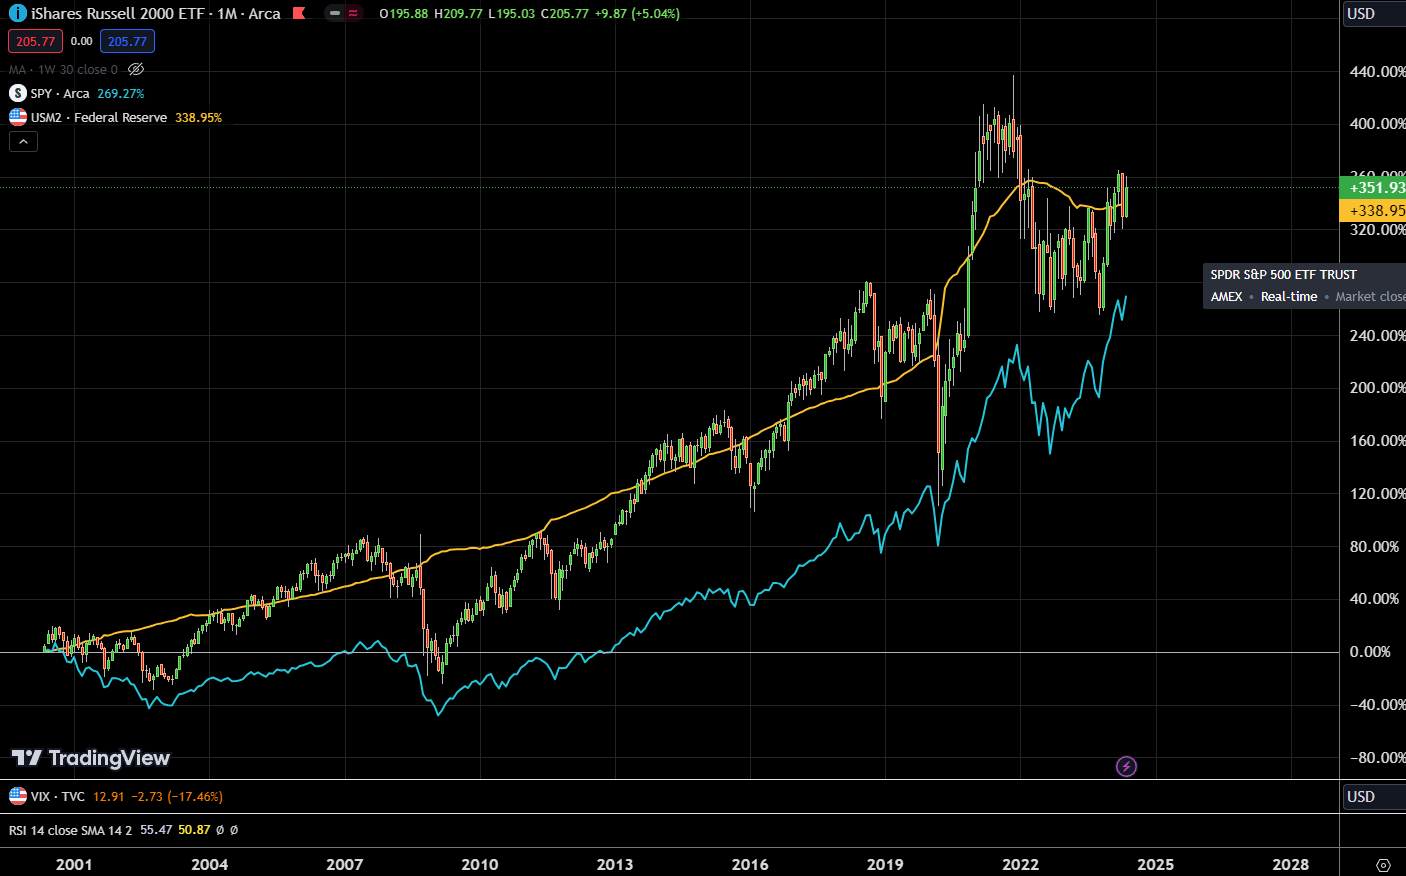
I am not sure if it is a coincidence or what for the US M2 money supply to line up so nicely against the Russell 2000 ETF. As the M2 money supply rises, both SPY and IWM go up.
I am not sure if the conclusion should be the impact of M2 money supply is greater on the small-caps than the large caps.
Using this as a timing tool might be useless (which is a different conclusion from the original presentation) because if we look at Covid, the money supply jumped but small-cap plunged from the charts. But we know the sequence since this even was not so far away. The market plunged and then stimulus money comes in and therefore the rise.
Fundamentally, money supply have a bigger impact on the smaller companies because as a cohort, their market cap is smaller than the large cap. If money flows into them, the price impact is larger. But we must also remember that the future fundamentals do matter not just the money supply.
The money supply chart seem to be at a cross road currently, with a bias that it may be curving higher.
The second chart might explain the current situation better.
It plots the same monthly IWM against the 2-Year US Treasury Yield:
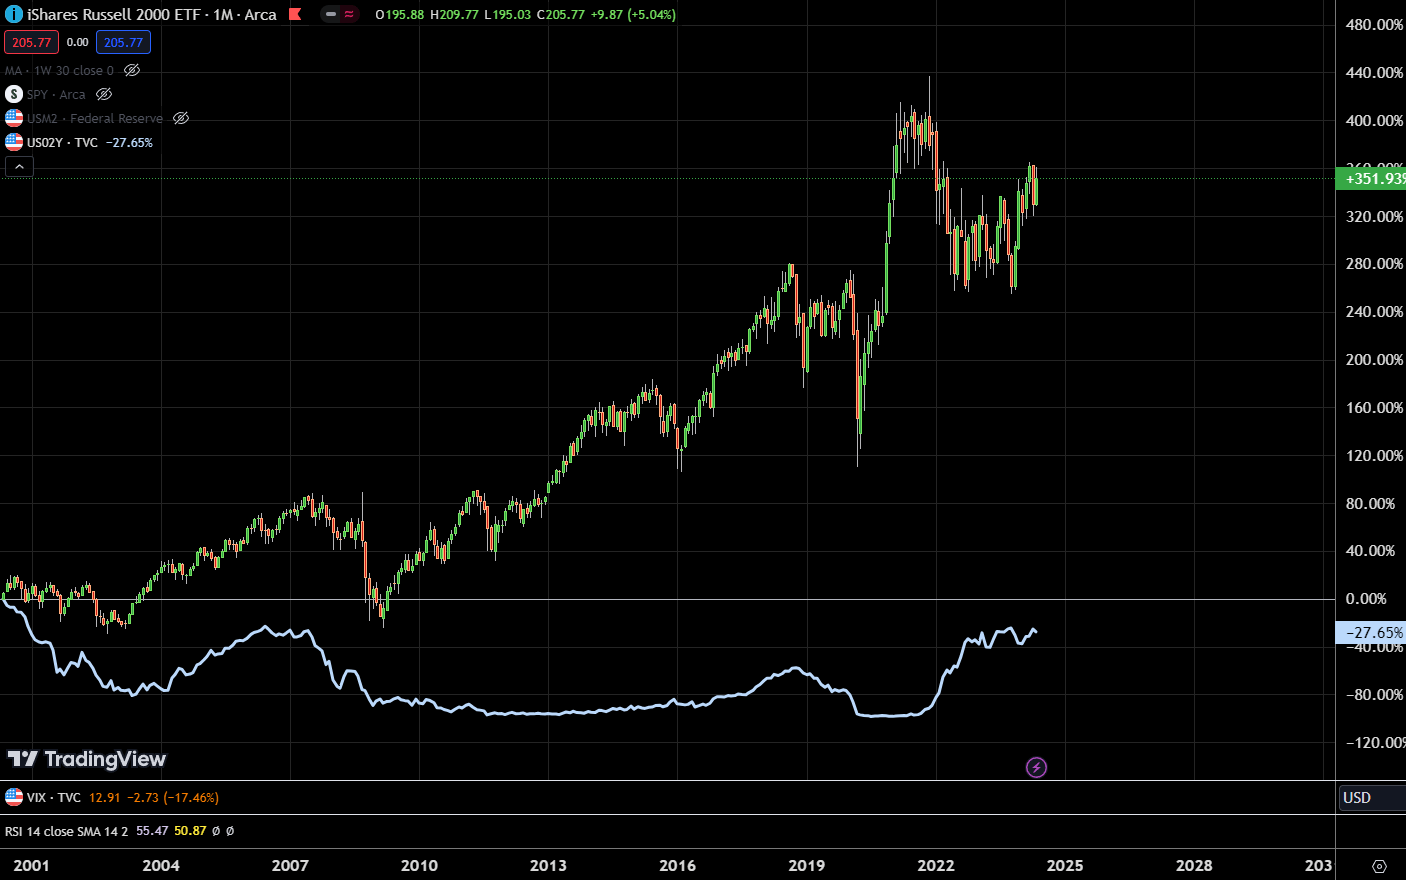
The ticker for Kyith to remember is “US02Y”. This chart shows whether there is a relationship between a shorter-term yield change and the US small caps.
The US 2-Year is more reactive to the actions of the Fed than the longer tenor bonds. So what we are seeing is that as the yield heads down, the IWM also head down (2000 to 2003), then the yield head up, the IWM also head up. Then the yield head down, the IWM also plunges.
This part might be something that younger investors like myself would be more myopic to: There is a period where it is not “the FED cut rates and the market rallies”.
More so, I think it is a chicken and egg thing.
The IWM should consist of a broader group of small businesses and should show what the health of the main economy going forward. The US bond demand and supply may indicate whether the capital allocators are more conservative or tightening up.
Both can be indicators that the economy is weakening and if economy weakens more, this is not going to be good for the small and medium businesses.
So instead of us cheering for rate cuts, we should be cheering for higher rates, if the relationship of rates and equities go back to the normal.
If you want to trade these stocks I mentioned, you can open an account with Interactive Brokers. Interactive Brokers is the leading low-cost and efficient broker I use and trust to invest & trade my holdings in Singapore, the United States, London Stock Exchange and Hong Kong Stock Exchange. They allow you to trade stocks, ETFs, options, futures, forex, bonds and funds worldwide from a single integrated account.
You can read more about my thoughts about Interactive Brokers in this Interactive Brokers Deep Dive Series, starting with how to create & fund your Interactive Brokers account easily.
Kyith is the Owner and Sole Writer behind Investment Moats. Readers tune in to Investment Moats to learn and build stronger, firmer wealth foundations, how to have a Passive investment strategy, know more about investing in REITs and the nuts and bolts of Active Investing.
Readers also follow Kyith to learn how to plan well for Financial Security and Financial Independence.
Kyith worked as an IT operations engineer from 2004 to 2019. Currently, he works as a Senior Solutions Specialist in Insurance Start-up Havend. All opinions on Investment Moats are his own and does not represent the views of Providend.
You can view Kyith's current portfolio here, which uses his Free Google Stock Portfolio Tracker.
His investment broker of choice is Interactive Brokers, which allows him to invest in securities from different exchanges all over the world, at very low commission rates, without custodian fees, near spot currency rates.
You can read more about Kyith here.
- Singapore Savings Bonds SSB August 2024 Yield Fell to 3.22% (SBAUG24 GX24080W) - July 1, 2024
- Five Years. - July 1, 2024
- Knowing the Average Returns of Your Investments Does Not Help You (Part 3) - June 30, 2024