Frasers Commercial REIT (FCOT) announced their fourth quarter and full year results this week.
They are maintaining their dividend per unit at $0.024. This brings their annualized dividend per unit to $0.096.
At current share price of $1.43, you get a dividend yield of 6.8%. (check out the current dividend yield of other Singapore yield stocks here)
After the sale of 55 market street, as per my Dividend Stock Tracker, the net debt to asset is 26.8%.
FCOT is supporting their dividend per unit with the money that they get from the sale of the hotel rights to Frasers Property Limited, paying management fees in units, taking DRIPs.
The reason for doing this is because due to the construction next to China Square Central, occupancy is affected. This will be done in 2019. Another reason is major tenant at Alexandra Technopark HP Singapore and HP Enterprises have moved out.
So FCOT is taking this 1 year to re-leased these to new tenants.
This is a risk by itself and it will show us management’s ability to add value.
This article will be short to compare one year’s of leasing performance.

This slide is a slide from 1 year ago in 2017 Q4.
It seems in this full year result, we do not see this slide. I reached the IR for comment but there were no replies about this.

In 2017 Q4, FCOT showed us how much lease expiry there will be in 2018.

Out of these, Alexandra Technopark forms the bulk of it. This includes the space that HP Enterprise will not renewed.
So how did the management do for the overall lease expiry:
- 2017 Q4: 33.3%
- 2018 Q1: 24.3%
- 2018 Q2: 11.4%
- 2018 Q3: 6.9%
- 2018 Q4: ?
Looks good. They were able to leased out well. However, I was not able to see whether the last 6.9% was leased out or there are increased vacancies. So let us take a look at the average committed occupancy rate:
- 2017 Q4: 85.9%
- 2018 Q1: 86.6%
- 2018 Q2: 83.5%
- 2018 Q3: 81.9%
- 2018 Q4: 83.4%
Overall WALE (Committed occupancy) change:
- 2017 Q4: 3.4 (years)
- 2018 Q1: 3.6
- 2018 Q2: 4.0
- 2018 Q3: 4.0
- 2018 Q4: 4.7
Occupancy rate is weak but it seems those new leased signed are longer in duration.
How about the leasing of Alexandara Technopark? Let us check out the lease expiry:
- 2017 Q4: 18.8% (inclusive of space HP Enterprise will not renew in Nov 2017)
- 2018 Q1: 12.3%
- 2018 Q2: 5.8%
- 2018 Q3: 1.9%
- 2018 Q4: ?
These are the lease expiry after deducting commitments secured. It looks to me they really have their shxt together.
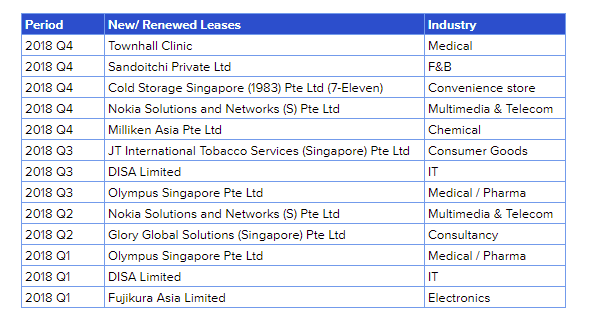 The table above shows a summary of the new and renewed leases. I have a feeling this list only includes those tenants that settled in.
It seem the bulk of the spaces taken up by:
- Olympus Singapore
- DISA Limited
- Nokia Solutions

When we go into 2019, we have only 13.1% lease expiry to deal with. I am not sure whether that is the right way to look at it as there might be some vacancy not leased out.
Instead of 15.7%, the slide above shows the lease expiry before factoring lease commitment is 20.1%.
The increase could be due to tenants renewing for just less than 1 year. High possibility is due to the special staggered lease arrangement HP have with FCOT.
Things look good.

The majority of the 13.1% is still Alexandra Technopark.
Alexandra Technopark have seen some revival in their net property income in Q4.

The chart above shows the quarter by quarter change in ATP’s NPI.
Without knowing the renewal rate, it seems there is still much recovery that needs to take place.
Other than ATP, Central Park is showing some weakness as well. Rental rate in Perth have plunged in the past 2-3 years and vacancy have sky rocked.

FCOT managed to lease to Rio Tinto for 12 years. This has been some form of pre-commitment/agreement with Rio Tinto, so we are not sure what is the rate Rio Tinto leased at.
My opinion is that you cannot avoid rent drops. You can avoid vacancy.
In this case the 5.9 mil NPI is a one off, but the previous baseline is around 4.3 mil. This have gradually dropped over the next few quarters.
The main reason given is lower occupancy. We do not know whether this is transitional spaces.
In any case, I think over this one year, we see that the management was able to lease out the space. However, we do not know whether they are able to minimize the fall in cash flow.
The NPI change in ATP and Central Park, are the metrics that I would be watching.
What is not included in my analysis here is whether the free cash flow supports the $0.096-$0.10 in dividend per unit.
I felt that the loss of 55 Market Street is not very very significant. They do save on interest expense. But to continue paying the dividend sustain-ably, they have to redeploy into buying something that has a CAP Rate of 5-6%.
That would be a big boost to the cash flow.
Do Like Me on Facebook. I share some tidbits that is not on the blog post there often.
Here are My Topical Resources on:
- Building Your Wealth Foundation – You know this baseline, your long term wealth should be pretty well managed
- Active Investing – For the active stock investors. My deeper thoughts from my stock investing experience
- Learning about REITs – The Deeper stuff on REIT investing
- Dividend Stock Tracker – Track all the common 4-10% yielding dividend stocks in SG
- Free Stock Portfolio Tracking Google Sheets that many love
- Retirement Planning, Financial Independence and Spending down money
Kyith is the Owner and Sole Writer behind Investment Moats. Readers tune in to Investment Moats to learn and build stronger, firmer wealth foundations, how to have a Passive investment strategy, know more about investing in REITs and the nuts and bolts of Active Investing.
Readers also follow Kyith to learn how to plan well for Financial Security and Financial Independence.
Kyith worked as an IT operations engineer from 2004 to 2019. Currently, he works as a Senior Solutions Specialist in Insurance Start-up Havend. All opinions on Investment Moats are his own and does not represent the views of Providend.
You can view Kyith's current portfolio here, which uses his Free Google Stock Portfolio Tracker.
His investment broker of choice is Interactive Brokers, which allows him to invest in securities from different exchanges all over the world, at very low commission rates, without custodian fees, near spot currency rates.
You can read more about Kyith here.
- My Dividend Experience Investing in UCITS iShares iBond Maturing in 2028. - April 23, 2024
- We Invest into Popular Funds When They Are Popular, Exactly When They Started Turning to Shxt. - April 22, 2024
- Meal Prep 2.0 – Cooking Your “Go-to” Meal that You Look Forward to Eating Everyday. - April 21, 2024
Bob
Monday 22nd of October 2018
Thanks for the analysis.