A few months ago, one of my readers asked what I think of this Nasdaq 100 Covered Call ETF (QYLD).
The most appealing thing about this strategy is that it gives us a prevailing distribution yield of 11% currently.
Readers that are more prudent would be more cautious and sceptical about the yield. This is one of the reasons the reader asked for my opinion about.
I think I can see the appeal of this ETF’s strategy for some readers looking for income.
However, I think if we view from the total returns perspective and not a dividend income perspective, this ETF may have the same less than desirable characteristics that stop us from investing in the underlying index.
Let us go deeper into it.
What is the Nasdaq 100 Covered Call ETF (QYLD)?
The QYLD is more of an actively-managed ETF that tries to execute a covered call strategy.
There are a few parts to unpack here:
- Covered call strategy: This fund tries to execute a pair of stock plus option strategies in a systematic manner.
- Actively managed: Most of you may think that ETFs tries to mimic benchmarks which tend to be rather passive but there are ETFs that try to execute some strategies, where the strategies tend to be more active, or a group of human managers is involved to make some qualitative investment decisions. This ETF leans closer towards that.
- ETF tries to mimic the CBOE Nasdaq-100 BuyWrite V2 Index. While there is a benchmark, the frequency of intervention leans closer to being more active.
- This ETF is listed on the NASDAQ.
- Global X is the manager of this ETF.
- The total expense ratio of the ETF: 0.60% a year
- ETF inception date: 11 Dec 2013
- Net assets: $5.6 billion
The QYLD has a fair bit of history and it is one of the biggest if not the biggest covered call ETF out there.
Withholding and Estate Tax Efficiency of the QYLD
Since this ETF is domiciled in the United States, I reckon the distribution is subjected to U.S withholding tax. Currently, that will be 30%.
However, if the distribution is not as dividend but in other means, then they might be able to bypass the 30% withholding tax.
Currently, I do not own the ETF so am not able to test it out. But if you are currently or have been a holder of QYLD or a similar ETF, do let me know in the comments.
Aside from withholding tax, it is likely that your holdings in QYLD, as a United States asset is subjected to estate tax consideration when you passed away.
For more information on withholding tax and estate tax:
Are there other ETFs similar to the QYLD?
Global X have 4 other covered call ETFs listed in the United States:
- S&P 500 Covered Call ETF (XYLD) – 8.5% distribution yield currently
- Russell 2000 Covered Call ETF (RYLD) – 12.2% distribution yield currently
- S&P 500 Covered Call & Growth ETF (XYLG) – 4.3% distribution yield currently
- Nasdaq 100 Covered Call & Growth ETF (QYLG) – 5.6% distribution yield currently
XYLD and RYLD are similar in flavour to the QYLD except that the covered call strategy is executed on different underlying indexes (S&P 500 and Russell 2000 respectively)
XYLG and QYLG were announced in September last year. They vary in that their exposure to covered calls is only 50%. Hence you can see the distribution yield is halved.
For more information, you can read about the differences between fully covered and 50% cover here in this Global X write-up.
Aside from this, there are two to three other covered call ETFs listed on the US stock exchanges.
In Europe, there do not seem to be many UCITS covered call ETFs listed.
How does a Covered Call strategy work?
This series of Global X strategies try to execute a covered call writing strategy that is quite popular among investors.
If you are interested to invest in this ETF, I would urge you to try and understand how the strategy work, its pros and cons.
If not, when the volatility of the market picks up, and it does this or that, it will come as a shock to you. If you do not know how to interpret it, you sell for all the wrong reasons.
You can Google up “Covered Call Strategy” on YouTube and you may get some good results.
A covered call strategy entails
- Buying an underlying stock or ETF
- Writing (or in trade execution Selling) a Call option. When you sell a call option, you earn a premium. In option terms, the premium is debit to you
An investor’s payoff is determined by what the stock or ETF does.
There can be 3 outcomes:
- If the stock or ETF is above the Call option’s strike price, the investor has to deliver or “pass” the underlying stock or ETF he bought in #1 previously to the person who bought the call option from you. You will earn the premium you wrote (or sold) and the difference between the price you bought the underlying stock or ETF and the strike price
- If the stock or ETF is below the Call option’s strike price, but the stock goes nowhere, you get to keep the stock or ETF and the premium you wrote in #2 above
- If the stock or ETF price plunges, you get to keep the stock or ETF and the premium you wrote in #2 above, but as the stock or ETF plunges, you suffer losses from the underlying stock.
The payoff for the investor can be presented this way:
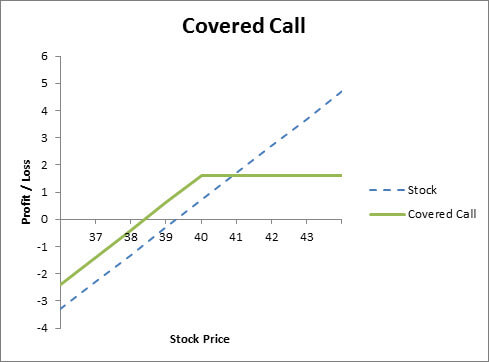

Let me try to explain. The blue line shows the payoff of the underlying stock or ETF. As you can see, your upside (above $0) is unlimited, your downside is limited to 100% losses.
With a covered call strategy, your upside is capped (in this case somewhere between 1 and 2). No matter how high the underlying stock price goes, your upside is capped.
If the stock is between 38 and 40 (in this diagram), you earn the premiums you wrote, and also the appreciation of the stock/ETF at various degrees.
If the stock goes down… you suffer as well.
So a covered call strategy is great if the underlying does not go anywhere and you earn a premium.
You can write month after month.
The strategy is also upside biased in that if the market is bullish you will do okay but less great than if you just own the underlying.
How does QYLD’s Covered Call Strategy Work?
The strategy is designed to
- Offer investors potential monthly income
- Lower volatility than just a pure buy-and-hold the underlying index
QYLD’s Covered Call-Writing Process (from their website):
- QYLD buys all the equities in the Nasdaq 100 Index
- QYLD then sells Nasdaq 100 Index options (NDX) to a counterparty that will expire in one month
- A premium is received in exchange for the sale of the index options
- At the end of the month, QYLD seeks to distribute a portion of the income from writing/selling the NDX index option to the ETF shareholders
- At the beginning of each new month, this process is repeated
You can read more about their process here.
I think the reason a Nasdaq covered call strategy is the most popular is because of people’s affinity towards tech companies. Nasdaq 100 and Russell 2000 should be more volatile compared to S&P 500.
Thus the potential distribution yield is higher.
The options duration written should be roughly a month.
Every time they write an option, they write an at-the-money (ATM) call option, which means the strike price of the option is equal to the current prevailing price.
There are a few actions involved in this strategy:
- Buy the underlying stocks
- Sell options at the money
- Buyback the underlying stocks if it’s called away
Why do people like QYLD?
What is not to like about QYLD?
In a 60 basis point ETF, you get a 12% yield and a manager that helps you automate the nitty-gritty of a covered call strategy.
Because you delegated the job away to the ETF, the distribution is rather passive.
12% yield (before taxes) is so appealing if you are struggling to find a sensible and sustainable income stream for your financial independence.
What should you be aware of about the QYLD?
I guess you have to be aware of what an automated covered call strategy like this is and what it is not.
Different investors have a different ideas about something like the QYLD:
- It will have its drawdown that is less than the Nasdaq 100 but is still rather drastic
- The returns you get are split between the high yield and capital appreciation you see on QYLD’s NAV, but they should really be viewed as a whole. You should not expect that you get a 12% yield a year AS WELL AS the capital appreciation of the Nasdaq 100.
- Distributions from the ETF is going to be volatile. The distributions that you get is based on the implied volatility of the underlying index. Implied volatility do not stay constant and thus income is likely not consistent.
The Economic Drivers Behind A Covered Call Strategy
Anyone can throw up a very funky strategy and tell you that it will succeed in the long run. However, some of these strategies do have not much basis to earn the returns that were touted.
It is always important to check if a strategy like a covered call strategy has adequate economic grounding to provide returns.
We usually evaluate in two different layers. The first layer is the fundamental economic driver and the second layer evaluates whether there is a legitimate driver for the style.
Layer 1: Fundamental economic driver
A covered call strategy is made up of two portions:
- Buying and holding the underlying shares or index
- Selling a call option and earning a premium
It is relatively easier to figure out the economic driver of the first portion. A stock gives you minority ownership to a business. The business generates free cash flow today or in the future. The value of the stock is the aggregate of the discounted future cash flow.
So as a business thrives more than what we expect today, the share price should go up.
An index is an aggregate of a bunch of businesses, so the value is derived as a result of that.
The second portion may be new to some of you.
Writing or selling a call option is like you becoming an insurance company. Someone out there wishes to hedge their worry that they cannot buy a stock at a certain price. So you sell them this “insurance” that in the event that they would like to buy the share/index at that price, they could do that.
In return, they pay you a premium just like the premium you pay on insurance.
The premium is therefore not a dividend but revenue for providing that service.
This “insurance revenue” changes over time due to the probability of whether the stock or index will hit that desired buy price.
There is the risk to the options seller (you) and the options buyer and it’s usually a fair exchange.
Fundamentally, there are legitimate economic reasoning behind the covered call strategy.
Layer 2: Style driver
In the second layer, we want to find out whether there is an economic reason to explain why a high volatility risk premium exists.
In other words, is a 12% a year premium a free lunch?
If markets are efficient, then options should be well priced that whatever the option premiums you earn compensates your risk as an option writer well. There should not be any excess premium.
That is usually not the case.
The implied volatility or the computed volatility of the future is usually MORE than the realized or actual volatility.
This can be due to a couple of reasons:
- Behavioural: Investors are more concerned about their downsides, so they would be more willing to spend to purchase a put option to hedge the risk that their portfolio will implode. Higher demand, higher implied volatility. However, the implied volatility for call relative to the realized volatility should be lower as the call is not getting some sort of insurance protection.
- Structural: Due to the low-interest environment, different institutions are looking for ways to get yield and this has created new business lines to use options premiums to generate yield. On top of financial institutions looking for yield, in order to hedge their positions to buy put options (explained in #1), they need to finance by selling call options to earn that premium (which is used to buy the put).
Options are like a very dynamic insurance industry just that nowadays it is filled with a lot of speculators as well.
There is legit justification for some style premium in selling puts and calls.
But the degree of premiums also changes over time depending on the market environment.
Now let us take a look at some empirical evidence.
Empirical Evidence of Covered Call Strategy Across Markets and Time
So we figured out that covered call strategy has some economic basis but how do the returns look?
Does the strategy work across different markets?
I found a couple of papers dealing with which gives us a better profile on covered call strategies. Both papers have an author in common: Roni Isrealov of AQR Capital.
- Covered Calls Uncovered (2015): The authors feel that not much is written about the covered call strategy and that it is shrouded in mystery so they sought to uncover it.
- Covering the World: Global Evidence of Covered Calls (2017): The authors explained that typically covered call strategy can be attributed to three factors: equity exposure, short volatility exposure, and equity timing. The authors simulated covered call strategies across 11 markets and find that these three components explain the performance and risk of the covered call strategies in different markets.
The OptionMetrics IVY database supplies daily closing prices, implied volatilities, dividends and option deltas through 2015 for eleven different equity indexes analyzed in the second paper. With this data, the researchers can compare the returns from 2006 to 2015.
The following two table shows the performance of a buy and holds equity indexes versus the corresponding covered call strategy:
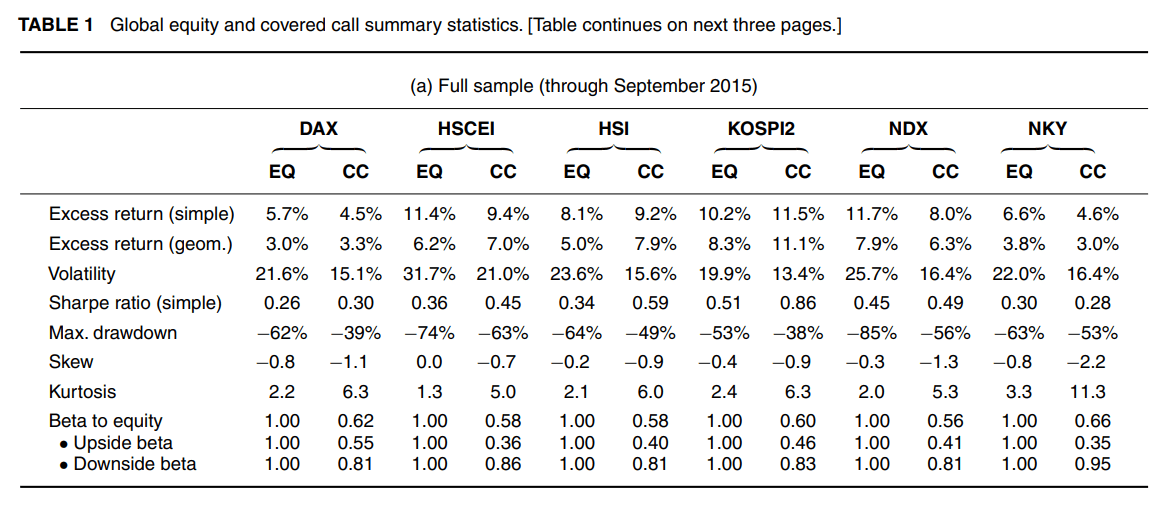
The researchers were able to gather up the performance of 11 indices. EQ stands for the underlying index performance while CC stands for the covered call. Each of these indices starts at different time periods, so when the data says through September 2015, it means they compute for Dax from 2002 to 2015 and S&P 500 from 1996 to 2015.
There are a few things that you would notice:
- The excess return shows the return above 3-month Libor rates.
- Covered call strategies generally have lower excess returns over the equity indices
- Hong Kong, Korea, Euro Stoxx (SX5E) has higher excess return versus the underlying equity returns
- The volatility of the covered call strategy is lower.
- Max drawdown for the covered call strategy is lower.
- Kurtosis of the covered call strategy is also higher. This means that the range of returns that you would get tends to be close together. But that would also mean that if there is a tail event, it will be worse/immensely good.
- The drop off in return from simple to geometric return for covered call strategy is lower. This indicates a smaller volatility drag
- Higher Sharpe Ratio, which measures the return per unit risk. This means the covered call strategy provides better risk-adjusted returns.
Generally, returns are better when adjusted for volatility. Of course, the time period that we have to gather is not a lot but nevertheless, it is good to see some empirical evidence.
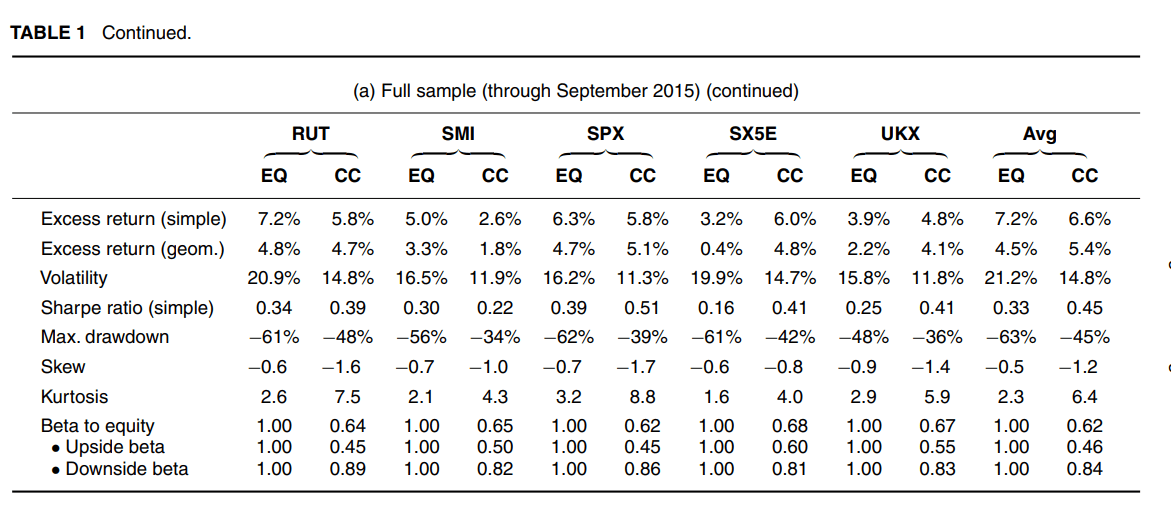
Here are the comparison of the two strategies for the 11 indices if we fixed the period from 2006 to 2015:

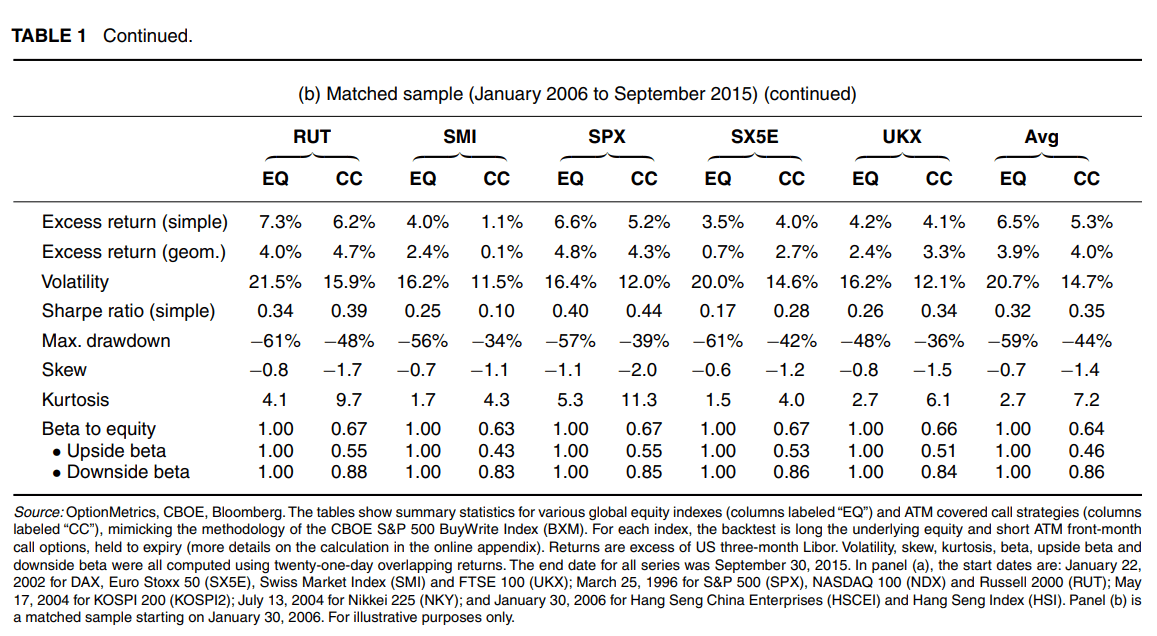
Euro Stoxx and Hang Seng still show that the covered call strategy gives better returns but generally the results are consistent.
The Nasdaq covered call returns show a significant drop off during this period.
Generally, these two research show that returns when adjusted for risk tends to be better for a covered call strategy.
But it does not mean you eliminate the downside. You would still experience drawdown.
Judging by the volatility profile, the volatility profile tends to be higher than a balanced portfolio. So if you are looking at a covered call strategy to be an alternative for clients with lower risk tolerance, this might not be it.
A Word on Higher Kurtosis
The previous research clearly shows that the covered call strategy has higher Kurtosis, which means your returns are bunched together.
However, if there are outliers, they tend to be severe.
Karyl Leggio and Donald Lien found in their 2005 paper titled Covered Calls: A Lose/Lose Investment that the strategies tend to produce negative skewness in returns.
This is because the covered-call strategy eliminates the upside potential, if there is a return outcome that is very far out of the norm, you are only exposed to the very negative return outcome and not the very positive return outcome.
How is the Historical Returns of the QYLD Like?
Here are the historical returns published by Global X:
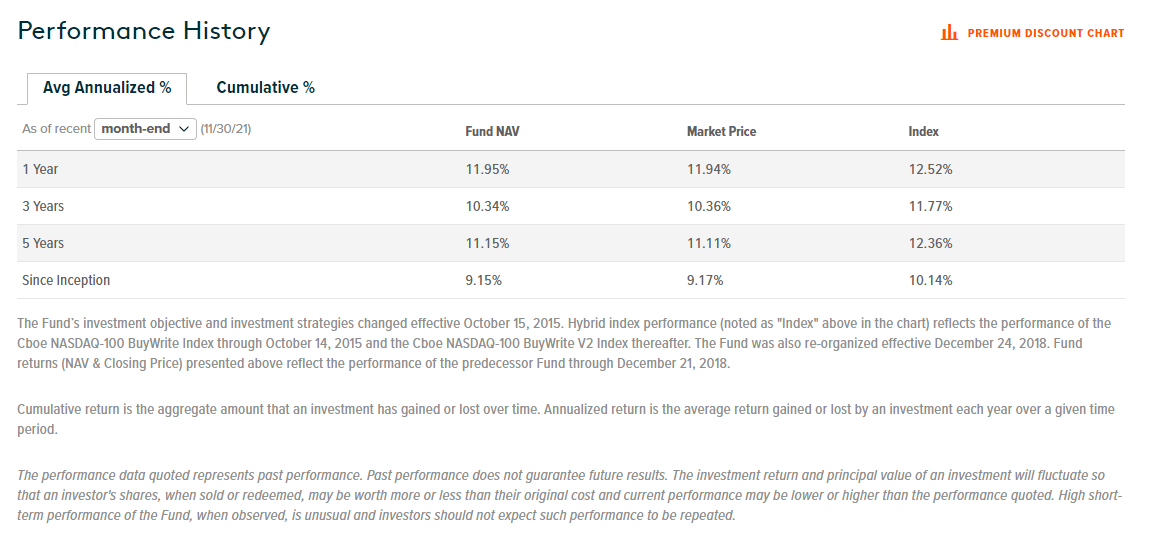
A large part of the returns is from distributions, so you cannot just read the returns of your stock charts.
The fund does show a slight underperformance versus the Cboe NASDAQ BuyWrite V2 Index.
Here is the Index performance:
- 1 Year: 32.4%
- 3 Year: 33.3%
- 5 Year: 28.6%
While the QYLD gives you lower volatility and drawdown, your returns are also capped.
Interestingly, the annualized return of the QYLD seems lower than the prevailing distribution yield.
Here is the performance chart of QYLD since it got listed in Dec 2013:
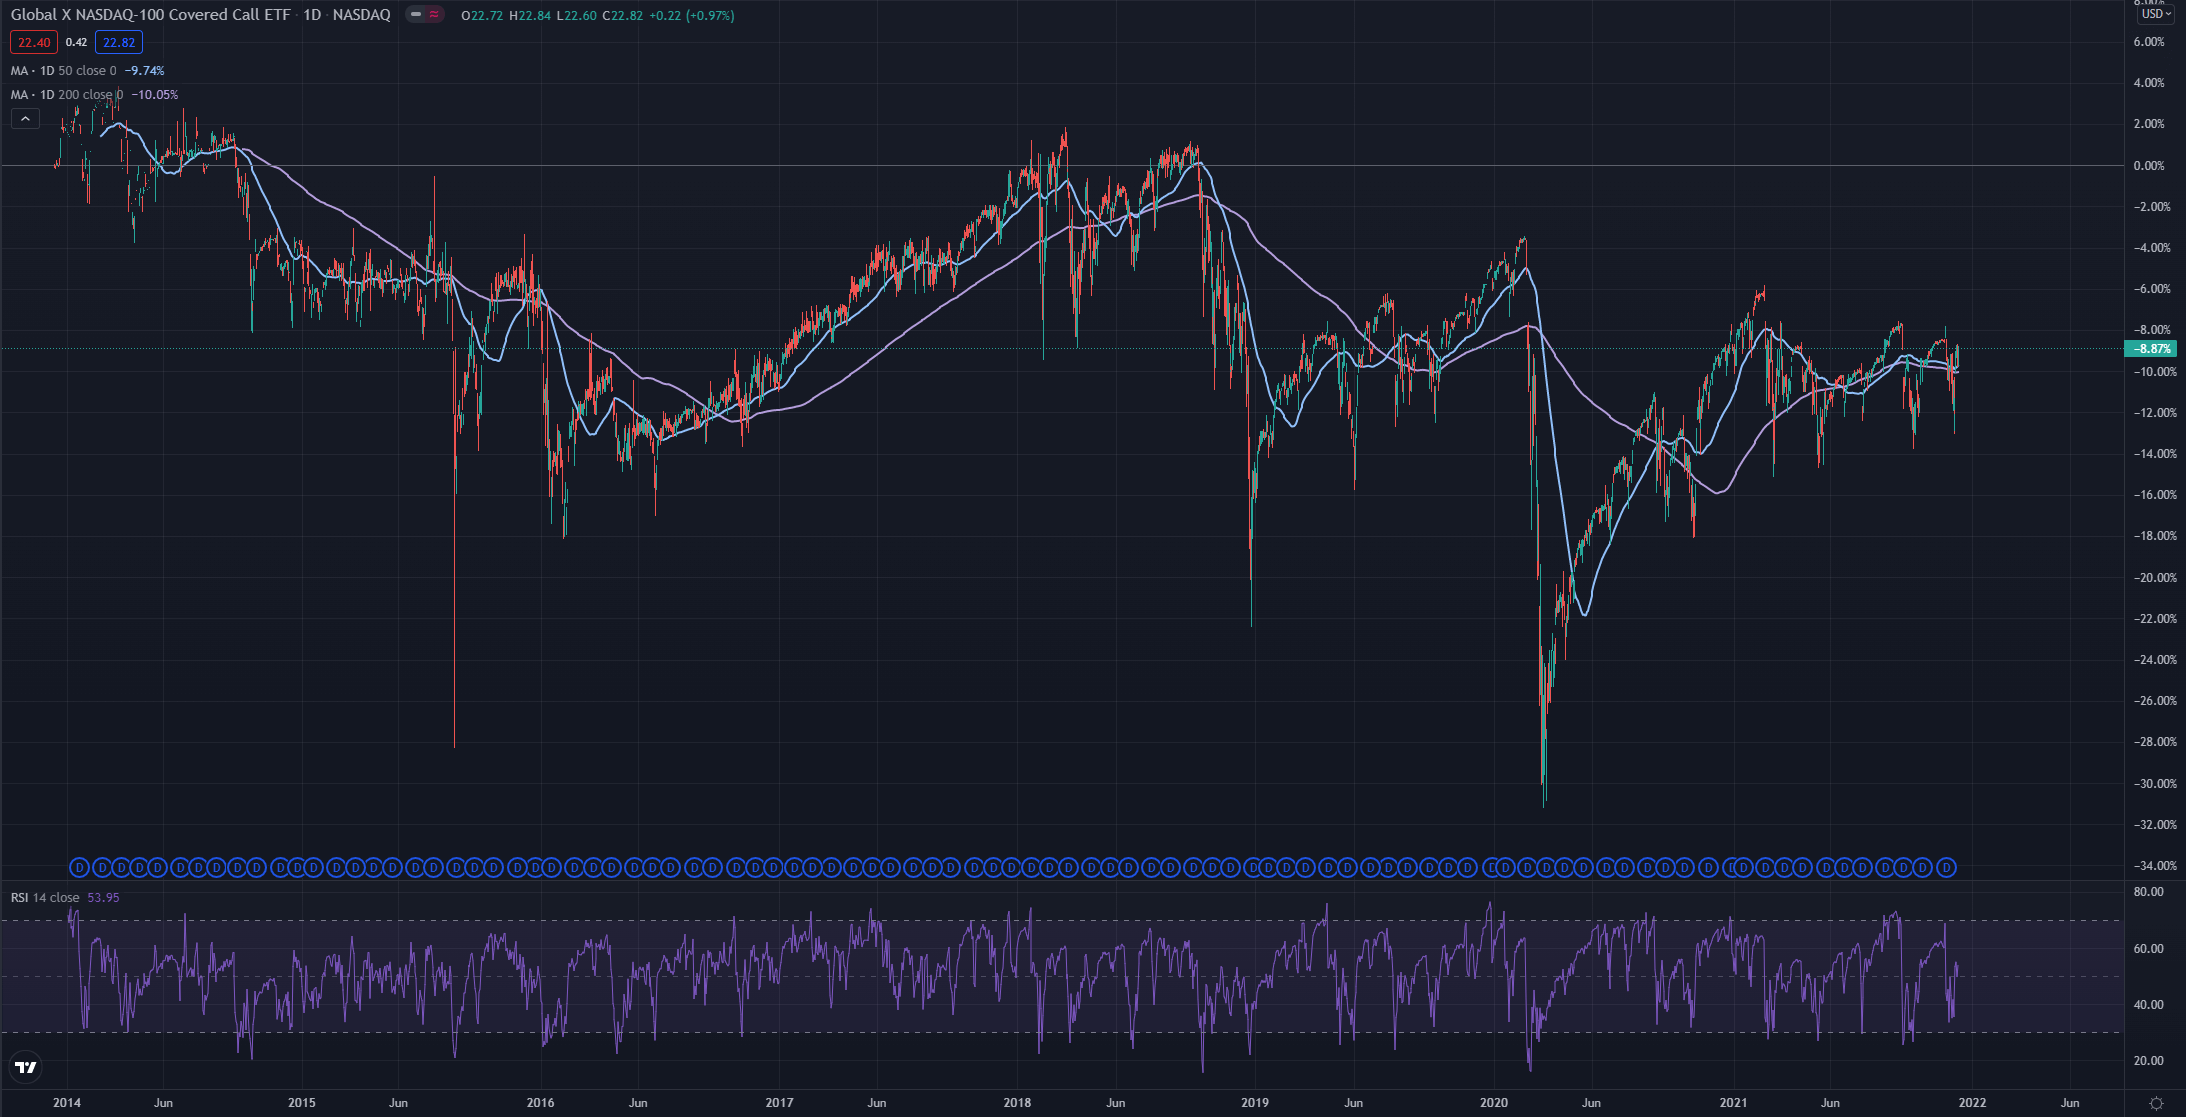
What you will notice is that the NAV of QYLD has receded by 8.88% since its debut in Dec 2013.
This looks very similar to some of the income funds that distribute high dividends. When dividends cannot be sustained, the distribution needs to come from somewhere.
In the case of QYLD, I am quite sure the distributions should only come from premiums.
So what could explain the falling NAV?
My guess: returns of indexes come in a bunch. Returns are not uniform. If you capped your upside, you severely missed out on opportunities to grow the NAV. You need that odd few 30% a year return. You cannot capped your returns to 11%.
Hence this is what you get.
Analysing QYLD’s Dividend History
Since its debut in late 2013, QYLD has maintained its monthly dividend history.
I have tabulated the dividend per unit and provided a hypothetical yield on cost to give you an idea how would your distribution income be like if you had invested in 2013:
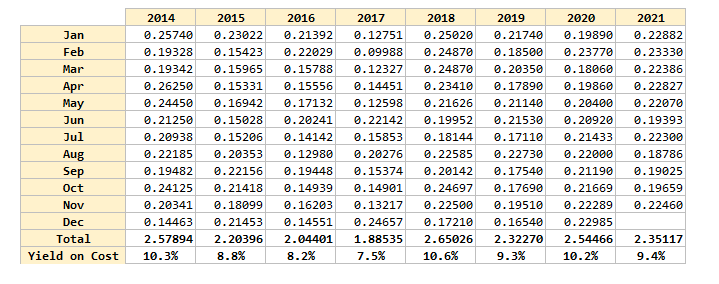
Each year, the distribution per unit fluctuates. If you have invested a lump sum of $1 million, it will provide you with an income of
- 2014: $103,158
- 2015: $88,158
- 2016: $81,760
- 2017: $75,414
- 2018: $106,010
- 2019: $92,908
- 2020: $101,786
- 2021: $94,047
If you are planning how much you could spend, you have got to plan with some margin of safety.
But how much? Should you plan to spend $100,000 or 25% less at $75,000?
Planning to spend only income is challenging.
I suppose you could always be more conservative and plan to spend only an initial 5% and adjust the spending by inflation. It will leave enough for you to reinvest in the QYLD to get additional income.
You would also notice that after almost 8 years, the income generated has not gone up above the initial amount.
If you plan to only take income, you would need to engineer your own inflation adjustment.
Should we add QYLD into our Portfolio?
I decided to put QYLD into two hypothetical portfolios to see if QYLD is able to reduce the overall portfolio volatility or improve the returns.
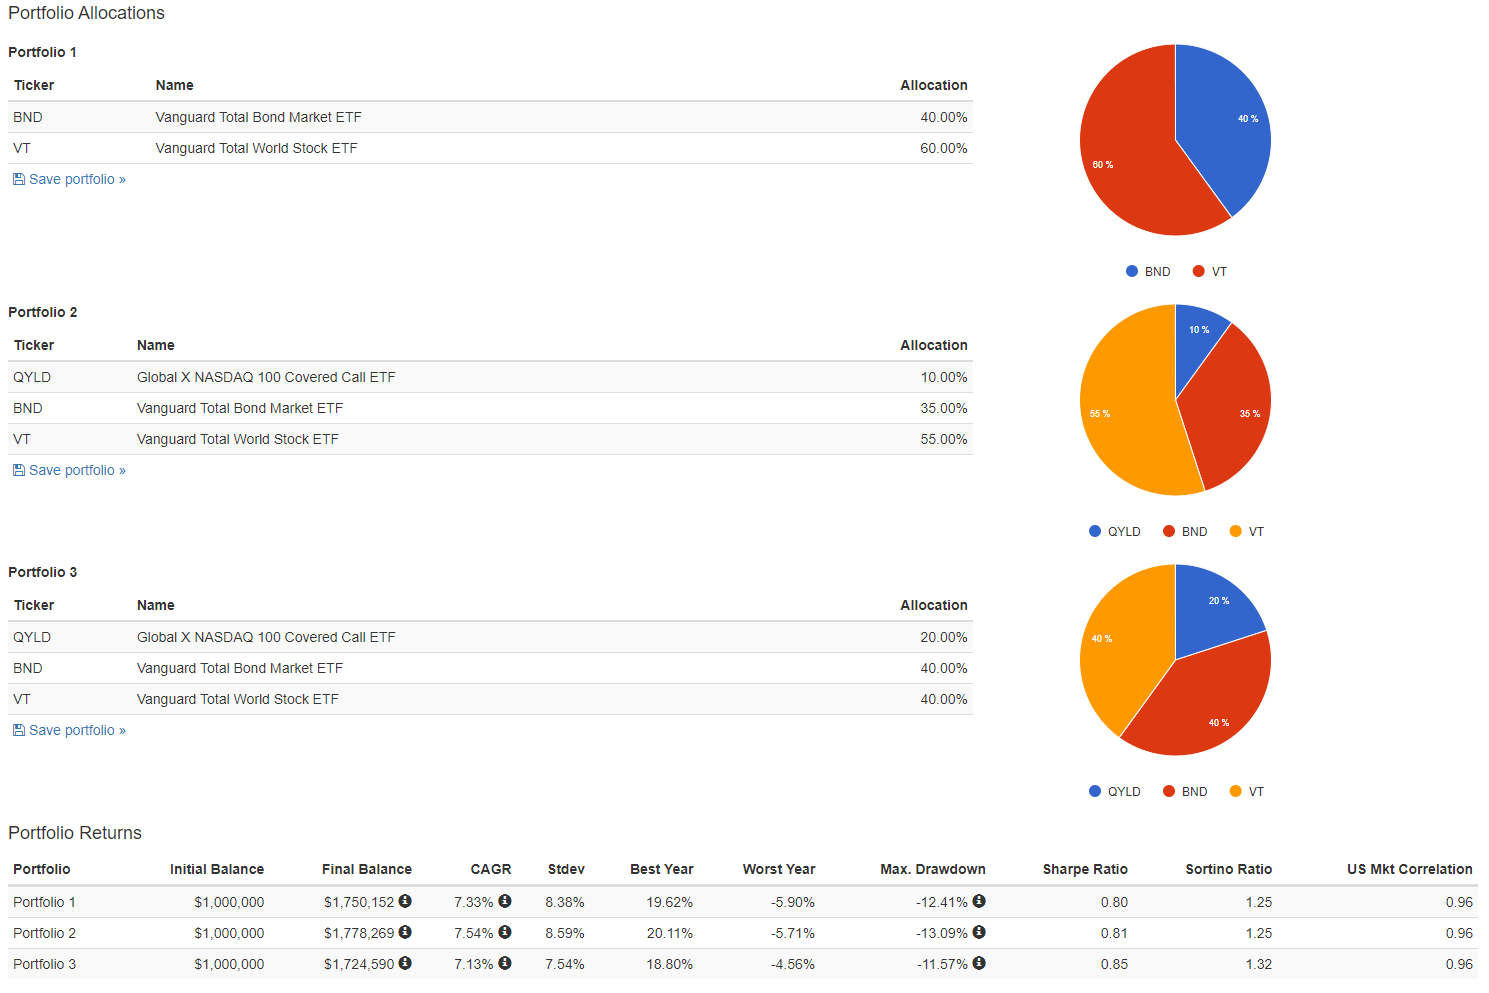
We start off with a 60% VT 40% BND balanced portfolio in portfolio 1.
I decided to take 5% each and replace that with QYLD in portfolio 2.
Then lastly, instead of replacing the bond portfolio, I decided to replace 20% of VT with QYLD to create portfolio 3.
Turns out in this setup, QYLD did not improve the portfolio return, or reduce the volatility of the portfolio.
Given that QYLD has a lower volatility profile but higher returns, how does it compare against a balanced portfolio?
I did such a comparison between a 100% VT portfolio (#1), a balanced portfolio (#2) and a 100% QYLD (#3).
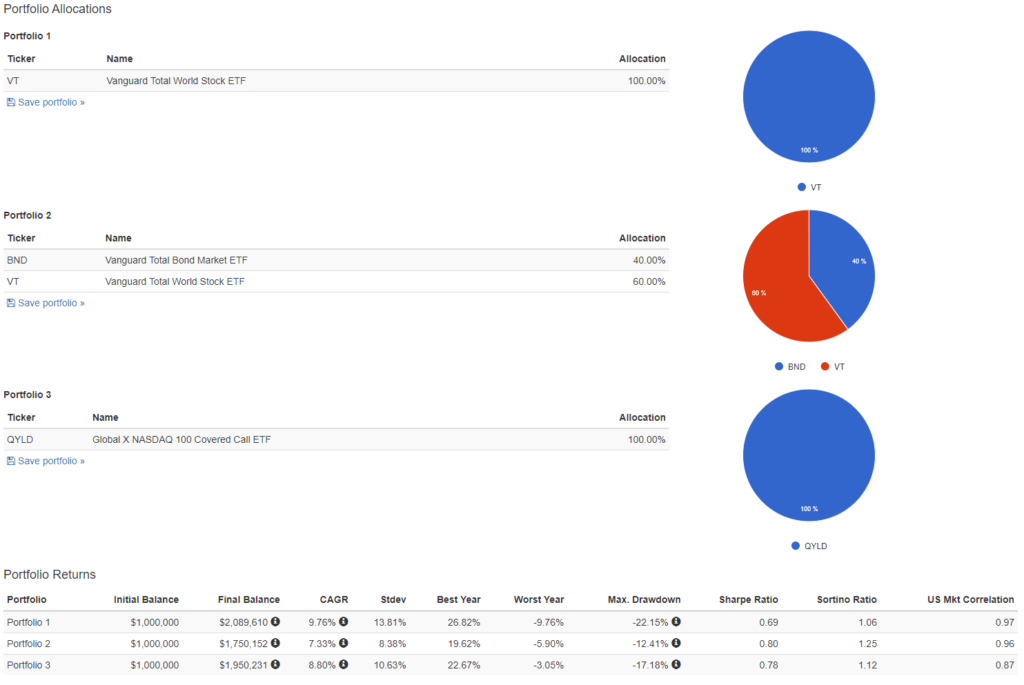

QYLD rest in between the 100% VT portfolio and balanced portfolio. It has got a better worse year than the balanced portfolio.
However, the worst drawdown is greater than a balanced portfolio.
Conclusion
The appeal of a covered call strategy on a Nasdaq 100 index is that you are able to earn a premium-based income, in a passive manner that might be suitable for your financial independence.
The yield is appealing but like many income-based solutions, the income is likely to be volatile.
If you have invested in the QYLD since IPO, there will be years where the income is 25% less.
You would need an income strategy to tackle volatile income.
It is likely that there is a 30% withholding tax on the distribution and if the majority of the return you will get from this ETF is through distributions, then this is a massive capped on the returns of this strategy.
There is economic grounding in a covered call ETF strategy. The evidence does show excess return consistency across various markets.
The returns are lower than the index returns but with lower volatility.
However, if what will cause us to make a rash financial decision is a big drawdown, the covered call ETF may not help much.
We can see from our past history that the drawdown, while damped, can still be rather severe.
Ultimately, there are investors who find it appealing that this is a passive way to get income and not touch capital, but it doesn’t help when your capital still goes down despite not spending income.
Perhaps it would be wise to look at returns from a total returns perspective.
If you want to trade these stocks I mentioned, you can open an account with Interactive Brokers. Interactive Brokers is the leading low-cost and efficient broker I use and trust to invest & trade my holdings in Singapore, the United States, London Stock Exchange and Hong Kong Stock Exchange. They allow you to trade stocks, ETFs, options, futures, forex, bonds and funds worldwide from a single integrated account.
You can read more about my thoughts about Interactive Brokers in this Interactive Brokers Deep Dive Series, starting with how to create & fund your Interactive Brokers account easily.
I invested in a diversified portfolio of exchange-traded funds (ETF) and stocks listed in the US, Hong Kong and London.
My preferred broker to trade and custodize my investments is Interactive Brokers. Interactive Brokers allow you to trade in the US, UK, Europe, Singapore, Hong Kong and many other markets. Options as well. There are no minimum monthly charges, very low forex fees for currency exchange, very low commissions for various markets.
To find out more visit Interactive Brokers today.
Join the Investment Moats Telegram channel here. I will share the materials, research, investment data, deals that I come across that enable me to run Investment Moats.


Do Like Me on Facebook. I share some tidbits that are not on the blog post there often. You can also choose to subscribe to my content via the email below.
I break down my resources according to these topics:
- Building Your Wealth Foundation – If you know and apply these simple financial concepts, your long term wealth should be pretty well managed. Find out what they are
- Active Investing – For active stock investors. My deeper thoughts from my stock investing experience
- Learning about REITs – My Free “Course” on REIT Investing for Beginners and Seasoned Investors
- Dividend Stock Tracker – Track all the common 4-10% yielding dividend stocks in SG
- Free Stock Portfolio Tracking Google Sheets that many love
- Retirement Planning, Financial Independence and Spending down money – My deep dive into how much you need to achieve these, and the different ways you can be financially free
- Providend – Where I used to work doing research. Fee-Only Advisory. No Commissions. Financial Independence Advisers and Retirement Specialists. No charge for the first meeting to understand how it works
- Havend – Where I currently work. We wish to deliver commission-based insurance advice in a better way.
Kyith is the Owner and Sole Writer behind Investment Moats. Readers tune in to Investment Moats to learn and build stronger, firmer wealth foundations, how to have a Passive investment strategy, know more about investing in REITs and the nuts and bolts of Active Investing.
Readers also follow Kyith to learn how to plan well for Financial Security and Financial Independence.
Kyith worked as an IT operations engineer from 2004 to 2019. Currently, he works as a Senior Solutions Specialist in Insurance Start-up Havend. All opinions on Investment Moats are his own and does not represent the views of Providend.
You can view Kyith's current portfolio here, which uses his Free Google Stock Portfolio Tracker.
His investment broker of choice is Interactive Brokers, which allows him to invest in securities from different exchanges all over the world, at very low commission rates, without custodian fees, near spot currency rates.
You can read more about Kyith here.
- New 6-Month Singapore T-Bill Yield in Late-April 2024 to Drop to 3.70% (for the Singaporean Savers) - April 18, 2024
- Golden Nuggets from JPMorgan Guide to Retirement 2024. - April 16, 2024
- Be Less Reliant on Banks and Build Stronger Capital Markets by Pushing for Better Shareholder Dividend and Buyback Yield - April 14, 2024
Sinkie
Sunday 12th of December 2021
Yeah the ATM calls will result in the "missing the best X days" situation. The premiums earned will not cover the occasional (sometimes frequent!) big rises in the Nasdaq, which is what is needed to overcome the larger drawdowns if you hold on to it long enough.
Anecdotally, the more sustainable covered call strategy I see individuals do are on megacaps or more stable dividend aristocrats, using short-dated OTM calls. This results in fewer chances of being called, giving the quality stocks time to grow in valuations. Of course the premiums earned is much lower. No free lunch.
If they do get called, they turn around & do naked put selling on those types of stocks.
Kyith
Sunday 12th of December 2021
That is probably what they term wheeling. From the research, it seems that what they are trying to avoid is holding on to the equity too much. so it is a different philosophy altogether.
Ameer
Sunday 12th of December 2021
Yes the distribution is taxed at 30% in Singapore.
Kyith
Sunday 12th of December 2021
Hi Ameer, thanks for the confirmation. I guess I missed out that it may severely capped the usefulness of this strategy.