The role of an investor prospecting businesses is to always be educated how differently they can look at a business and what they can gather from the data provided.
One of the main problems that I used to have is to assess the level of capital expenditure of a business and how to make sense of whether:
- what is the nature of this business in terms of their capital expenditure needs
- more capital expenditure is good
- less capital expenditure is good
- how do we present capital expenditure to ourselves and peers so that it reduces the overhead in interpretation
- what should it correlate with? revenue, free cash flow or profit?
Professor Damodaran has a good piece recently in his series to profile a few car based trajectories like Uber, Lyft.
In this piece, it is the possible upcoming IPO of Ferrari.
If I can take away one or two things each from these articles and they are rather impactful metrics, then this article is probably worth $2000 at least to purchase in my opinion.
I find these two metrics paints us stories that helps in our appreciation of the business.
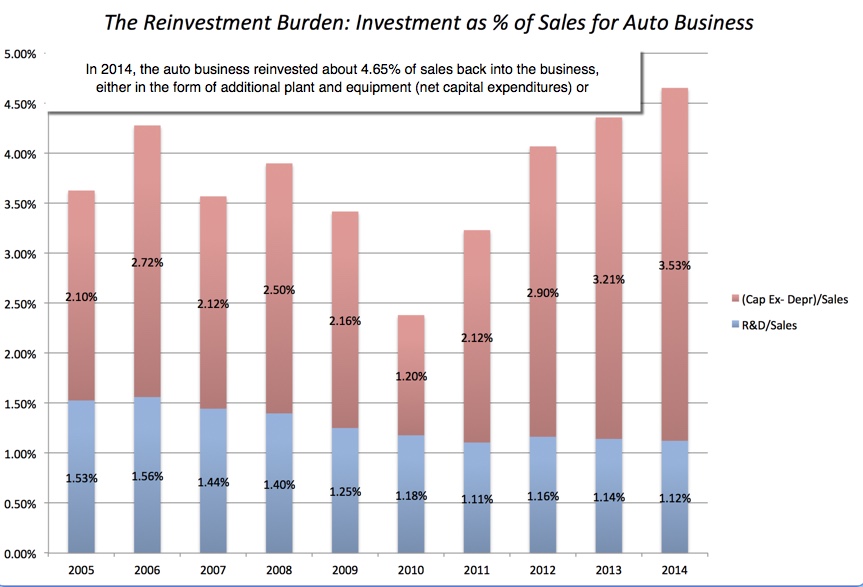

There are different ways to look at capital expenditure and one problem is you won’t know whether it is a maintenance capital expenditure or an investment of future growth. The easy way out is ask the management and hope they tell you.
If you are in early stage of research, you want to draw some questions for you to further explore, this capex ex depreciation to sales does help.
Assets in business depreciate and needs to be replaced.
In a lot of cases you need more investments to increase revenue.
The best businesses perhaps needs less investments when revenue increase. The best business may require less to maintain.
Hence this ratio over historical gives us a story.
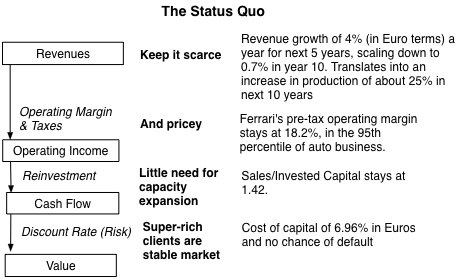

In his baseline valuation of Ferrari, he ascertains based on qualitative and past data the conservative and realistic growth rate of the revenue. Almost everything ties to the revenue, and with that you can come up with a discounted cash flow value for the company.
Of note here is the assumption that Sales / Invested Capital stays at 1.42.
How do we know that sales to invested capital stays constant? Past historical data. Relate that to the qualitative story of why sales are better that year or why sales are worse.
A constant Sales to Invested Capital shows efficient operation, and perhaps the nature of the business that you have to invest more capital as more business comes in.
A growing sales to invested capital shows a business that needs LESS capital as revenue increases. Perhaps there are economic moat in the business.
A falling sales to invested capital shows a business that perhaps under more competition requires more resources, or that it is in a stage where more invested capital is needed before tapering off
Summary
These two ratios help you form a story of a company you do not know so well. It probably shows whether there are hidden economic moats.
You still have to confirm the story. The quantitative data here tells you perhaps there is a story, but how true is the story? You got to look into similar competitors to see if you see the same trends in their competitors.
If they don’t, this is either a fraud or some damn good operator.
More stories and more things to look into.
To get started with dividend investing, start by bookmarking my Dividend Stock Tracker which shows the prevailing yields of blue chip dividend stocks, utilities, REITs updated nightly.
Make use of the free Stock Portfolio Tracker to track your dividend stock by transactions to show your total returns.
For my best articles on Starting Wealth Management, growing money check out the resources section.
Kyith is the Owner and Sole Writer behind Investment Moats. Readers tune in to Investment Moats to learn and build stronger, firmer wealth foundations, how to have a Passive investment strategy, know more about investing in REITs and the nuts and bolts of Active Investing.
Readers also follow Kyith to learn how to plan well for Financial Security and Financial Independence.
Kyith worked as an IT operations engineer from 2004 to 2019. Currently, he works as a Senior Solutions Specialist in Insurance Start-up Havend. All opinions on Investment Moats are his own and does not represent the views of Providend.
You can view Kyith's current portfolio here, which uses his Free Google Stock Portfolio Tracker.
His investment broker of choice is Interactive Brokers, which allows him to invest in securities from different exchanges all over the world, at very low commission rates, without custodian fees, near spot currency rates.
You can read more about Kyith here.
- My Dividend Experience Investing in UCITS iShares iBond Maturing in 2028. - April 23, 2024
- We Invest into Popular Funds When They Are Popular, Exactly When They Started Turning to Shxt. - April 22, 2024
- Meal Prep 2.0 – Cooking Your “Go-to” Meal that You Look Forward to Eating Everyday. - April 21, 2024
Dale
Monday 19th of October 2015
Thank you for the article. I found this rather intruiging, and it seemed to make much sense, the way to understand the metric.
However, I wonder if it might be easy for automobile companies to manipulate their reporting of sales. If yes, then the metro would inherently have a big flaw, as would be susceptible to artificial inflation.
Kyith
Tuesday 20th of October 2015
Hi Dale,
the thing is, this is not the only metric that can be easily manipulated. the data over time paints a story, and it is for us to see if that story has truth to it. so what you can layer it against is perhaps ford, or bmw's growth and see it against the global growht. if its exceptional, then they must be doing very right or very manipulative.
another one that i didn't mention is take the difference in rev and different in capex and see whether their growth requires more capex.