Last week, this investment conversation pop-up on my Twitter feed.
Stripe’s billionaire co-founder John Collison was the guest host interviewing D1 Capital’s Dan Sundheim on a wide ranging set of topics.
What caught my attention was Dan’s comment to John’s question out of all the FAANGM, which would be his bet for the next decade. His answer was Amazon.
You can forward to 3 min 10 sec to listen to Dan’s Amazon thesis.
At 5 min 22 sec, Dan values Amazon at 20 times 2023 price-earnings. For someone who could not pay attention to every stock in the universe, it was a bit mind-boggling as I always remember Amazon trades at a Price Earnings closer to 70 times.
In fact, on a historical basis, Amazon currently trades closer to 53 times price-earnings.
So in this article, I wanted to do some research, take some notes to see how Dan’s Amazon model would work out.
Amazon’s Revenue Growth
| 2019 | 2020 | 2021 | |
| Q1 | 26.3% | 43.9% | |
| Q2 | 19.9% | 40.3% | |
| Q3 | 23.7% | 37.5% | |
| Q4 | 20% | 43.8% |
The table above shows Amazon’s year-on-year revenue growth over the past two years.
The COVID pandemic accelerated its growth. The growth in the last 4 quarters were much higher than 2019.
It is interesting that Amazon have been growing its revenue at a high rate before the pandemic. Since the pandemic, growth can still be pulled forward.
This may indicate just how much addressable market Amazon can still grow into.
Going forward, it would be less conservative if we use a 30% revenue growth in our planning, although Amazon guided a year-over-year growth of 24% to 30% in sales for Q2 2021 (which was pulled forward by the pandemic).
Net Income
| in billions | 2017 | 2018 | 2019 | 2020 | 2021 |
| Q1 | $1.6 | $3.6 | $2.5 | $8.2 | |
| Q2 | $0.20 | $2.5 | $2.6 | $5.2 | |
| Q3 | $0.26 | $2.9 | $2.1 | $6.3 | |
| Q4 | $1.9 | $3.0 | $3.3 | $7.2 |
The table above shows Amazon’s net income each quarter.
What you will notice is that year-on-year, the net income have grown at a tremendous pace since 2017.
In the past, Amazon was known for not having earnings and people were wondering if their earnings were sustainable.
Hindsight, if I understood the model better, I would have been able to benefit from its written.
Still, its interesting to see Amazon’s operating leverage taking place in front of our eyes.
Where is the Operating Leverage for Amazon Coming From?
Some companies need to build out their fixed costs. These could include recurring marketing, research and development, capital investments. Investing in these fixed costs allows the company to push themselves further in front of their competitors or to catch up with their competitors.
If they managed to establish their economic moat, such as great network effects, superior technologies, they can then reduce or maintain the current level of absolute spending.
Typically, revenue is still growing at a high rate and when operating expense do not grow as fast as revenue, we will see the incremental revenue flowing to the net income.
This is what happen for Amazon.
Amazon’s Growing Net Profit Margins
| 2017 | 2018 | 2019 | 2020 | 2021 | |
| Q1 | 3.2% | 6.0% | 3.4% | 7.5% | |
| Q2 | 0.5% | 4.7% | 4.1% | 5.9% | |
| Q3 | 0.6% | 5.1% | 3.0% | 6.6% | |
| Q4 | 3.1% | 4.1% | 3.8% | 5.8% |
The table above shows the net profit margin of Amazon.
You would notice that year-on-year the net profit margin have been going up over time.
There should be some operating leverage somewhere.
But in which area is Amazon controlling their costs or not increasing their commitment?
Out of all the operating expenses, the cost of sales is the most substantial cost, followed by fulfilment and tech spending.
Here is a table to give you guys a sensing:
| in billions | Q1 2018 | Q1 2021 |
| Cost of Sales | $30.7 | $62.4 |
| Fulfilment | $7.8 | $16.5 |
| Tech | $2.7 | $12.5 |
| Marketing | $6.7 | $6.2 |
| General and Administrative | $1.0 | $2.0 |
Let us take a look at each cost area.
Amazon’s Gross Margins
We examine Amazon’s gross margin to see if there were any improvements in their optimization of their cost of sales:
| 2017 | 2018 | 2019 | 2020 | 2021 | |
| Q1 | 39.8% | 43.2% | 41.4% | 42.5% | |
| Q2 | 38.3% | 42.0% | 42.7% | 40.7% | |
| Q3 | 37.1% | 41.6% | 40.9% | 40.7% | |
| Q4 | 36.4% | 38.3% | 37.9% | 36.6% |
Largely speaking, gross margins has went up since 2017. However, we did not see any clear trend that Amazon have some advantage here.
Amazon’s Fulfilment Cost as a Percentage of Revenue
| 2017 | 2018 | 2019 | 2020 | 2021 | |
| Q1 | 15.3% | 14.4% | 15.3% | 15.2% | |
| Q2 | 13.5% | 15.0% | 14.7% | 15.5% | |
| Q3 | 14.6% | 14.7% | 14.4% | 15.3% | |
| Q4 | 14.9% | 13.8% | 14.0% | 14.8% |
Fulfilment cost have gone up more over time.
Amazon’s Spending on Technology has also Gone Up
| 2017 | 2018 | 2019 | 2020 | 2021 | |
| Q1 | 5.3% | 6.1% | 12.3% | 11.5% | |
| Q2 | 5.9% | 5.5% | 14.2% | 11.6% | |
| Q3 | 5.7% | 5.8% | 13.2% | 11.3% | |
| Q4 | 5.6% | 6.8% | 11.2% | 9.6% |
Technology spending was largely in check but since 2019, Amazon have ramped up their spending in technology.
Amazon’s Marketing Expenses as a Percentage of Revenue Reduced Year-on-Year
| 2017 | 2018 | 2019 | 2020 | 2021 | |
| Q1 | 13.1% | 13.2% | 6.4% | 5.7% | |
| Q2 | 14.6% | 13.6% | 6.8% | 4.8% | |
| Q3 | 13.5% | 12.6% | 6.7% | 5.6% | |
| Q4 | 10.4% | 10.6% | 7.1% | 5.9% |
Perhaps the most significant improvement can be seen in the improvement of marketing expense. Marketing expense on an absolute basis have not gone up over time, and there is a clear trend that marketing cost has redued.
General and Administrative Expenses Kept in Line
| 2017 | 2018 | 2019 | 2020 | 2021 | |
| Q1 | 2.0% | 2.0% | 1.9% | 1.8% | |
| Q2 | 2.3% | 2.1% | 2.0% | 1.8% | |
| Q3 | 2.2% | 1.8% | 1.9% | 1.8% | |
| Q4 | 1.7% | 1.5% | 1.6% | 1.6% |
General and administrative expense have largely maintained.
In summary, I think it will be a bit deceptive where the overall margin improvement will come from. Most likely, cost of sales, fulfillment and tech spending are areas to optimize because they are a larger proportion of Amazon’s cost but judging by this short profile, I could not tell clearly if they could cut this down.
Most likely, we will have to adopt trust and verify.
Can Amazon Forward Price Earning be 20 Times?
So how realistic is Dan Sundheim’s assessment that Amazon can trade at 20 times 2023 GAAP Earnings per share?
I think it is quite possible but its kinda pushing things.
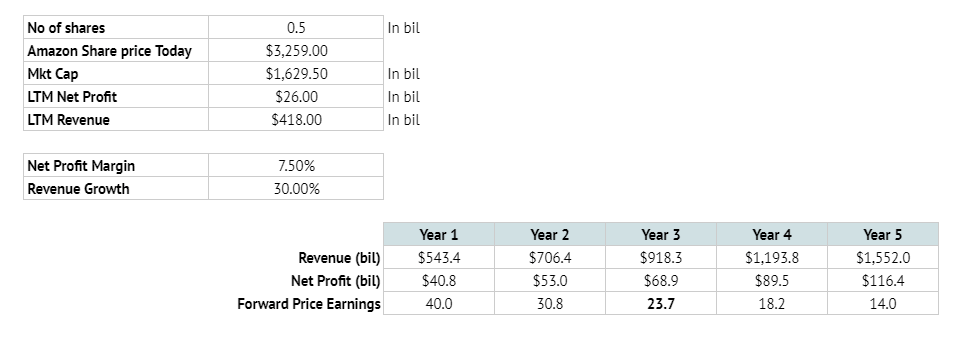
The table above shows my estimation. Currently, Amazon trades at $3259 a share and if we tally the last 4 quarter’s net income, the income aggregates to $26 bil.
If we use a current net profit margin of 7.5% and a less conservative revenue growth of 30%, in year 3, the forward price earnings is 23.7 times.
Can Amazon grow its revenue 30% in the next 3 years? It is possible but if the pandemic pulled the company forward and the best they could grow in this environment was around 40%, I just felt that this kind of projection is a tad optimistic.
Chris Bloomstran thinks that it is likely that Amazon can increase their net profit margins to 10%.
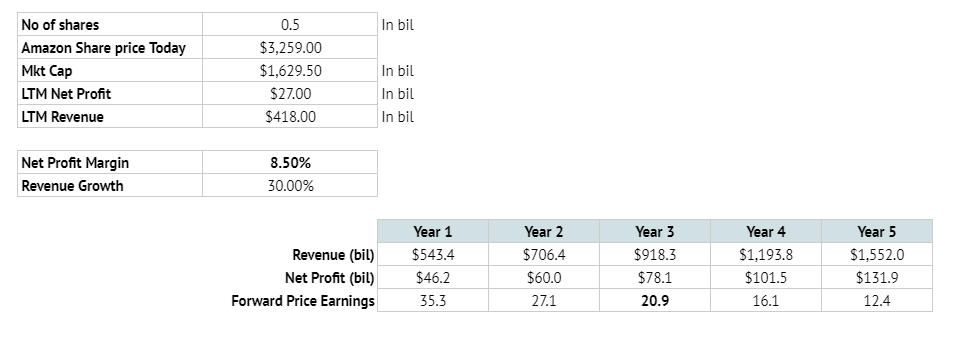
If we change the net profit margin to 8.5% a year on average for the next 3 to 5 years, we can see ourselves get very close to Dan Sundheim’s projection.

I think what is more conservative is if we assume an average revenue growth of 20% instead of 30% with net profit margin staying at 7.5%.
The price earnings in year 3 is closer to 30 times.
Some would think that 30 times PE is rather fair but it really depends on what you think you get.
If you look beyond year 3, by 2025, it would trade at a forward price earnings of 20.9 times.
If Amazon doesn’t grow greater than the economy (a big if), you would get
- A wide-moat logistics player, who has built out its infrastructure to such an extent that it would be damn challenging for some other firm to beat their advantage.
- One of the dominant cloud services player
- An advertising powerhouse that depends so much less on others to give the company the signals required to push relatable adverts to each individual
- Call options on a few other businesses such as pharmacy, media, streaming
It is likely you can get a 5% earnings yield + GDP growth after these 5 years of build-out. I think this model is conservative.
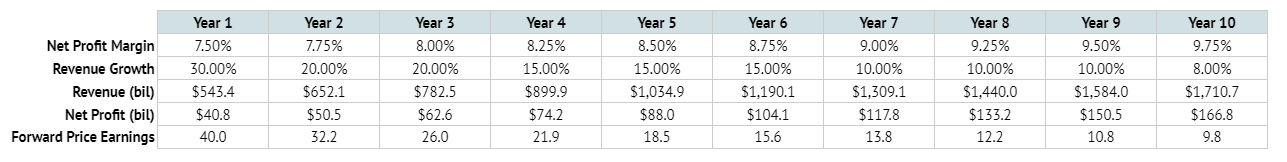
If I were to estimate the profit using increasing net profit margins and declining revenue growth, we will get the schedule above.
I learned over time that if a business is great, this model will tend to be too conservative. A durable business like this should trade at a higher multiple than 10-15 times PE in the future.
The question is whether Amazon has a great business model because if the business model is not great, then it can be dangerous to use this kind of growth rate for a business that is already trading at $1.6 trillion.
Some More Resources on Amazon
I have also encountered some Amazon resources that might interest you.
- Irving Soh’s Deep Dive on Why He Bought Amazon
- Bill Miller’s investment in Amazon
- Just in: Amazon buys MGM for $9 billion
- Benedict Evan’s Archive on Amazon
- Hayden Capital Q1 2021 letter: Why they sold their last remaining Amazon stake
If you want to trade these stocks I mentioned, you can open an account with Interactive Brokers. Interactive Brokers is the leading low-cost and efficient broker I use and trust to invest & trade my holdings in Singapore, the United States, London Stock Exchange and Hong Kong Stock Exchange. They allow you to trade stocks, ETFs, options, futures, forex, bonds and funds worldwide from a single integrated account.
You can read more about my thoughts about Interactive Brokers in this Interactive Brokers Deep Dive Series, starting with how to create & fund your Interactive Brokers account easily.
I invested in a diversified portfolio of exchange-traded funds (ETF) and stocks listed in the US, Hong Kong and London.
My preferred broker to trade and custodize my investments is Interactive Brokers. Interactive Brokers allow you to trade in the US, UK, Europe, Singapore, Hong Kong and many other markets. Options as well. There are no minimum monthly charges, very low forex fees for currency exchange, very low commissions for various markets.
To find out more visit Interactive Brokers today.
Join the Investment Moats Telegram channel here. I will share the materials, research, investment data, deals that I come across that enable me to run Investment Moats.


Do Like Me on Facebook. I share some tidbits that are not on the blog post there often. You can also choose to subscribe to my content via the email below.
I break down my resources according to these topics:
- Building Your Wealth Foundation – If you know and apply these simple financial concepts, your long term wealth should be pretty well managed. Find out what they are
- Active Investing – For active stock investors. My deeper thoughts from my stock investing experience
- Learning about REITs – My Free “Course” on REIT Investing for Beginners and Seasoned Investors
- Dividend Stock Tracker – Track all the common 4-10% yielding dividend stocks in SG
- Free Stock Portfolio Tracking Google Sheets that many love
- Retirement Planning, Financial Independence and Spending down money – My deep dive into how much you need to achieve these, and the different ways you can be financially free
- Providend – Where I used to work doing research. Fee-Only Advisory. No Commissions. Financial Independence Advisers and Retirement Specialists. No charge for the first meeting to understand how it works
- Havend – Where I currently work. We wish to deliver commission-based insurance advice in a better way.
Kyith is the Owner and Sole Writer behind Investment Moats. Readers tune in to Investment Moats to learn and build stronger, firmer wealth foundations, how to have a Passive investment strategy, know more about investing in REITs and the nuts and bolts of Active Investing.
Readers also follow Kyith to learn how to plan well for Financial Security and Financial Independence.
Kyith worked as an IT operations engineer from 2004 to 2019. Currently, he works as a Senior Solutions Specialist in Insurance Start-up Havend. All opinions on Investment Moats are his own and does not represent the views of Providend.
You can view Kyith's current portfolio here, which uses his Free Google Stock Portfolio Tracker.
His investment broker of choice is Interactive Brokers, which allows him to invest in securities from different exchanges all over the world, at very low commission rates, without custodian fees, near spot currency rates.
You can read more about Kyith here.
- New 6-Month Singapore T-Bill Yield in Late-April 2024 to Drop to 3.70% (for the Singaporean Savers) - April 18, 2024
- Golden Nuggets from JPMorgan Guide to Retirement 2024. - April 16, 2024
- Be Less Reliant on Banks and Build Stronger Capital Markets by Pushing for Better Shareholder Dividend and Buyback Yield - April 14, 2024