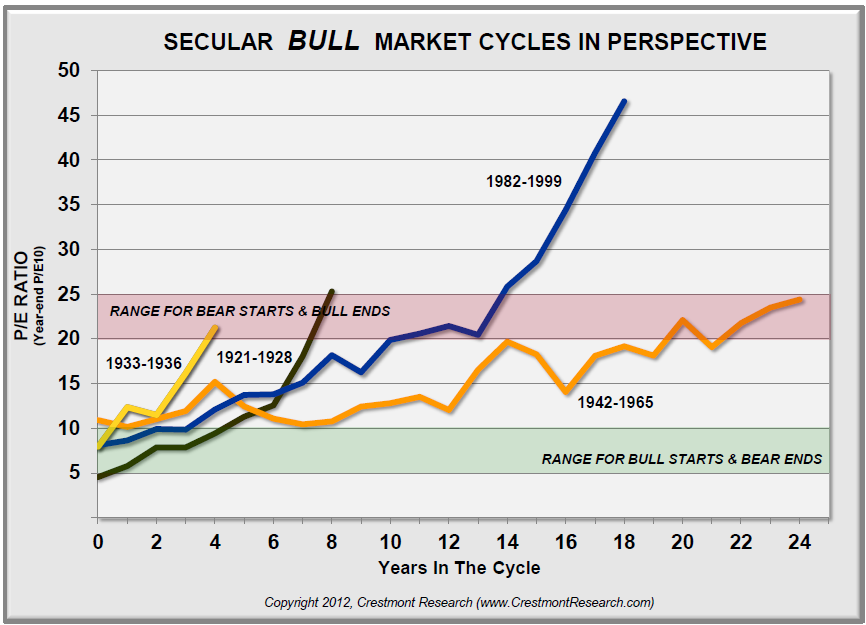
Looks like we are still far off from PE point of view. Almost all PE gets to the 10 region.
It also depends on your how you compute the PE. The PE in 2009 did get down to nearly 12 for S&P 500.
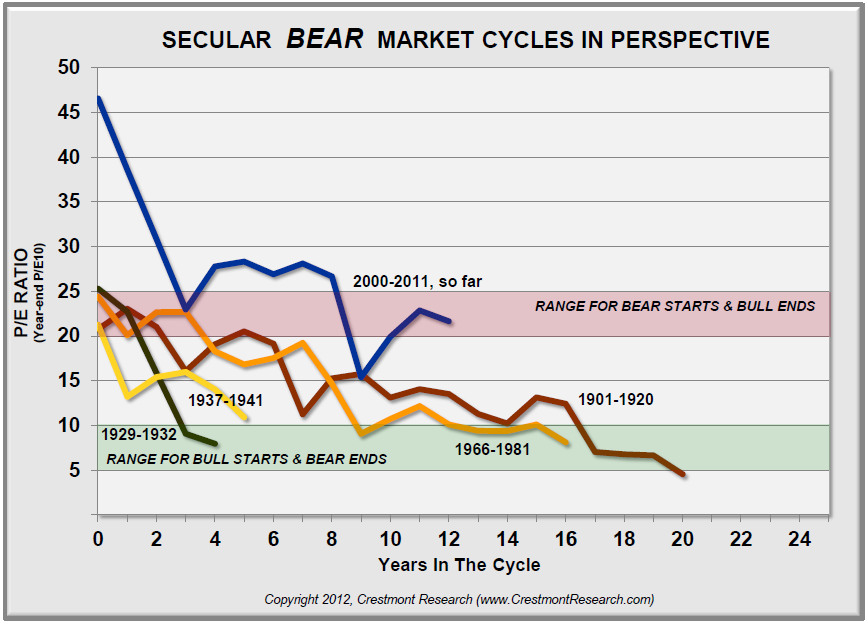
Currently, it looks very close to 1901 to 1920.
These charts are from Crestmont research, and they do have a comment to make of the PE used:
The driver of secular stock market cycles is the inflation rate–toward or away from price stability. That causes significant changes in the level of P/E, the multiplier of earnings that causes above- and below-average return periods. Some analysts do combine the secular periods from the late ‘20s to the early ‘40s, but that masks the fundamentals of underlying cycles. For the ’20s-’40s, the first cycle was a decline into deflation (bear), then the return to price stability (bull), then the upward trend of inflation (bear). Please visit the Crestmont website for more articles and charts. P.S. picksjr, the E & P/E are year-end values using the method popularized by Shiller (Year-end P/E10).
[Hattip Ritholtz]
Kyith is the Owner and Sole Writer behind Investment Moats. Readers tune in to Investment Moats to learn and build stronger, firmer wealth foundations, how to have a Passive investment strategy, know more about investing in REITs and the nuts and bolts of Active Investing.
Readers also follow Kyith to learn how to plan well for Financial Security and Financial Independence.
Kyith worked as an IT operations engineer from 2004 to 2019. Currently, he works as a Senior Solutions Specialist in Insurance Start-up Havend. All opinions on Investment Moats are his own and does not represent the views of Providend.
You can view Kyith's current portfolio here, which uses his Free Google Stock Portfolio Tracker.
His investment broker of choice is Interactive Brokers, which allows him to invest in securities from different exchanges all over the world, at very low commission rates, without custodian fees, near spot currency rates.
You can read more about Kyith here.
- New 6-Month Singapore T-Bill Yield in Late-April 2024 to Drop to 3.70% (for the Singaporean Savers) - April 18, 2024
- Golden Nuggets from JPMorgan Guide to Retirement 2024. - April 16, 2024
- Be Less Reliant on Banks and Build Stronger Capital Markets by Pushing for Better Shareholder Dividend and Buyback Yield - April 14, 2024
Invest Apprentice
Friday 3rd of August 2012
Sorry Drizzt, how do we interpret the graphs? What does it mean to be in the range for "bear starts and bulls end"? Does it suggest we will likely go further down until P/E reaches 10 range?
Invest Apprentice
Friday 3rd of August 2012
Sorry Drizzt, how do we interpret the graphs?