We take a look at the long term charts again today.
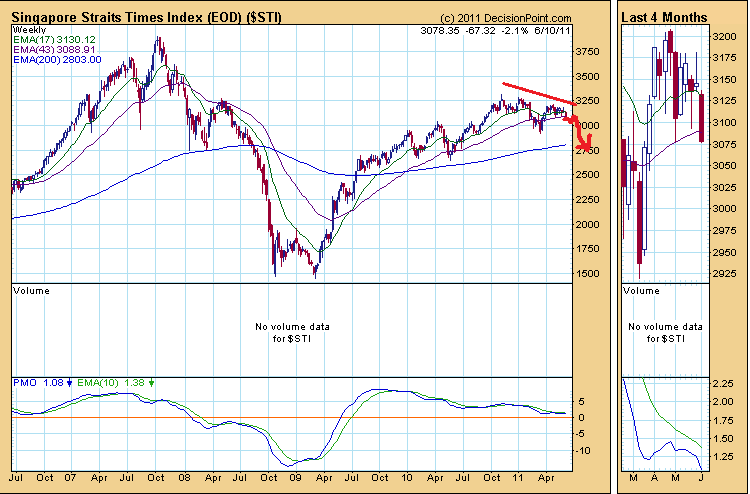

The key here is that since our last analysis in May, Singapore markets have been doing what I have highlighted, which is hanging around and drifting lower.
The 13 week EMA and 43 week EMA are coming together soon. I see either
- a continual consolidation in weekly prices and a break up or a break down after that
- or a sharp draw down starting next week
Both occurrence have a high likelihood to create a death cross with the 2 weekly moving average which will point to long term downside.
Price target then would be 2750 at the 200 EMA representing a 10% draw down from here.
The other possibility is for a break up after the consolidation. Look for prices breaking above the falling peaks (red line) as an indication to go long. This will be a resumption of the bull market.
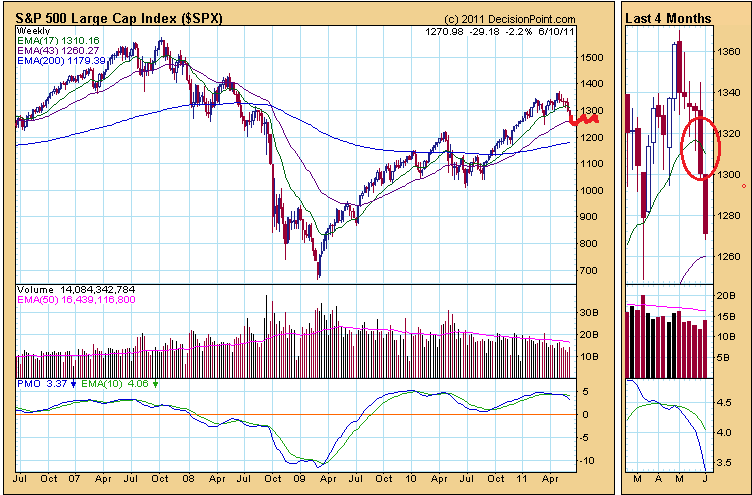

Looking at the S&P 500 action, we see the 17 EMA starting to turn down as well and we need to be aware that we are looking at weekly charts which means the inertia to change directions readily is very small.
Together with the distance between the 17 and 43 day EMA, I do favor that the market will move sideways for a while before things become clearer.
Portfolio Changes
My decision in recent actions have been to cut out most of the growth and volatile counters that are bought pretty high and take profits to a comfortable level. I still have some more to do.
You can take a look at my recent transactions on my current portfolio here.
There should be a bounce somewhere now so it will be a place to consolidate your portfolio.
Learn to use our Free Stock Portfolio Tracking Google Spreadsheet to track your portfolio.
Kyith is the Owner and Sole Writer behind Investment Moats. Readers tune in to Investment Moats to learn and build stronger, firmer wealth foundations, how to have a Passive investment strategy, know more about investing in REITs and the nuts and bolts of Active Investing.
Readers also follow Kyith to learn how to plan well for Financial Security and Financial Independence.
Kyith worked as an IT operations engineer from 2004 to 2019. Currently, he works as a Senior Solutions Specialist in Insurance Start-up Havend. All opinions on Investment Moats are his own and does not represent the views of Providend.
You can view Kyith's current portfolio here, which uses his Free Google Stock Portfolio Tracker.
His investment broker of choice is Interactive Brokers, which allows him to invest in securities from different exchanges all over the world, at very low commission rates, without custodian fees, near spot currency rates.
You can read more about Kyith here.
- Golden Nuggets from JPMorgan Guide to Retirement 2024. - April 16, 2024
- Be Less Reliant on Banks and Build Stronger Capital Markets by Pushing for Better Shareholder Dividend and Buyback Yield - April 14, 2024
- The LionGlobal APAC Financials Dividend Plus ETF Won’t Give Singapore Investors 5% Dividend Yield Always. Further personal thoughts (with some data). - April 13, 2024