Drizzt: long term market analysis is a series once or twice a month where we take a look at longer term trends in the market to get our bearings right on the general direction of where market prices is going.
The price movement is mirroring that of 2011 second half of the year. Lots of bad news, lots of whipsaws. This makes life for investors difficult.
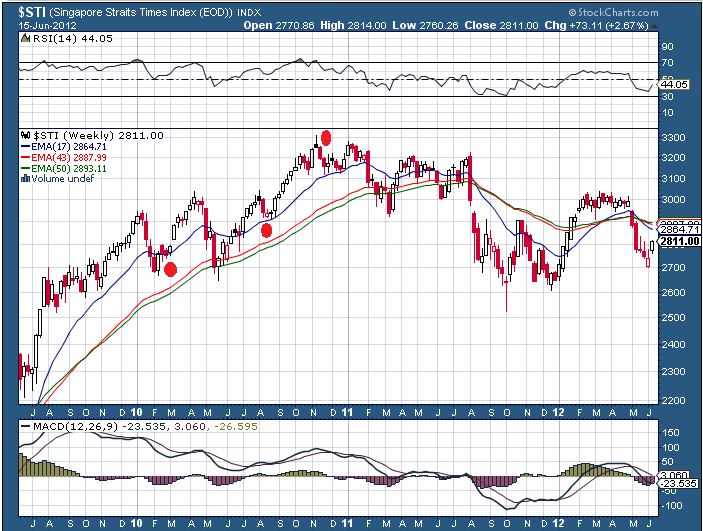
Weekly S&P500 and STI
The long term indicator we use is the cross over between the 17 week EMA and the 43 week EMA. A cut of the 17 week EMA below the 43 week EMA from above signifies an underweight and risk management position. A cut of the 17 week EMA above the 43 week EMA from below signifies an overweight position in equities.
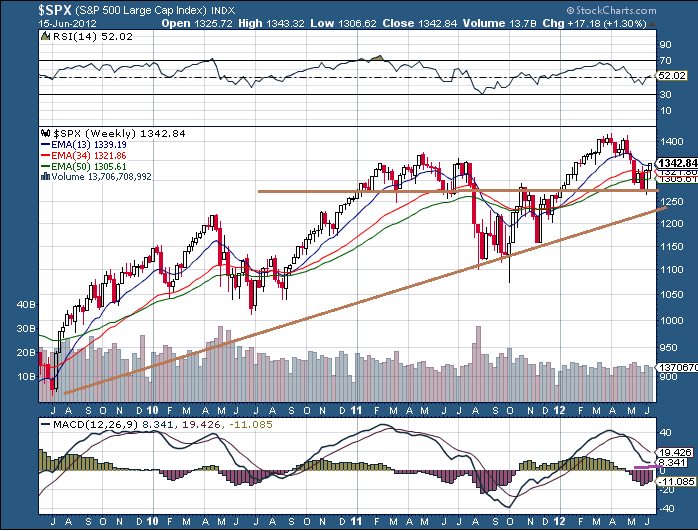
Many would have thought that the Greece voting on June 17 would be the selling climax but markets have held up very well. The S&P 500 have put in higher lows and judging by the 13 week EMA have start to turn up diverging from the 34 week and 50 week EMA.
The US market in this trying time looks the best when you put them up against China’s slowdown, Europe’s woes and perhaps have caught many doom mongers off guard.
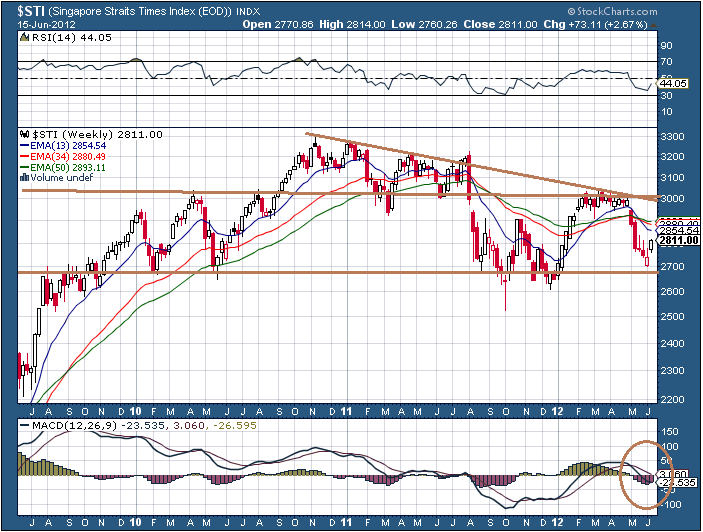
In contrast, while the US market made higher highs, the STI was not able to clear end 2010 highs. With the number of times the index tested the 3000 level, the bulls clear this level and might be in for more bullish times. As of now we got another bounce off 2700 which becomes a rather significant support.
I started experimenting a bit with the 13/34 week pairing instead of 17/43 week. Essentially I find the 17/43 to be slower but you get less whipsaw for highly volatile stocks or indexes such as gold and oil.
The weak STI shows a death cross, which indicates that you may want to clear some high beta stocks. With a nice 2% weekly bounce, my suggestion is wait to see what happens in the next 2 weeks. If the price fails to go above or stay above the tight band 2850-2880 and comes straight down, that is probably a strong indication the 13 or 17 week EMA will widen downwards versus the 34 or 43 week EMA.
Bradley Turn Dates
The Bradley model is a hocus pocus stock market indicator. It was invented by Donald Bradley in 1948 as part of the book “Stock Market Prediction – The Planetary Barometer and How to Use It”. I wouldn’t even call it Technical Analysis but group them together with Feng Shui prediction as it is based on planetary movement.
The thing about these models is that they may sound out of these world but like Feng Shui, I believe they have influence on how things revolves in this world.
Here are the Bradley Turn Dates for 2011:
The magnitude of the up and downs are not as important as the turns. It makes a few minor turns but also what he thinks are major turns. These would be market in bold
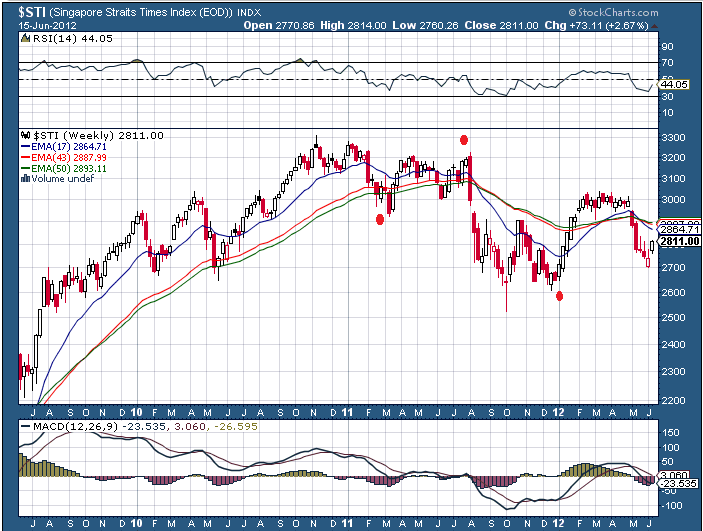

I marked the major turns in red dots.
Here are the Bradley turn dates 2010:

Probably not as accurate as we would like
Here are the 2012 Bradley turn dates
And the year up till now
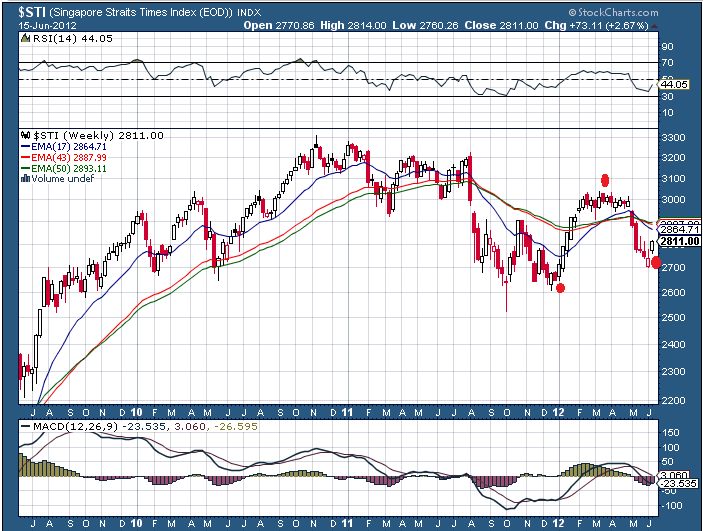

Interesting hocus pocus! So based on these turns this melt up may last till July 28 and from then onwards we will endure 4 months of downwards whip saw.
Caveat: I don’t have a long track record studying these turns, my gut feel is that there are many failure points and using this for trading can be suicidal. But you may want to entertain yourself by keeping watch of it to see if what is predicted based on this model comes through.
For those interested in tracking my most current holdings, you can review my portfolio over here. Learn to use our Free Stock Portfolio Tracking Google Spreadsheet to track stock transactions.
Kyith is the Owner and Sole Writer behind Investment Moats. Readers tune in to Investment Moats to learn and build stronger, firmer wealth foundations, how to have a Passive investment strategy, know more about investing in REITs and the nuts and bolts of Active Investing.
Readers also follow Kyith to learn how to plan well for Financial Security and Financial Independence.
Kyith worked as an IT operations engineer from 2004 to 2019. Currently, he works as a Senior Solutions Specialist in Insurance Start-up Havend. All opinions on Investment Moats are his own and does not represent the views of Providend.
You can view Kyith's current portfolio here, which uses his Free Google Stock Portfolio Tracker.
His investment broker of choice is Interactive Brokers, which allows him to invest in securities from different exchanges all over the world, at very low commission rates, without custodian fees, near spot currency rates.
You can read more about Kyith here.
- New 6-Month Singapore T-Bill Yield in Late-April 2024 to Drop to 3.70% (for the Singaporean Savers) - April 18, 2024
- Golden Nuggets from JPMorgan Guide to Retirement 2024. - April 16, 2024
- Be Less Reliant on Banks and Build Stronger Capital Markets by Pushing for Better Shareholder Dividend and Buyback Yield - April 14, 2024